Abstract
Dual‐energy computed tomography (DECT) is a relatively recent development in the imaging of gouty arthritis. Its availability and usage have become increasingly widespread in recent years. DECT is a non‐invasive method for the visualisation, characterisation and quantification of monosodium urate crystal deposits which aids the clinician in the early diagnosis, treatment and follow‐up of this condition. This article aims to give an up to date review and summary of existing literature on the role and accuracy of DECT in the imaging of gout. Techniques in image acquisition, processing and interpretation will be discussed along with pitfalls, artefacts and clinical applications.
Keywords: DECT, dual‐energy CT, gout, gouty arthritis, urate
Introduction
Acute gouty arthritis is the manifestation of periarticular inflammatory response to the presence of monosodium urate (MSU) crystal deposition in the soft tissues and joints. Its classical symptom of ‘podagra’ or pain affecting the first metatarsophalangeal (MTP) joint was described in Egypt as early as 2640 B.C.1 Today, it is the most common crystal arthropathy with a prevalence of approximately 4% in the American adult population.2 Its incidence and prevalence continues to increase, mostly affecting men in the 30‐ to 50‐year age group.3 Gout represents a major healthcare burden due to its morbidity, particularly its propensity to cause severe pain, as well as mortality, given its association with metabolic syndrome,4 coronary heart disease5 and diabetes mellitus.6 Early recognition and diagnosis of the disease is therefore necessary for commencing prompt, appropriate treatment and thus minimising complications like joint destruction, tendon rupture, renal and cardiac disease, which can arise from a delayed diagnosis.
The diagnosis of gout has traditionally been based on clinical findings, laboratory results and joint aspirates, with imaging as an adjunct. Typically, patients may present with clinical features of pain affecting the peripheral joints, frequently mono‐articular and affecting the first MTP joint, together with hyperuricaemia on haematological investigations. However, atypical presentations of gout have been described with increasing frequency in certain population groups, such as the elderly, those with genetic predispositions, enzyme deficiencies, prosthetic implants and on immunosuppressant therapy.7 It may mimic other conditions such as septic arthritis, osteoarthritis, rheumatoid arthritis, pseudogout and even periarticular tumours. Gout can also coexist with other arthropathies, further confounding the diagnosis.8 Hyperuricaemia is an inconsistent finding and may be absent in up to 42% of patients who present with an acute attack of gouty arthritis.9 On the other hand, elevated serum urate levels may not always result in urate crystal deposition or clinical manifestations of gout, a condition termed ‘asymptomatic hyperuricaemia’.10 The identification of negative birefringent MSU crystals from joint aspirate under polarised microscopy is still considered the ‘gold standard’ for the diagnosis of gout. This is, however, not always possible when there is insufficient volume of joint fluid to be aspirated, or in cases where the affected joint is inaccessible. In the acute setting of gout, joint aspirates may also be negative in 25% of cases.11 In addition, joint aspiration remains an invasive procedure, which although considered relatively safe, still carries a small risk of complications.
This article will aim to provide an overview of the modern applications of dual‐energy computed tomography (CT) as a valuable, non‐invasive imaging modality in the diagnosis of gout.
Conventional Imaging Modalities
Various non‐invasive imaging modalities such as radiography, sonography, conventional (single‐energy) CT and magnetic resonance imaging (MRI), have been used for the evaluation and diagnosis of gout. Classical radiographic findings of ‘punched out’ or ‘rat bite’ erosions with overhanging edges and sclerotic margins are only seen late in the disease. Similarly, gouty tophi seen as periarticular soft tissue masses on radiographs, are a sign of disease chronicity.12 Sonography has shown promise in the diagnosis of gout. Its advantages include easy availability in outpatient centres, relatively low cost, portability, absence of ionising radiation and no requirement of intravenous contrast material for depicting vascularity.12 Joint effusion, synovitis and erosions can often be discerned on sonography. It also has the ability to image hyperechoic deposits of urate crystals on hyaline cartilage, which together with the underlying subchondral cortical outline, gives the appearance of the ‘double contour sign’.13 The limitations of sonography are its inability to image deep structures or joints, a steep learning curve and a high level of operator dependence involved. Conventional, single‐energy CT can demonstrate erosions and hyperdense tophi with high sensitivity, though these findings remain of insufficient specificity for the diagnosis of gout. The use of MRI in the evaluation of gout has not been extensively studied. This may be due to its limited availability, long imaging time and high cost. MRI can depict cortical erosions, marrow oedema and gouty tophi, which may have variable signal characteristics depending on the amount of calcium present.12 Again, these imaging features are not specific for gout, and often the diagnosis can only be inferred by correlating with disease distribution and other clinical features.
None of the methods described above are sufficiently sensitive or specific for the diagnosis of gout, which relies on the identification of MSU crystals. It is in this setting that dual‐energy CT (DECT) offers the unique capability for the non‐invasive detection of these crystals earlier in the course of the disease.
Dual‐Energy CT (DECT)
The fundamental principle behind the use of DECT is to differentiate materials based on their relative absorption of X‐rays at different photon energy levels (typically at 80 and 140 kVp). Ideally, the materials to be differentiated should be simultaneously imaged at the two different energy levels. The differential attenuation of the material examined would be directly related to its atomic weight and electron density.14 Early attempts at its implementation were hampered by the lack of appropriate hardware, resulting in mis‐registration due to sequential acquisition with long acquisition times, high image noise, low spatial resolution and high radiation dose as a consequence of inefficient tube design.15 Subsequent scanners adopted a single‐source and single‐detector system utilising an X‐ray source capable of alternation between two peak voltage settings (‘kV switching’) to achieve the desired result.16 With advances in CT technology, current machines, termed dual‐source DECT scanners, are able to perform simultaneous acquisitions at two energy levels (80 and 140 kVp) using two separate sets of X‐ray tubes and detectors positioned 90 to 95 degrees apart.17 Using a combination of independent tube current modulation, iterative reconstruction and integrated circuits within the detector module, high‐resolution images with excellent material separation are possible without an increase in radiation dose compared to conventional single‐energy scans.18
Image Acquisition
The dual‐source DECT scanner with two separate 80 and 140 kVp tubes commonly employs tin filtration of the 140 kVp tube to enable superior spectral contrast differentiation between urate and non‐urate depositions.19 For single tube configurations, two methods of kV switching are offered. Standard kV switching in older setups utilise a rotate‐ switch‐ rotate approach; two separate rotations are required with a first 80 kVp acquisition followed by a second pass 140 kVp rotation. The non‐simultaneous and longer acquisition times can lead to mis‐registration artefacts. Fast kV switching techniques,20 employ dynamic switching of the tube voltage between 140 and 80 kVp at rapid intervals of <0.5 msec in a single projection. This provides good temporal and spatial resolution but optimised spectral filtration (e.g. tin filtration) cannot be employed in such a setup,16 and anatomical dose modulation and reduction techniques are ineffective due to the relatively fixed high tube current.
Single layer detectors with separate detectors dedicated to each x‐ray tube allows simultaneous data acquisition in the dual‐source setup. Recent advances have led to single‐source systems with dual layer detectors, with the superficial layer capturing high energy and the deeper layer capturing the lower energy photons, allowing near perfect temporal and spatial registration,21 albeit at the cost of reduced spectral differentiation.
The collimated tube data requires reconstruction with appropriate post‐processing DECT kernels at a resolution and slice width sufficient to detect small urate deposits – for reference, we employ a tube collimation of 0.6 mm with 2 mm slice thickness reconstruction. Post‐processing DECT kernels vary between different manufacturers and due attention must be given to ensure that appropriate settings are employed for that specific system to prevent misinterpretation and artefacts.
The radiation dose for each region scanned (e.g. bilateral hands and wrists as one region) is variable but is estimated at 0.5 mSv in a modern dual tube, dual‐energy scanner. The most commonly involved peripheral joints imaged include the elbows, wrists, hands, knees ankles and feet. The joints are usually imaged bilaterally, regardless of the affected side. Operators should be cognizant to the fact that in some of the dual‐source DECT scanner designs, tube B has a smaller field‐of‐view (FOV), for example 330 mm compared to tube A, for example 500 mm. Care should be taken to ensure all anatomic regions to be scanned are encompassed within the smaller FOV for datasets at both energy levels to be obtained. The smaller FOV is depicted as a ring on both the CT console as well as in the post‐processing software on our setup. Newer generation scanners enable scanning at full FOVs with both tubes under certain conditions.
Post‐Processing
The acquired datasets are reconstructed in the required planes and processed with dual‐energy software utilising a two‐material decomposition algorithm designed for specific clinical applications. In the gout algorithm, this is performed to separate MSU from calcium using soft tissue as the baseline. The two‐material decomposition algorithm is based on the principle that materials with a high atomic number such as calcium would demonstrate a higher increase in attenuation at higher photon energies than does a material composed of low atomic number materials such as MSU, which is independent of density or concentration of the material or tissue. A graphical representation from a screenshot from Syngo dual‐energy software (Siemens Healthcare) illustrates this concept (Fig. 1). CT values (in Hounsfield Units) for the materials to be separated are plotted on a graph with high kilovoltage attenuation values on the y‐axis and low kilovoltage values on the x‐axis, and compared relative to a straight line plot of a base material – usually soft tissue. Pixels with a higher slope would represent a material with a high atomic number (e.g. calcium) and placed above the soft tissue reference line. Pixels plotted below the line would represent uric acid which comprises elements of lower atomic numbers.14 Once separated and characterised, the materials are colour‐coded and overlaid on multi‐planar reformatted cross‐sectional and volumetric‐rendered images. On our software, green pixels represent MSU, blue outlines cortical bone and purple depicts trabecular or cancellous bone (Fig. 2). The post‐processing software enables real‐time manipulation of the images at source resolution, in any plane and in two‐ as well as three‐dimensions, to best depict the MSU deposits. Snapshots of relevant processed images can then be transferred to the picture archiving system (PACS). Corresponding pre‐processed grey‐scale images are also reviewed for presence of bony erosions, hyperdense soft tissues, joint effusions, as well as for other pathologies or incidental findings.
Figure 1.
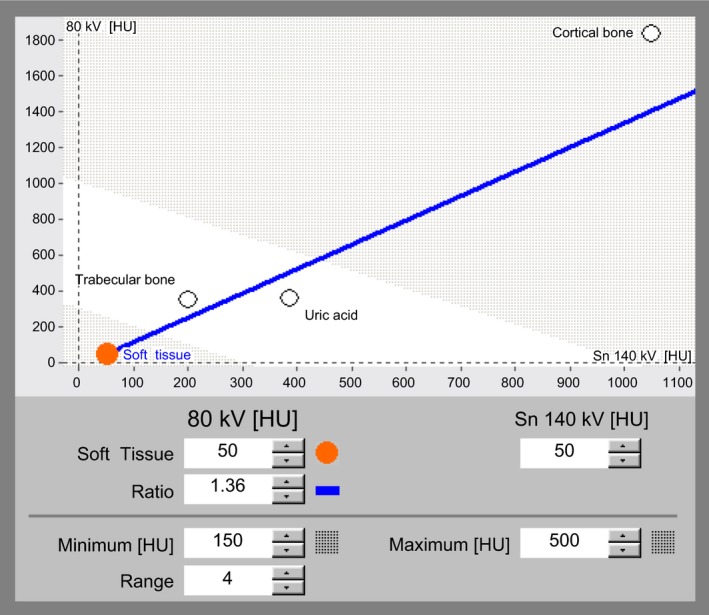
Screenshot from Syngo dual‐energy gout application shows a graphical representation of two‐material decomposition algorithm. Attenuation values at low energy (80 kVp) are plotted on the y‐axis and values at high energy (140 kVp) on the x‐axis. The soft tissue reference line (depicted in blue) separates materials with high atomic weight, such as calcium in cortical bone from materials with low atomic weight components, such as uric acid.
Figure 2.
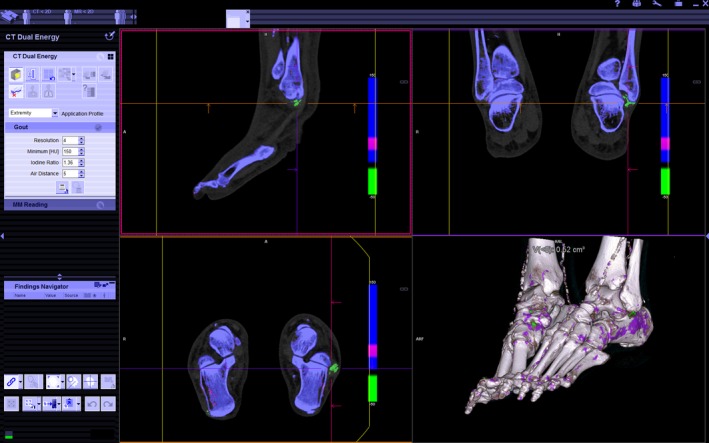
Colour‐coded, post‐processed images are depicted in three planes and three‐dimensional rendering. Monosodium urate (MSU) deposition is depicted in green, which is seen around the peroneal tendons of the right foot (cross‐hairs). Blue represents cortical bone and purple, trabecular bone. The guide lines in each pane can be panned and rotated to visualise the anatomy in any desired plane. Similarly, the three‐dimensional rendered image allows free‐form rotation to best demonstrate the MSU deposits. Image manipulation tools and dual‐energy parameter settings are found in the left ‐sided panel.
Gout Distribution
Understanding the common anatomical sites of MSU deposition is imperative for the proper assessment of post‐processed DECT images for gout. The first MTP joint is recognised as the most common site of involvement in many clinical and radiological studies.22, 23, 24, 25 (Fig. 3) The lower limb is more often affected compared to the upper limb. In one study, the lower extremity is exclusively involved in 72%, however, isolated involvement of the upper limb is uncommon, being seen in only 5% of patients.26 Less common sites of involvement described include the carpal and tarsal tunnel, anterior cruciate ligament, distal quadriceps, flexor and extensor tendons of the upper and lower limbs, the axial skeleton, total hip and knee replacements and intraosseous locations.25, 26, 27 Levin et al.28 examined pathologic changes in gout in a survey of eleven necropsied cases and found deposits within cartilage, articular surfaces, synovium, periosteum, sub‐chondral bone, ligaments, tendons, fascia, olecranon and pre‐patellar bursae. Mallinson et al.29 studied the distribution of gout in 148 dual‐energy CT cases and found a similar pattern of urate deposition. The first MTP joint was the most commonly affected followed by the Achilles tendon (Fig. 3). In the upper limbs the triceps tendon was found to be the most frequently affected site (Fig. 3). The most common sites of deposition around each anatomic region from this study are summarised in Table 1. In another study by Dalbeth et al.30 using DECT, the common sites were identified as the first MTP joint, Achilles tendon and peroneal tendons (Fig. 2).
Figure 3.
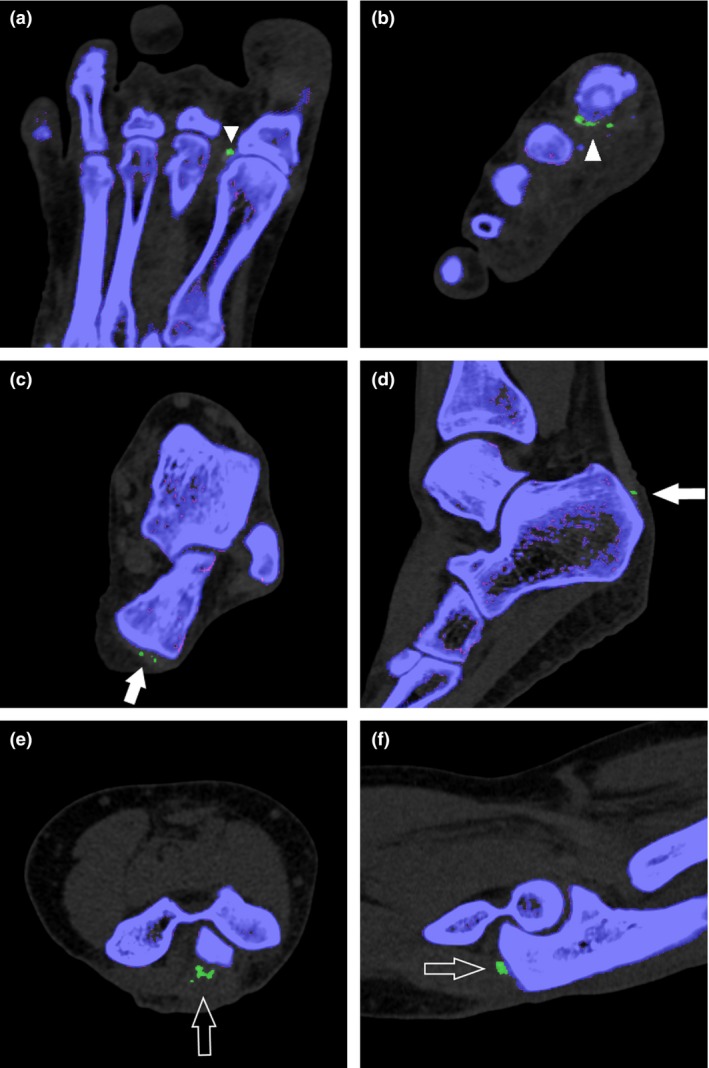
Post‐processed images in the axial (a) and coronal (b) planes demonstrate typical monosodium urate (MSU) deposits along the lateral aspect of the first metatarsophalangeal joint (arrowheads). Axial (c) and sagittal (d) images show MSU deposits along the distal end of the Achilles tendon (arrows). Axial (e) and sagittal (f) images depict MSU deposits along the distal triceps tendon (open arrows).
Table 1.
Common sites of monosodium urate deposition on dual‐energy computed tomography26
| Region | Patients affected (%) |
|---|---|
| Lower limb | |
| Foot | |
| 1st MTP joint | 57.4 |
| Other MTP joints | 23.0 |
| Tarsal joint | 18.9 |
| Ankle | |
| Achilles tendon | 35.8 |
| Joint | 25.7 |
| Peroneal tendon | 14.9 |
| Knee | |
| Popliteus tendon | 20.3 |
| Meniscii | 21.0 |
| Cruciate ligaments | 16.2 |
| Quadriceps tendon | 16.2 |
| Prepatellar bursa | 16.2 |
| Upper limb | |
| Hand | |
| Tendon | 15.6 |
| Wrist | |
| Carpus | 16.2 |
| Elbow | |
| Triceps | 23.0 |
MTP, metatarsophalangeal.
The large proximal joints (hips and shoulders) and axial skeleton has proved to be challenging to image due to presence of noise and artefacts from the 80 kVp dataset. There is currently no validated data in the literature for DECT imaging of gout in the shoulders, hip, spine and pelvis. A single case report has described the detection of proven gouty arthritis of the facet joints using DECT.31 Urate deposition has also been described in the intervertebral discs of gout patients and may be the cause of spinal pain. Carr et al.32 recently described MSU deposits in the intervertebral discs and costal cartilages of middle‐aged men on DECT scans of the abdomen. However, similar findings were seen in healthy age‐matched male control subjects. This led the authors to conclude that this was not a disease‐specific finding and that MSU deposition in the axial skeleton may be physiologic in middle‐aged men.
Accuracy of DECT in Gout
The diagnostic accuracy of DECT for the evaluation of gout has been reported in several studies. A meta‐analysis of 11 studies by Ogdie et al.33 showed a pooled sensitivity of 0.87 (95% CI 0.79–0.93) and specificity of 0.84 (95% CI 0.75–0.90) compared with the reference standard of crystal identification by means of polarised light microscopy. This was superior to the figures found for sonographic detection of tophi and the double contour sign. However, most of the studies have been in patients with long‐standing disease with mean disease duration of 7 years. In a more recent study of 40 patients with active gout and 41 individuals with other types of joint disease, the sensitivity and specificity of DECT for diagnosing gout was 0.90 (95% CI 0.76–0.97) and 0.83 (95% CI 0.68–0.93), respectively.34 This study would be more representative of patients in the early course of the disease, as presence of tophaceous gout was an exclusion criterion. The same study also found a high rate (20%) of false‐negatives among patients with a first flare of gout and symptom duration <6 weeks. It is postulated that DECT may not be of sufficient sensitivity to detect tiny deposits of MSU crystals in early gout. All false‐positive results from the control group occurred in patients with advanced osteoarthritis of the knee. In this group of patients, pixellations suggesting MSU deposition were identified in the articular cartilage without history of gout or presence of MSU crystals on joint aspiration. This may represent subclinical deposits of MSU in damaged cartilage. Aspiration‐proven calcium pyrophosphate crystal deposition (pseudogout), present in three of the patients from this study, did not show uric acid deposits. This correlates with previous experience with DECT for uric acid and calcium pyrophopsphate urinary calculi.35, 36 In a prospective study by Choi et al.37 of 40 crystal‐proven gout patients (17 tophaceous) and 40 controls with other arthritic conditions, the specificity and sensitivity of DECT for gout were 0.93 (95% CI 0.80–0.98) and 0.78 (95% CI 0.62–0.89), respectively, with near perfect inter‐ and intra‐observer correlation. In this study, five of the six false‐negative gout patients were on urate‐lowering therapy (Allopurinol), and had serum uric acid levels <6 mg/dL, likely accounting for the relatively low sensitivity documented. Another potential cause for a false‐negative result is the DECT ratio setting on the post‐processing software. This setting determines the slope of the line used to separate materials in the two‐material decomposition algorithm. McQueen et al.38 described discordant results when using settings of 1.28 (from previously published literature) and 1.55 (manufacturer default), compared to dual‐read MRI. Further study and standardisation of this parameter is necessary to ensure accurate interpretation of results.
Pitfalls and Artefacts
DECT scanning and post‐processing do produce artefacts which may result in false‐positive findings, if not recognised. The most commonly reported artefact by far, is the nail bed artefact (Fig. 4) which can be seen in 76% of imaged feet, or 88% of patients.39 This may be due to the overlap of dual‐energy CT values of MSU and the keratinous nail bed. Skin artefacts may also be present in callused or thickened skin of the feet such as the heel or toes, due to keratin content within these regions. These can be recognised by their superficial location on weight bearing or opposed skin surfaces. Scattered foci of sub‐millimetre urate‐like pixellations in a non‐anatomic distribution are typically regarded as image noise. However, these should be carefully examined in the appropriate plane to ensure that they do not represent anatomic distribution along a tendon which may represent true MSU deposition.39 (Fig. 5) Beam hardening from metal implants, dense cortical bone or metal objects such as rings worn on fingers, can cause artefacts, resulting in spurious pixellation mimicking urate deposits. Patient motion during the scan can also result in image distortion and artefacts.39, 40 Urate‐like pixellations in vascular calcification has been described in some reports,39 although it remains unclear if this is due to true MSU deposition or an artefact. Urate deposition has been implicated as a factor in endothelial dysfunction in patients with gout and cardiovascular disease,41 but this has so far not been corroborated in necropsied cases.28
Figure 4.
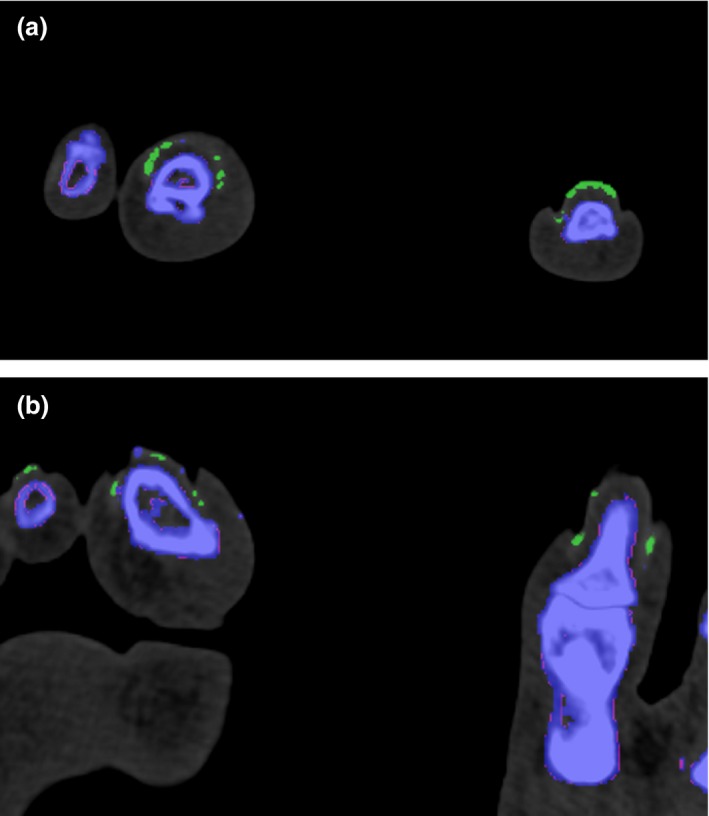
(a–b) Post‐processed multi‐planar images showing the typical appearance of nail bed artefacts in both feet, which are depicted in green. These should be recognised as artefacts from keratin content and not read as a positive finding for monosodium urate deposition.
Figure 5.

(a–c) Multiplanar post‐processed images illustrating the importance of careful examination of seemingly random urate‐like pixellation, which are shown to line up along the flexor tendons of the first to third toes when viewed in the appropriate plane (arrowheads).
Several methods have been suggested to reduce the presence of the artefacts described. The use of tape and blocks in the immobilisation of limbs, increasing gantry rotation speed, adjusting specific scan parameters can shorten the scan duration and reduce movement induced artefacts. Iterative reconstruction techniques can be utilised to reduce image noise, especially in patients with large body habitus. Worn metal objects should be removed where possible to avoid beam‐hardening artefacts.39, 40 The ability to recognise motion, noise and beam‐hardening artefacts, and the use of techniques to minimise them, are important to reduce false‐positive readings. Table 2 summarises the potential false‐positive and false‐negative findings in DECT for gout.
Table 2.
False‐positive and false‐negative findings in dual‐energy computed tomography for gout
| False‐positive | False‐negative |
|---|---|
| Advanced osteoarthritis in the knee | First flare or symptom duration <6 weeks |
| Artefacts | Urate‐lowering therapy |
| Nail bed and skin | Parameter ratio setting – too low |
| Beam hardening | |
| Image noise | |
| Vascular calcifications |
Clinical Applications
With its high sensitivity and specificity, DECT has shown to be a valuable problem‐solving tool in the non‐invasive diagnosis of gout with many potential clinical applications. Nicolaou et al.42 described five patients presenting to the emergency department where the diagnosis of gout was made or excluded on the basis of DECT, thereby impacting subsequent management. One of the examples illustrated the differentiation of gout from suspected septic arthritis or chloroma, in a patient with known leukaemia presenting with pain and swelling of the 2nd toe. The diagnosis of acute gout was made by DECT and confirmed on subsequent joint aspiration. Conversely, a negative finding can also have important clinical implications by excluding the diagnosis of gout in a symptomatic joint (Fig. 6). DECT has a clinical role in the evaluation of suspected gout in instances where the affected joint is inaccessible for joint aspiration or where there is insufficient joint fluid. It is also useful in cases of extra‐articular gout, where MSU deposits in the extra‐articular tissues, such as tendons and bursae, may result in false negative results on joint aspiration.43 Subclinical MSU deposits can also be detected in asymptomatic patients with hyperuricaemia, although found is smaller volumes compared to symptomatic patients. This suggests that other factors, such as duration of exposure to high serum uric acid levels, may have a role to play in the deposition of MSU and the subsequent inflammatory response responsible for the symptoms of gout.44 This may allow for the earlier detection and treatment of patients with hyperuricaemia and avoidance of complications of the disease. Further research would be required to establish the full clinical significance of this finding.
Figure 6.
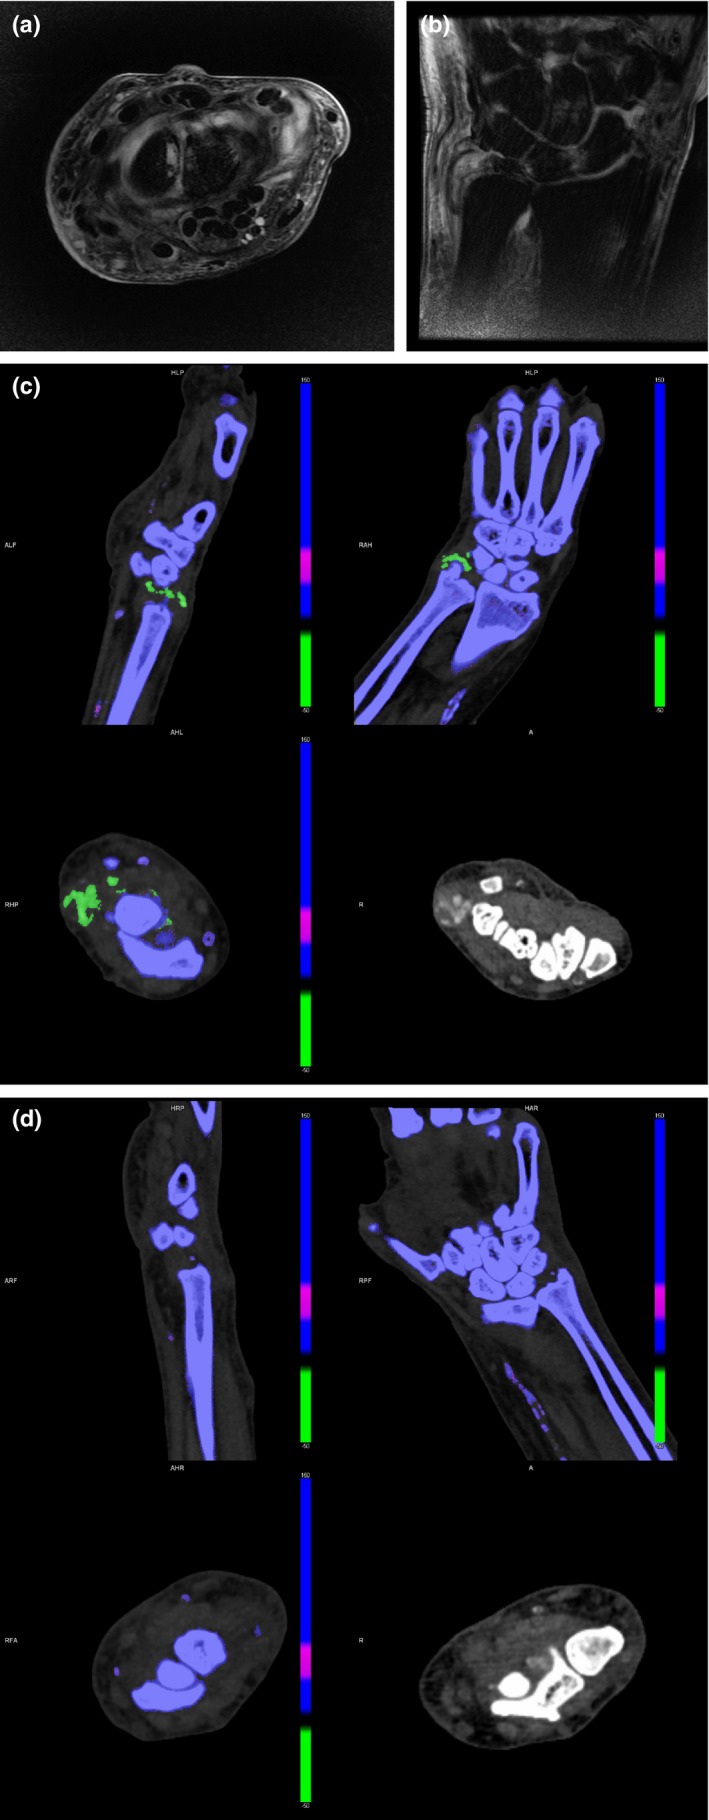
69‐year‐old man with known history of hyperuricaemic gout presents with acute pain and swelling in the left wrist. Magnetic resonance imaging examination was limited by pain, but was sufficient to detect a joint effusion with non‐specific surrounding soft tissue oedema on axial (a) and coronal (b) T2‐weighted, fat‐suppressed images. Dual‐energy computed tomography performed detected hyperdense soft tissue in the right wrist (c) with corresponding monosodium urate deposits (arrowheads). (d) However, no deposits were identified in the symptomatic left wrist. This result skewed the diagnosis away from gout as a cause of symptoms and suggested septic arthritis as a more likely diagnosis. Subsequent joint aspiration revealed pus with abundance of white blood cells (4+) and no crystals on fluid analysis. Pseudomonas Aeruginosa was cultured as the causative organism and the patient was treated with a joint wash‐out.
DECT also allows for the accurate and reproducible quantification of MSU deposits using automated software techniques, (Fig. 7) which calculates the volume of MSU deposits independent of the volume of hyperdense or calcified soft tissue.37, 45, 46 This is helpful for follow‐up imaging for assessing the reduction in volume of MSU deposits as a marker of treatment response in serial DECT scans without dependence on operator‐defined margins of perceived tophi used in other methods of assessment.47
Figure 7.
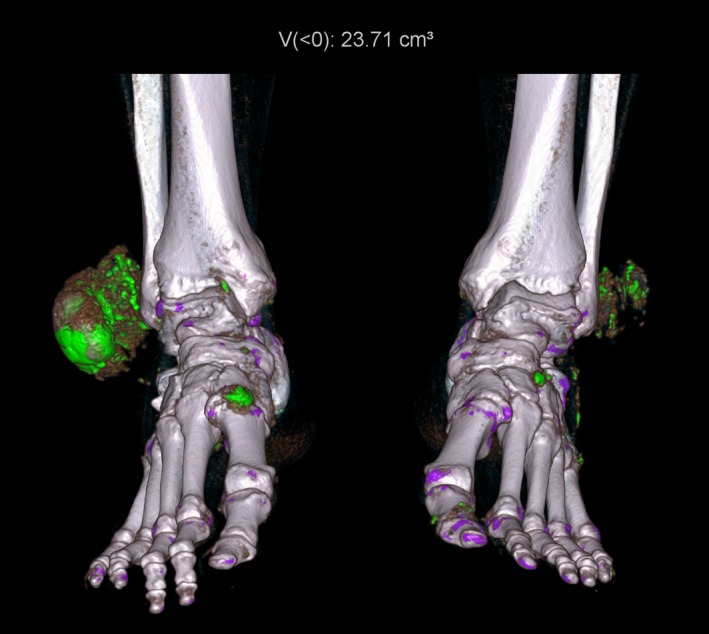
Three‐dimensional rendered image depicting large tophi over the lateral malleoli of both ankles as well as smaller deposits scattered around both ankles and feet. Automated quantification of urate volume is displayed at the top of the image.
Conclusion
DECT has established itself as an accurate method for detection of MSU deposits and in the diagnosis of gout in a variety of clinical scenarios. It is a powerful tool that can aid in problem solving of complex and atypical presentations of gout. It is also useful as a means of disease quantification in the follow‐up of patients with gout. As its utilisation becomes increasingly widespread and available, operators should be familiar with the science behind DECT and the techniques of image acquisition and post‐processing. It is important for both the radiologist and radiographer to identify clinical scenarios for its use, have knowledge of the common sites of MSU deposition, as well as to be able to recognise artefacts and the methods available to reduce them where possible.
Conflict of interest
The authors have no conflict of interest to declare.
J Med Radiat Sci 64 (2017) 41–51
References
- 1. Schwartz SA. Gout – disease of distinction. Explore (NY) 2006; 2: 515–9. [DOI] [PubMed] [Google Scholar]
- 2. Zhu Y, Pandya BJ, Choi HK. Prevalence of gout and hyperuricemia in the US general population: The National Health and Nutrition Examination Survey 2007–2008. Arthritis Rheum 2011; 63: 3136–41. [DOI] [PubMed] [Google Scholar]
- 3. Lawrence RC, Felson DT, Helmick CG, et al. Estimates of the prevalence of arthritis and other rheumatic conditions in the United States. Part II. Arthritis Rheum 2008; 58: 26–35. [DOI] [PMC free article] [PubMed] [Google Scholar]
- 4. Choi HK, Ford ES, Li C, Curhan G. Prevalence of the metabolic syndrome in patients with gout: The Third National Health and Nutrition Examination Survey. Arthritis Rheum 2007; 57: 109–15. [DOI] [PubMed] [Google Scholar]
- 5. Choi HK, Curhan G. Independent impact of gout on mortality and risk for coronary heart disease. Circulation 2007; 116: 894–900. [DOI] [PubMed] [Google Scholar]
- 6. Choi HK, De Vera MA, Krishnan E. Gout and the risk of type 2 diabetes among men with a high cardiovascular risk profile. Rheumatology (Oxford) 2008; 47: 1567–70. [DOI] [PubMed] [Google Scholar]
- 7. Ning TC, Robert TK. Unusual clinical presentations of gout. Curr Opin Rheumatol 2010; 22: 181–7. [DOI] [PubMed] [Google Scholar]
- 8. Sack K. Monarthritis: Differential diagnosis. Am J Med 1997; 102(1A): 30S–4S. [DOI] [PubMed] [Google Scholar]
- 9. Schlesinger N, Baker DG, Schumacher HR Jr. Serum urate during bouts of acute gouty arthritis. J Rheumatol 1997; 24: 2265–6. [PubMed] [Google Scholar]
- 10. Roddy E, Doherty M. Epidemiology of gout. Arthritis Res Ther 2010; 12: 223–34. [DOI] [PMC free article] [PubMed] [Google Scholar]
- 11. Swan A, Amer H, Dieppe P. The value of synovial fluid assays in the diagnosis of joint disease: A literature survey. Ann Rheum Dis 2002; 61: 493–8. [DOI] [PMC free article] [PubMed] [Google Scholar]
- 12. Girish G, Glazebrook KN, Jacobson JA. Advanced imaging in gout. Am J Roentgenol 2013; 201: 515–25. [DOI] [PubMed] [Google Scholar]
- 13. Thiele RG, Schlesinger N. Diagnosis of gout by ultrasound. Rheumatology (Oxford) 2007; 46: 1116–21. [DOI] [PubMed] [Google Scholar]
- 14. Johnson TR, Krauss B, Sedlmair M, et al. Material differentiation by dual energy CT: Initial experience. Eur Radiol 2007; 17: 1510–7. [DOI] [PubMed] [Google Scholar]
- 15. Kelcz F, Joseph PM, Hilal SK. Noise considerations in dual energy CT scanning. Med Phys 1979; 6: 418–25. [DOI] [PubMed] [Google Scholar]
- 16. Johnson TR. Dual‐energy CT: General principles. Am J Roentgenol 2012; 199(5_supplement): S3–8. [DOI] [PubMed] [Google Scholar]
- 17. Flohr TG, McCollough CH, Bruder H, et al. First performance evaluation of a dual‐source CT (DSCT) system. Eur Radiol 2006; 16: 256–68 [Published correction appears in Eur Radiol 2006; 16: 1405.]. [DOI] [PubMed] [Google Scholar]
- 18. Henzler T, Fink C, Schoenberg SO, Schoepf UJ. Dual‐energy CT: Radiation dose aspects. Am J Roentgenol 2012; 199(5_supplement): S16–25. [DOI] [PubMed] [Google Scholar]
- 19. Qu M, Giraldo JC, Leng S, et al. Dual‐energy dual‐source CT with additional spectral filtration can improve the differentiation of non‐uric acid renal stones: An ex vivo phantom study. Am J Roentgenol 2011; 196: 1279–87. [DOI] [PMC free article] [PubMed] [Google Scholar]
- 20. Kang MJ, Park CM, Lee CH, Goo JM, Lee HJ. Dual‐energy CT: Clinical applications in various pulmonary diseases 1. Radiographics 2010; 30: 685–98. [DOI] [PubMed] [Google Scholar]
- 21. Kaza RK, Platt JF, Cohan RH, Caoili EM, Al‐Hawary MM, Wasnik A. Dual‐energy CT with single‐and dual‐source scanners: Current applications in evaluating the genitourinary tract. Radiographics 2012; 32: 353–69. [DOI] [PubMed] [Google Scholar]
- 22. Monu JU, Pope TL Jr. Gout: A clinical and radiologic review. Radiol Clin North Am 2004; 42: 169–84. [DOI] [PubMed] [Google Scholar]
- 23. Harris MD, Siegel LB, Alloway JA. Gout and hyperuricemia. Am Fam Physician 1999; 59: 925–34. [PubMed] [Google Scholar]
- 24. Dhanda S, Jagmohan P, Quek ST. A re‐look at an old disease: A multimodality review on gout. Clin Radiol 2011; 66: 984–92. [DOI] [PubMed] [Google Scholar]
- 25. Grahame R, Scott JT. Clinical survey of 354 patients with gout. Ann Rheum Dis 1970; 29: 461–8. [DOI] [PMC free article] [PubMed] [Google Scholar]
- 26. Forbess LJ, Fields TR. The broad spectrum of urate crystal deposition: Unusual presentations of gouty tophi. Semin Arthritis Rheum 2012; 42: 146–54. [DOI] [PubMed] [Google Scholar]
- 27. Surprenant MS, Levy AI, Hanft JR. Intraosseous gout of the foot: An unusual case report. J Foot Ankle Surg 1996; 35: 237–43. [DOI] [PubMed] [Google Scholar]
- 28. Levin MH, Lichtenstein L, Scott HW. Pathologic changes in gout; survey of eleven necropsied cases. Am J Pathol 1956; 32: 871–95. [PMC free article] [PubMed] [Google Scholar]
- 29. Mallinson PI, Reagan AC, Coupal T, Munk PL, Ouellette H, Nicolaou S. The distribution of urate deposition within the extremities in gout: A review of 148 dual‐energy CT cases. Skeletal Radiol 2014; 43: 277–81. [DOI] [PubMed] [Google Scholar]
- 30. Dalbeth N, Kalluru R, Aati O, Horne A, Doyle AJ, McQueen FM. Tendon involvement in the feet of patients with gout: A dual‐energy CT study. Ann Rheum Dis 2013; 72: 1545–8. [DOI] [PubMed] [Google Scholar]
- 31. Parikh P, Butendieck R, Kransdorf M, Calamia K. Detection of lumbar facet joint gouty arthritis using dual‐energy computed tomography. J Rheumatol 2010; 37: 2190–1. [DOI] [PubMed] [Google Scholar]
- 32. Carr A, Doyle AJ, Dalbeth N, Aati O, McQueen FM. Dual‐energy CT of urate deposits in costal cartilage and intervertebral disks of patients with tophaceous gout and age‐matched controls. Am J Roentgenol 2016; 206: 1063–7. [DOI] [PubMed] [Google Scholar]
- 33. Ogdie A, Taylor WJ, Weatherall M, et al. Imaging modalities for the classification of gout: Systematic literature review and meta‐analysis. Ann Rheum Dis 2015; 74: 1868–74. [DOI] [PMC free article] [PubMed] [Google Scholar]
- 34. Bongartz T, Glazebrook KN, Kavros SJ, et al. Dual‐energy CT for the diagnosis of gout: An accuracy and diagnostic yield study. Ann Rheum Dis 2015; 74: 1072–7. [DOI] [PMC free article] [PubMed] [Google Scholar]
- 35. Primak AN, Fletcher JG, Vrtiska TJ, et al. Noninvasive differentiation of uric acid versus non–uric acid kidney stones using dual‐energy CT. Acad Radiol 2007; 14: 1441–7. [DOI] [PMC free article] [PubMed] [Google Scholar]
- 36. Graser A, Johnson TR, Bader M, et al. Dual energy CT characterization of urinary calculi: Initial in vitro and clinical experience. Invest Radiol 2008; 43: 112–9. [DOI] [PubMed] [Google Scholar]
- 37. Choi HK, Burns LC, Shojania K, et al. Dual energy CT in gout: A prospective validation study. Ann Rheum Dis 2012; 71: 1466–71. [DOI] [PubMed] [Google Scholar]
- 38. McQueen FMF, Doyle AJ, Reeves Q, Gamble GD, Dalbeth N. DECT urate deposits: Now you see them, now you don't. Ann Rheum Dis 2013; 72: 458–9. [DOI] [PubMed] [Google Scholar]
- 39. Mallinson PI, Coupal T, Reisinger C, et al. Artifacts in dual‐energy CT gout protocol: A review of 50 suspected cases with an artifact identification guide. Am J Roentgenol 2014; 203: W103–9. [DOI] [PubMed] [Google Scholar]
- 40. Coupal TM, Mallinson PI, Gershony SL, et al. Getting the most from your dual‐energy scanner: Recognizing, reducing, and eliminating artifacts. Am J Roentgenol 2016; 206: 119–28. [DOI] [PubMed] [Google Scholar]
- 41. Edwards NL. The role of hyperuricemia and gout in kidney and cardiovascular disease. Cleve Clin J Med 2008; 75(suppl 5): S13–6. [DOI] [PubMed] [Google Scholar]
- 42. Nicolaou S, Yong‐Hing CJ, Galea‐Soler S, Hou DJ, Louis L, Munk P. Dual‐energy CT as a potential new diagnostic tool in the management of gout in the acute setting. Am J Roentgenol 2010; 194: 1072–8. [DOI] [PubMed] [Google Scholar]
- 43. Glazebrook KN, Guimarães LS, Murthy NS, et al. Identification of intraarticular and periarticular uric acid crystals with dual‐energy CT: Initial evaluation. Radiology 2011; 261: 516–24. [DOI] [PubMed] [Google Scholar]
- 44. Dalbeth N, House ME, Aati O, et al. Urate crystal deposition in asymptomatic hyperuricaemia and symptomatic gout: a dual energy CT study. Ann Rheum Dis 2015; 74: 908–11. [DOI] [PubMed] [Google Scholar]
- 45. Dalbeth N, Aati O, Gao A, et al. Assessment of tophus size: A comparison between physical measurement methods and dual‐energy computed tomography scanning. J Clin Rheumatol 2012; 18: 23–7. [DOI] [PubMed] [Google Scholar]
- 46. Shi D, Xu JX, Wu HX, Wang Y, Zhou QJ, Yu RS. Methods of assessment of tophus and bone erosions in gout using dual‐energy CT: Reproducibility analysis. Clin Rheumatol 2015; 34: 755–65. [DOI] [PubMed] [Google Scholar]
- 47. Desai MA, Peterson JJ, Garner HW, Kransdorf MJ. Clinical utility of dual‐energy CT for evaluation of tophaceous gout. Radiographics 2011; 31: 1365–75. [DOI] [PubMed] [Google Scholar]


