

Abstract

Genetically encoded calcium indicators (GECIs) produce unprecedentedly large signals that have enabled routine optical recording of single neuron activity in vivo in rodent brain. Genetically encoded voltage indicators (GEVIs) offer a more direct measure of neuronal electrical status, however the signal-to-noise characteristics and signal polarity of the probes developed to date have precluded routine use in vivo. We applied directed evolution to target modulable areas of the fluorescent protein in GEVI ArcLight to create the first GFP-based GEVI (Marina) that exhibits a ΔF/ΔV with a positive slope relationship. We found that only three rounds of site-directed mutagenesis produced a family of “brightening” GEVIs with voltage sensitivities comparable to that seen in the parent probe ArcLight. This shift in signal polarity is an essential first step to producing voltage indicators with signal-to-noise characteristics comparable to GECIs to support widespread use in vivo.
Keywords: Genetically encoded voltage indicators, ArcLight, green fluorescent protein, biosensors, directed evolution, mutagenesis
Introduction
High sensitivity of genetically encoded calcium indicators (e.g., GCaMPs) combined with high resolution two-photon microscopy have provided unprecedented views of neuronal activity in vivo.1 This methodology enables monitoring of the activity of a large number of genetically defined neurons in the cortex of awake rodents. However, intracellular calcium levels are a surrogate indicator of the more relevant physiological measure, membrane potential. An alternative to calcium indicators for directly reporting neuronal activity are genetically encoded indicators of membrane potential. However, while the first fluorescent-protein voltage indicator was reported nearly two decades ago,2 and many additional constructs have been reported,3−16 mainly due to low voltage sensitivity none have seen general adoption for use in physiological studies.
We developed ArcLight,10 a genetically encoded fluorescent voltage indicator based on fusion of the voltage sensing domain (VSD) of the Ciona intestinalis voltage sensitive phosphatase17 and a mutated version of the pHluorin fluorescent protein.18 Due to its relatively high sensitivity, ArcLight has been used to study the electrical activity of Drosophila neurons19−22 in situ, Caenorhabditis elegans neurons in situ,23 human cardiomyocytes,24,25 and mammalian neurons in culture10,16,26 and in vivo.27 The successful use of ArcLight in various organisms is mainly due to its brightness and good membrane localization. Unlike opsin-derived indicators,9,13,14 ArcLight is based on the Aequorea victoria green fluorescent protein (GFP) which has brightness that is orders of magnitude greater than opsins.28 And while there are a number of GEVIs published based on the fusion of a voltage sensing domain with GFP-like fluorescent proteins2−8,11,12,16,29−31 selective mutations in the ArcLight fluorescent protein have produced a construct with unparalleled changes in absolute fluorescence output with voltage. Nonetheless, relatively slow kinetics (activation time τ > 9 ms) of the voltage-dependent fluorescence change in ArcLight significantly diminishes its performance in detecting action potentials in neuronal cells and has negatively impacted its broader use in physiological experiments.16,32
The current multiphoton methods of recording neuronal activity in the mammalian cortex cannot follow the response kinetics of faster indicators when recording the concurrent dynamics of large populations of individual neurons in awake animals.33,34 Modeling studies clearly indicate that temporally exaggerated fluorescence responses to action potentials will improve detection.34,35 In the light of this, the most important limitations of ArcLight and other voltage probes compared to GFP-based calcium indicators (i.e., GCaMP6) are not response speeds but rather: (i) the absolute (and relative) changes in their fluorescence output are far lower than the state-of-the-art calcium indicators and (ii) the voltage indicators with the largest signals combined with optimal brightness (i.e., ArcLight, ASAP2f, and AceNeon) have a negative slope relationship between voltage and fluorescence, unlike calcium indicators that have positive slope relationships between calcium levels and fluorescence.10,32,36
To improve the utility of the GEVI ArcLight for in vivo recordings of neuronal electrical activity, we sought to reverse the polarity of the signal from a decrease in fluorescence intensity with depolarization, to an increase. However, numerous studies on ArcLight failed to reveal a clear mechanistic hypothesis for its robust voltage sensitivity.37−39 The majority of ArcLight modifications targeting the voltage sensitive domain resulted in several probes with improved kinetics but reduced amplitude of the voltage-dependent response.26,38,39 In addition, the vast majority of single (non FRET) GFP-based voltage indicators, both published (FlaSh, VSFP3, SPARC, Zahra1 and 2, ElectricPK, ArcLight, other species ArcLights, Bongwoori, ASAP1, ASAP2f, ArcLightning, etc.) and unpublished (>500, Platisa and Pieribone), produce fluorescence decreases in response to depolarizations. To our knowledge, there is only one GFP-like voltage indicator (FlicR1) that exhibits a depolarization-dependent increase in fluorescence intensity substantial enough to be considered for practical use.40 Herein, to produce such a probe, we undertook a directed evolutionary mutagenic strategy targeting the fluorescent protein in ArcLight combined with automated screening. We show that changes to only three residues in the fluorescent protein (FP) of ArcLight resulted in a family of “brightening” GEVIs, that exhibit comparable voltage sensitivity to ArcLight. The most sensitive variant of these novel probes, the GEVI Marina is capable of reporting action potentials and subthreshold events in spontaneously active mammalian neurons in vitro.
Results and Discussion
The most advanced FP-based genetically encoded voltage indicators (i.e., ArcLight, ASAP2f, Ace-mNeon) reduce their fluorescence intensity with activation (i.e., depolarization).10,32,36 As such, during in vivo recording, this bright resting state fluorescence (F0) introduces a large noise signal from surrounding cells that reduces the overall signal-to-noise ratio (SNR) of the response compared to probes that exhibit low fluorescence in the resting state. As neurons exist in a depolarized state far more infrequently than in a resting (hyperpolarized) state, an indicator that exhibits low resting-state fluorescence would yield improved SNR. A key improvement of the later versions of GCaMPs (>GCaMP3) is their low fluorescence in neurons at rest. Action potentials cause an influx of calcium and thereby a dramatic increase in the fluorescence output of GCaMP6. The high ΔF/ΔV sensitivity of ArcLight is conferred by the presence of specific residues in the fluorescent protein. We reasoned that modifications to the fluorescent protein might result in a change in polarity of the voltage-dependent signal.
For the development of a GEVI with a positive slope relationship between membrane potential and fluorescence, we decided to use the brighter version of ArcLight, super ecliptic ArcLight as a starting point. We previously found that eGFP could replace the ArcLight fluorescent protein (super ecliptic pHluorin) if four crucial mutations were made (S389D, S444F, Q446T, and A469D).37 Notably, all of these residues populate the same surface of the β barrel (beta sheets 7, 10 and 11) and have outward orientations. We began by making saturated mutagenesis libraries of three of these crucial residues (D389, F444 and T446) in the FP domain of ArcLight (Figures 1, S1, and 2). In addition, we made mutagenic libraries of six other residues (R338, H390, Y442, T445, S447, and E464; Figures 2 and S1), which are proximal to either the chromophore, or residues that we found to be essential in producing the ArcLight effect.
Figure 1.

Crucial residues within the ArcLight fluorescent protein (super ecliptic pHluorin) determine the polarity and size of the voltage-dependent fluorescence response in genetically encoded voltage indicators. Two different view angles of the 3D structure of eGFP (PDB identifier 1EMA) illustrating the position of residues within super ecliptic pHluorin of ArcLight that confer the inverted polarity and high sensitivity of the voltage indicator Marina: D389A (blue), H390A (magenta) and Y442V (yellow). The crucial residues for voltage sensitivity of ArcLight are D389 (blue), F444 (orange), T446 (light blue), and D469 (green).37
Figure 2.

Directed evolution of GEVI ArcLight produces an indicator with reversed voltage-dependent response. Left side panels (A, C, and E): for each of the saturated mutagenesis libraries, 96 colonies were selected and tested for expression and voltage sensitivity. Screening of each library was preformed two to four times on a custom-made, semiautomated screening platform which allows for simultaneous field stimulation and optical imaging in the 96-well dish format. We used either an electrically active HEK293 cells or mouse cortical neurons transiently expressing various mutants. Each dot on the graph represents the highest value of depolarization-dependent fluorescence change detected in each well. Right side-panels (B, D, and F): detailed study of voltage sensitivity of selected indicators using combination of whole-cell patch-clamp recordings and optical imaging in nonelectrically active HEK293 cells. Excitation light intensity measured at the sample plane was 18 mW/mm2. For each construct three to six cells were tested. Data are plotted as mean ± SEM. (A) First round of site-directed mutagenesis on residues proximal to the chromophore (R338, H390, Y442, T445, S447, and E464) or residues which we found to be essential for ArcLight voltage sensitivity (D389, F444, and T446). F444X and T446X libraries were tested in neurons, all other libraries were tested in spiking HEK293 cells. Some of the constructs carrying mutations on residue D389 produce probes that respond to membrane depolarization with modest increase in fluorescence intensity. (B) Detailed study confirms an inverted signal polarity of several D389 mutants compared to the parent ArcLight. The highest positive depolarization-dependent signal was detected in an ArcLight D389A mutant. (C) Second round of site-directed mutagenesis on residues R338, H390, T445, S447, and E464 using ArcLight D389A as a template identified several H390 mutants with increased voltage sensitivity compared to parent indicator. (D) Voltage clamp recordings identified mutant ArcLight A389 H390A as a high responder. (E) Additional mutagenic library at residue Y442 of ArcLight A389 H390A produces variants with further improved voltage sensitivity. (F) Voltage clamp analysis confirms significant improvement in voltage sensitivity in two of Y442 mutants, Y442L and Y442V. ArcLight A389 A390 Y442V was named Marina.
Ninety six (96) Escherichia coli colonies from each site directed mutagenesis library were selected, and cDNA from each colony was purified. Each of the 96 clones was tested by screening two to four times in either primary neuronal cell cultures or in spontaneously spiking HEK cell line41 using a custom-made automated screening platform (Vasan, Platisa, and Pieribone, personal communication). Mutations to residues R338, H390, Y442, F444, T445, T446, S447, and E464 produced signal sizes that were either unchanged or smaller than those found in the wildtype ArcLight (Figure 2A). However, mutations to D389 caused either significantly reduced negative-going fluorescence changes or in some cases, increase in fluorescence intensity (up to 7%ΔF/F using our standard stimulation protocol; see Methods) with depolarizations in membrane voltage. We sequenced all 96 D389 mutants and selected constructs that represented all 19 different novel amino acids. Each mutant was then tested via whole cell patch clamp electrophysiology combined with microfluorimetry in nonelectrically active HEK293 cells. The results of these screens can be seen in Figure 2B. The mutant D389A produced the largest increase in fluorescence intensity upon membrane depolarizations (+7.1 ± 0.5%ΔF/F for +100 mV depolarization from a holding potential of −70 mV in expressing HEK293 cells). The D389W and D389C substitutions also produced positive, albeit smaller, responses to depolarizations (Figure 2B). While the D389A mutation in ArcLight reversed the sign of the fluorescence response to depolarization from negative to positive, the absolute change in fluorescence as well as the ΔF/F was relatively small.
In an effort to increase voltage sensitivity, we next performed saturation mutagenesis of the same residues as described above (R338, H390, Y442, T445, S447, and E464) but using ArcLight A389 as a template. Again, mutations of R338, T445, and E464 all produced constructs with positive going signals but these were largely similar or smaller in magnitude than ArcLight A389 (Figure 2C and D). However, constructs with mutations at H390 and S447 produced signals with significantly larger response magnitudes than ArcLight A389. We tested each of the 19 amino acid substitutions at H390 using whole cell patch clamp electrophysiology and found that mutants carrying either alanine or cysteine at residue H390 produced response magnitudes that were 2.5 and 2 times larger than ArcLight A389, respectively (17.8 ± 1.2%ΔF/F and 13.9 ± 1.2%ΔF/F for a + 100 mV depolarization tested in HEK293 cells). The mutant ArcLight A389 A390 showed biexponential kinetics with time constants of ∼3.6 ms and ∼30 ms for activation (fast component accounting for 38% of response), and ∼12 ms and ∼47 ms for inactivation (fast component accounting for 68% of response) (Figure S2). Our attempt to increase voltage sensitivity of the ArcLight W389 mutant by making changes at position 390 failed to produce improved voltage sensitive variants. We did not study this mutant further.
The following round of site-directed mutations was performed on residue Y442 in ArcLight A389 A390 (Figure 2E) and resulted in several variants (Y442 L, V, A, M and C) that had increased depolarization dependent changes in fluorescence intensity (Figure 2F). The two most promising constructs containing leucine or valine at position 442. These mutants exhibited an ∼1.6 fold increase in signal magnitude compared to the parent ArcLight A389 A390 (31.1 ± 4.2%ΔF/F and 29.2 ± 2.0%ΔF/F for a +100 mV depolarization in HEK293 cells, respectively). The ArcLight A389 A390 V442 mutant (named Marina) has single exponential kinetics of activation with a time constant of 29.2 ± 2.0 ms and biexponential kinetics of deactivation with time constants 15.6 ± 1.5 ms for the fast component and 59.4 ± 5.8 ms for the slow component (fast component accounting for 61% of response; Figure S2).
The detected reversal in polarity of the voltage-dependent response of ArcLight seems to be dependent on the presence of amino acids with hydrophobic (alanine, tryptophan, cysteine, and methionine) side chains at position 389. The hydrophobic side chains of alanine and tryptophan produced the largest effects. Hydrophilic side chains (i.e., aspartic acid, glutamic acid, lysine, and arginine) at this position do not produce probes with a positive slope relationship to voltage. Replacement of polar tyrosine (Y) on another outward oriented residue 442 within ArcLight FP with a range of hydrophobic amino acids (leucine, isoleucine, valine, alanine, and methionine) resulted in variants with increased voltage sensitivity. Again, introduction of hydrophilic residues (aspartic acid or glutamic acid, data not shown) to this position diminished voltage sensitivity.
Position 442 appears to be more promiscuous to residue size since multiple amino acids (valine, leucine, and isoleucine) produced probes with similar voltage sensitivities. We also demonstrated that an equally significant improvement in voltage sensitivity (more than double) of the GEVI Marina was achieved through the replacement of the hydrophilic histidine (H) on position 390 with hydrophobic residues, either alanine (A) or cysteine (C). The introduction of other larger hydrophobic residues at position 390 caused smaller increases in voltage sensitivity. Replacement of H390 with other polar, hydrophilic groups caused not only decreases in signal magnitude, but some substitutions (arginine and asparagine) produced a reversal of the probe response polarity. Our results suggest that both the size and charge of the side chain of residue 390 play a significant role in voltage sensitivity. An increase in surface hydrophobicity of the FP supports the hypothesis that the voltage sensitivity of single FP GEVIs might depend on interactions between the FP surface and the plasma membrane.29,37 The effects of changing residue 390 on voltage sensitivity are not surprising given the large body of evidence describing different ways in which H390 (H148 in avGFP) affects the fluorescent properties of GFP, including altering proton transfer, and protein conformation and flexibility.42−46
Comparisons of the V/F curves of the novel GEVI variants (Figures 3A, B and S3) showed that all three mutations (D389A, H390A, and Y442V) introduced into the parent GEVI ArcLight contributed to the increased sensitivity of the probe to depolarizing events, while all three probes exhibited nearly identical lack of sensitivity to hyperpolarizing events. Spontaneously spiking HEK293 cells showed decreases in baseline fluorescence for the GEVI Marina (180 ± 5 AU, n = 3045 cells) compared to the parent ArcLight (266 ± 5 AU, n = 8987 cells). Mutational changes in Marina seem to lower the photobleaching constants of the indicator compared to the parent probe ArcLight measured in HEK293 cells (Figure 3C). Photobleaching curves for both probes were fitted to single exponential curves resulting in time constants of 206.3 ± 20.8 s for Marina and 132.3 ± 4.8 s for ArcLight.
Figure 3.

Characterization of novel GEVI Marina. In experiments shown in A and B, HEK293 cells transiently expressing various GEVIs were simultaneously electrically recorded using whole-cell patch clamp (300 ms 100 mV depolarizing steps from −70 mV holding potential) and imaged with a high-speed (1000 Hz) CCD camera. In all experiments, excitation light intensity measured at the sample plane was 18 mW/mm2. (A) Depolarization changes in membrane potential cause a decrease in fluorescence intensity in ArcLight (in blue) and an increase in fluorescence intensity in ArcLight D389A (light green), ArcLight A389 H390A (green) and ArcLight A389 A390 Y442V-Marina (dark green). All traces are single trials and were subtracted with a double exponential fit for bleach correction. See also Figures S2 and S3 for unsubtracted traces. (B) V–F curve for all the indicators shown in A (4–5 cells recorded for each indicator). For all cells, voltage steps of −50 to +100 mV were applied in increments of 10 mV from a resting potential of −70 mV. Data are plotted as mean ± SEM. (C) GEVI Marina exhibits lower rate of photobleaching compared to the parent probe ArcLight. Electrically active HEK293 cells transiently expressing GEVIs ArcLight (blue), ArcLight A389 A390 (light green) and ArcLight A389 A390 V442 (dark green) were exposed to 60 cycles of intermittent laser excitation (duty cycle of 5 s on/55 s off) resulting in 300 s total laser excitation illumination (18 mW/mm2). (AU = arbitrary units.)
To examine the potential to reveal electrical events in neuronal cells, GEVI Marina was transiently expressed in mouse primary neuronal culture in vitro. Representative mouse cortical neurons in vitro transiently expressing GEVI Marina are shown in Figure 4. Simultaneous optical and electrical recordings revealed that voltage sensitivity of Marina allows for detection of membrane transients (single action potentials and subthreshold events) from neuronal cell bodies and processes (Figure 4). Spontaneous action potentials in Marina expressing neurons could be reliably seen optically (Figure 5; 1.4 ± 0.1%ΔF/F for action potentials of 37.4 ± 3.7 mV; average of 35 APs in 5 different cells) with a signal-to-noise ratio (SNR) of 4.5 ± 0.2. Under identical experimental conditions, the parent probe ArcLight resolves action potentials with an average fluorescence change of 2.6 ± 0.7%ΔF/F for action potentials of 48.9 ± 8 mV; average of 21 APs in 3 different cells) with a signal-to-noise ratio (SNR) of 8.8 ± 1.5.
Figure 4.

Spontaneous electrical activity in cultured mammalian neurons detected with GEVI Marina. (Top) GEVI Marina exhibiting membrane localization in transiently expressing mouse cortical neurons in vitro. Image is a Z-stack of nine 2 μm thick sections taken with a two-photon microscope equipped with 20× objective. Bar scale: 20 μm. (Bottom) Sample traces of single trial recordings of spontaneous action potential bursts from three locations of the neuron shown. Fluorescence recordings at 125 Hz (colored): % ΔF/F from the area of interest in the same color on the left; soma electrode voltage recording (white). All optical traces have double exponential subtraction to correct for FP bleach. An 80 × 80 image (right) of a neuron with the regions of interest averaged to produce the traces shown. Excitation light intensity on the sample plane was 18 mW/mm2.
Figure 5.
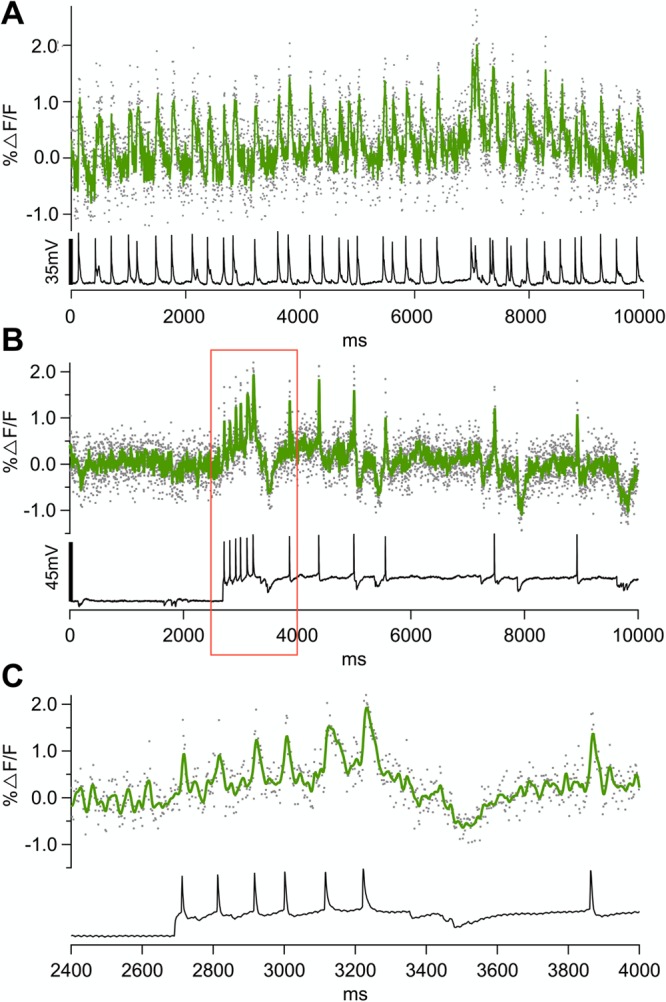
Simultaneous electrical and optical recordings of spontaneous action potential activity from cortical neuronal cells in vitro expressing GEVI Marina. (A and B) Single-trial fluorescence traces of activity in neuronal cell bodies of two different cells. (C) Magnification of trace marked in (B) with red borderline. Optical trace in green, and electrical in black. Excitation light intensity on the sample plane was 18 mW/mm2. All fluorescence traces were recorded at 500 Hz using high speed CCD camera. All traces are bleach corrected. Traces in (A) and (B) are unfiltered, trace in (C) is filtered using low pass Kaisser-Bessel 30 filter (150 Hz cutoff).
Voltage dependent dimerization between fluorescent proteins of different indicator molecules has been proposed as a mechanism of voltage sensitivity of ArcLight and ArcLight-derived indicators.37,47 Residues D389, F444, and T446 (S147, S202, and Q204 in avGFP, Figure S1) impart the high ΔF/ΔV sensitivity of ArcLight.37 These residues are considered to be part of a larger group of amino acids that form the dimer interface in GFP.48,49 However, only substitutions A206K, L221K, and F223R, individually or in combination, have been shown to disrupt dimer formation, rendering GFP monomeric.50 To test directly the possible influence of the dimer interface forming residues on voltage sensitivity, we made saturation libraries at these three positions (T448, L463, and F465 in Marina; Figure 6). None of these mutations produced indicators with increased voltage sensitivity compared to parent probe. In addition, mutagenic libraries of several other residues present in the dimerization interface of GFP49 N149, Y151, R168, S202, and Q204 (Q391, Y393, R410, F444, and T446 in Marina) also did not produce a more sensitive indicator. Similar to what was seen for ArcLight residues, F444, T446, and D469 play crucial roles in the voltage sensitivity of Marina with many mutants diminishing or even reversing the voltage-dependent signal. The fact that mutations to multiple residues that are present in the dimerization interface disrupt voltage sensitivity of the probe is compatible with the hypothesis that intermolecular dimerization plays role in ArcLight probe function.
Figure 6.
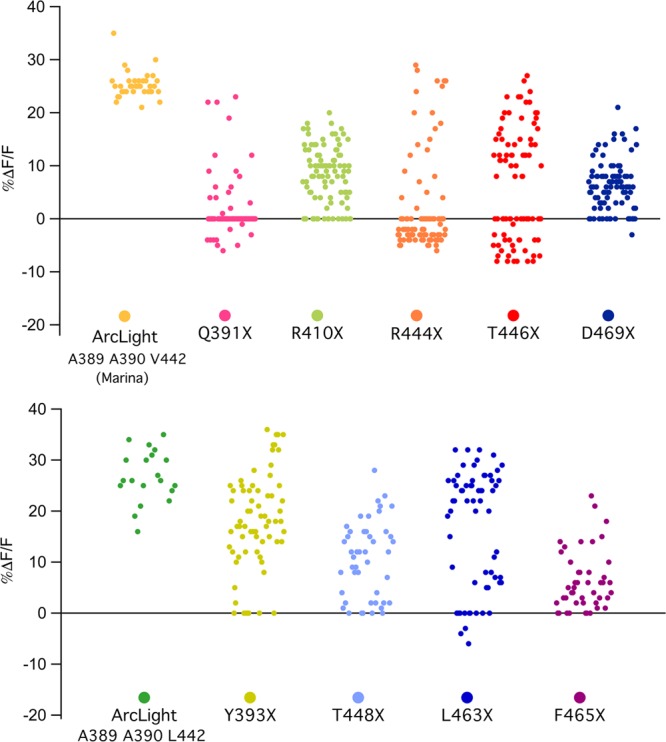
Effects of mutagenic changes in dimerization interface of FP on voltage-dependent response. (A and B) For each of the saturated mutagenesis libraries, 96 colonies were selected and tested for expression and voltage sensitivity. Screening of each library was preformed four times on a custom-made, semiautomated screening platform which allows for simultaneous field stimulation and optical imaging in the 96-well dish format. Screening was performed in electrically active HEK239 cells transiently expressing various mutants. Each dot on the graph represents the highest value of depolarization-dependent fluorescence change detected in each well. (A) ArcLight A389 A390 Y442V-Marina was used as a template for making site-directed mutagenesis libraries on residues which we found to be essential for ArcLight voltage sensitivity and/or involved in FP dimerization (Q391, R410, F444, T446, and D469). (B) ArcLight A389 A390 Y442L was used as a template for making site-directed mutagenesis libraries on residues involved in FP dimerization (Y393, T448, L463, and F465).
Due to the multiple states of its chromophore, wildtype GFP (wtGFP) shows two absorption maxima: the major band absorbs at 398 nm and the minor band absorbs at 475 nm, each of which have similar emissions peaks (508 and 503 nm, respectively).51,52 Excitation causes the chromophore to shift from a neutral (absorption at 398 nm) to an anionic form (absorption at 475 nm) via an excited-state proton transfer (ESPT) resulting in green emission. The ESPT reaction involves multiple residues surrounding the chromophore. It has been shown that mutations of critical residues can result in ESPT disruption but also GFP rewiring with proton pathways relying on alternative proton acceptors.44 In wtGFP, mutation of S65T causes the chromophore to exist primarily in the deprotonated form resulting in a single excitation peak at ∼488 nm.53,54
The original ArcLight (epArcLight), based on fusion of the voltage sensitive domain (VSD) of the Ciona voltage sensitive phosphatase (CiVSP) and ecliptic pHluorin ArcLight) contains a serine at the 65 residue of the GFP (as present in the original ecliptic pHluorin residue 307 from the starting methionine in Ciona VSD).10,39 The ecliptic pHluorin FP imparts dual excitation peaks (395 and 475 nm) in epArcLight, which resembles the spectrum of wild-type GFP18 and GCaMP. The ArcLight in popular use, however, is one in which the FP includes the S65T mutation (i.e., super ecliptic pHluorin)55 found in eGFP, which causes a simplification in the excitation spectrum to a single peak centered at ∼488 nm.53 This version of ArcLight was adopted because its resting brightness was higher.10
To test the voltage sensitivity of different forms of the GFP chromophores (neutral vs anionic), we measured voltage sensitivity in both “negative” and “positive” going variants of ArcLight using either 400 or 488 nm excitation light (Figures 7 and S4). We examined the voltage/fluorescence response of epArcLight and found that a depolarization-dependent increase in fluorescence was present when ∼400 nm light was used, which is a reversal of the response seen with ∼488 nm excitation (Figure 7A). In contrast to epArcLight, super ecliptic pHluorin ArcLight shows no depolarization-dependent increase in fluorescence when excited at ∼400 nm (Figure 7B). In addition, adjustments of the linker length, which increased voltage sensitivity of super ecliptic pHluorin ArcLight,10 had no effect on the voltage sensitivity of the probe at ∼400 nm (Figure 7C).
Figure 7.

Effects of excitation light wavelength on voltage sensitivity in ArcLight-based GEVIs. The voltage sensitivity was tested using whole cell patch clamp electrophysiology combined with optical recording in nonelectrically active HEK293 cells transiently expressing various GEVIs (see also Figure S4). Cells were held at −70 mV holding potential and stepped to +30 mV for 300 ms. All traces were recorded at 1000 Hz using high speed CCD camera. Traces were recorded using either ∼400 nm (traces in light green) or ∼488 nm (traces in dark green) excitation light from LED light source. Light intensity on the sample plane for both wavelengths was adjusted to 8.5 mW/mm2. All traces are single trials and nonfiltered with bleaching removed by subtracting a double exponential fit. (A) Depolarization changes in membrane potential cause either an increase or decrease in fluorescence intensity in Ecliptic pHluorin ArcLight (S249) depending on excitation light wavelength used, ∼400 and ∼488 nm, respectively. Super Ecliptic pHluorin GFP-based GEVIs show no depolarization dependent fluorescence change when ∼400 nm excitation light is used. (B) Super Ecliptic pHluorin ArcLight (S249) and (C) Super Ecliptic pHluorin ArcLight (Q239). (D) ArcLight (A389 A390), (E) ArcLight (S307 A389 A390) and Marina in (F) exhibit significant depolarization dependent voltage sensitivity only when illuminated with ∼488 nm excitation light.
In all “brightening” variants of ArcLight (ArcLight A389 A390 and ArcLight S307 A389 A390), regardless of the amino acid residue present at position 65 within the FP (either serine or threonine), a voltage dependent fluorescence intensity change is present only when ∼488 nm excitation light is used (Figure 7D–F). Therefore, it appears that for the majority of pHluorin-based probes, changes in membrane potential affect the deprotonated and not the protonated form of the fluorophore. Possibly, the voltage change results in the translocation of the FP in relation to an external fixed neighboring charge (possibly the charged head groups of the membrane). This could alter the ionic environment and thereby the fluorescence output of the fluorophore. However, these voltage dependent movements might not affect the neutral form of the fluorophore. The one exception to this is the ecliptic pHluorin version of ArcLight, in which the voltage dependent translocation possibly results in a shift of the fluorophore between the two states.
The present studies indicate that molecular rearrangements in a voltage sensing domain that accompany a change in membrane voltage can result in either an increase or decrease in output fluorescence from the attached fluorescent protein. We have found that mutations to D389 (147 position in eGFP) in ArcLight produce an indicator with a weak positive slope ΔF/ΔV relationship. In addition, we found that mutations of two more amino acid residues in the FP, inward oriented 390 and outward oriented 442, result in a GEVI (Marina) with a large “positive” response. The introduced mutations did not significantly alter the time constants of the response compared to the parent probe ArcLight. The most prominent Marina variant (ArcLight A389 A390 V442) is capable of resolving action potentials and subthreshold events in spontaneously active mammalian neurons. The reversal in signal polarity is an essential first step to production of GEVIs with signal-to-noise characteristics comparable to GCaMPs that will enable more widespread in vivo use.
Methods
Molecular Biology and Construction of Mutagenesis Libraries
All constructs used in this study were derived from genetically encoded-voltage indicator ArcLight-Q239 (GenBank ID: AB183035, AY533296; Plasmid #36856, Addgene, Cambridge, MA). In order to improve expression in mammalian cells, the sequence of ArcLight Q239 was codon optimized using mammalian codon preferences. In order to improve membrane trafficking of the probe, we replaced residues 71–91 within CiVSD with an amino acid sequence (KSRITSEGEYIPLDQIDINV) from the Kir2.1 channel Golgi-to-plasma membrane trafficking signal.56 In order to prevent ER aggregation, the Kir 2.1 channel ER export signal sequence (FCYENEV) was added to C-terminus of ArcLight.57 ArcLight Q239 was fused with a self-cleaving T2A peptide sequence (GSGEGRGSLLTCGDVEENPGP) followed by nuclear localized mCherry. The restriction sites were inserted between the promoter, voltage sensor domain, fluorescent protein domain and nuclear localized tag protein (ApaI, KpnI, EcoRI, SphI, and NheI, respectively) to aid cloning. In order to study the effects of excitation light wavelength on voltage sensitivity, additional probes were used: epArcLight (Ecliptic pHluorin fused to CiVSD at the S249 position) and ArcLight S249 (Super Ecliptic pHluorin fused to CiVSD at the S249 position, Plasmid #36855, Addgene). For neuronal expression of Marina, GEVI CMV promotor was replaced with hSynapsin.
Targeted amino acid mutations were introduced by using the QuikChange II XL site-directed mutagenesis kit (Agilent Technologies, Inc., Santa Clara, CA). For each site-directed mutagenesis library, 96 E. coli colonies were selected and cDNA purified. Each library’s complexity was confirmed by sequencing 10% of selected colonies. We found that a selection of 96 constructs will contain all 20 possible amino acids at the specific residue, and therefore does not require costly and time-consuming sequencing to identify each mutation. Alternatively, in some cases site directed mutagenesis libraries were produced using InFusion system (Clontech Laboratories, Inc., Mountain View, CA). We found that with this system a selection of 48 constructs will contain all 20 possible amino acids at the specific residue. Following functional screening on a semiautomated platform, the most promising constructs from each round were sequenced and the best were used as templates in future rounds of library production.
Cell Culture
This study was carried out in strict accordance with the recommendations in the Guide for the Care and Use of Laboratory Animals of the National Institutes of Health. The protocol was approved by the Pierce Animal Care and Use Committee. HEK 293 cells (AATC, Manassas, VA) were kept in Dulbecco’s modified Eagle’s medium (DMEM, high glucose; Invitrogen, Carlsbad, CA) supplemented with 10% fetal bovine serum (FBS; Sigma-Aldrich, Saint Louis, MO). For functional testing on the semiautomated screening platform, probes were expressed in spontaneously spiking HEK cell line (kind gift from Dr. Adam Cohen of Harvard University).41 Cells were cultured in DMEM/F12, 10% FBS, 1% penicillin (100 U/mL), streptomycin (100 μg/mL), Geneticin (500 μg/mL), and puromycin (2 μg/mL) (Sigma-Aldrich). Cortical neurons were isolated from E16 mouse embryos and maintained in Neurobasal medium with 0.5 mM Glutamax-I and 1 mL of B-27 supplement (Invitrogen) per 50 mL of culture medium. In all cases, cells were plated either on glass bottom 96-well black dishes (Cellvis, Mountain View, CA) or on 12 mm coverslips (Carolina Biological, Burlington, NC) coated with poly-d-lysine hydrobromide (Sigma-Aldrich). Cultures were maintained in a humidified incubator at 37 °C in a 5% CO2 environment. Transient transfection of constructs was accomplished by using half of the manufacturer’s recommended amount of DNA (0.1 μg per 96-well or 0.4 μg per 12 mm coverslip in 24-well dish) and Lipofectamine2000 (0.25 μL per 96-well or 1 μL per 24-well; Invitrogen).
Functional Testing of Potential Probes
A custom built semiautomated screening platform was built around a Nikon Eclipse Ti-E inverted microscope equipped with a Perfect Focus System and fitted with a Nikon Plan Apo 20x 0.75 NA objective (Nikon, Tokyo, Japan) and a pE-300white CoolLED LED illumination System (CoolLED, Ltd., Andover, U.K.) light source. A custom built imaging chamber was attached to a motorized Prior Proscan II stage (Prior Scientific, Inc., Rockland, MA) and maintained constant temperature (37 °C) and humidity of plates during experiments. All image trains were collected using a Hamamatsu ORCA Flash 4.0 sCMOS camera (Hamamatsu, Japan) at a frame rate of either 50 or 100 Hz. For ArcLight-based constructs (GFP) we used a 472/30 nm excitation filter, 495 nm dichroic mirror and 520/35 nm emission filter (Semrock, Rochester, NY). For nuclear localized mCherry visualization we used a 560/40 nm excitation filter, 585 nm dichroic mirror and 630/75 nm emission filter (Chroma Technologies Corp., Bellows Falls, VT). For field stimulation of each single well, we used a custom-made field electrode and actuator system attached to the roof of the imaging chamber. Electrical stimulation, imaging workflow and signal detection was controlled with a custom application written in LabView (National Instruments, Inc., Austin, TX). For cell detection, 16 images of the well bottom were collected and analyzed by a cell identification algorithm that quantified the fluorescence intensity of nuclear localized mCherry. The four fields with the largest number of cells were then selected by the program and used for analysis. For signal detection, a series of images were collected at 100 fps from the preselected fields of views using a GFP filter set. During collection of each image series, a fixed pattern of electrical stimulation was applied to the well. This routine was repeated until time-series images have been recorded from all 96 wells. The region-of-interest (ROI) mask for each cell within a field of view is created by a thresholding algorithm applied to the mCherry channel. A “cell mask” was generated by enlarging each of the mCherry nuclear features. A mean intensity trace for each cell is created from the time-series images recorded using the GFP filter set. The magnitude of the fluorescence signal in each cell was quantified (ΔF/F), and various values of construct performance were evaluated to rank the signal size of a particular construct. Individual cells expressing the same construct showed large variation in fluorescence response amplitudes. We found it necessary to screen each construct in at least four separate plates to get an accurate picture of its performance. We also found that the maximum response amplitude across cells and wells was the most reliable indicator of particular constructs performance in subsequent patch clamp experiments. The values for resting light intensity of HEK cells expressing either GEVI ArcLight or Marina were derived from mean intensity traces recorded using the GFP filter set at the time points prior voltage stimulation. For each cell, resting light intensity value is average of three frames.
Whole Cell Patch Clamp Electrophysiology
Microelectrode recordings were performed in a perfused chamber with the bath temperature kept at 33–35 °C by a temperature feedback controller (Warner Instruments, Hamden, CT). Bath solution contained: 129 mM NaCl, 4 mM KCl, 1 mM CaCl2, 1 mM MgCl2, 10 mM d-glucose, and 10 mM HEPES, pH 7.4 and was adjusted to 310 mOsm with sucrose. We used 3–5 MΩ glass patch pipet (capillary tubing with 1.5/0.75 mm OD/ID-World Precision Instruments, Sarasota, FL) that were pulled on a P-97 Flaming/Brown type micropipet puller (Sutter Instrument Company, Novato, C). For HEK293 cell whole cell patch recordings, the pipet solution contained 125 mM K-gluconate, 8 mM NaCl, 0.6 mM MgCl2, 0.1 mM CaCl2, 1 mM EGTA, 4 mM Mg-ATP, 0.4Na-GTP and 10 mM HEPES, pH 7.2 and adjusted to ∼290 mOsm. Voltage-clamp recordings in the whole-cell configuration were performed using MultiClamp 700B amplifier (Molecular Devices, LLC, Sunnyvale, CA) with a holding potential of −70 mV. Spontaneous activity of cultured cortical neurons was recorded in current clamp mode without holding current injection. The pipet solution for neuronal recordings contained: 130 mM K-gluconate, 10 mM KCl, 4 mM Mg-ATP, 0.3 mM Na2-GTP, 10 mM HEPES and 10 mM Na-phosphocreatin, pH 7.3 and adjusted to ∼310 mOsm. Imaging was performed on an Olympus BX61WI upright microscope using either a LUMFL 60× N.A. 1.10 or a LUMPlan FL 40× N.A. 0.80 water immersion objective (Olympus, Waltham, MA). In the experiments with laser light, all ArcLight-derived constructs were excited with a 488 nm 50 mW laser (DL488-050, CrystaLaser, Reno, NV), using a 495 nm dichroic mirror and 520/35 nm emission filter (Semrock). Excitation light measured at the preparation was 18 mW/mm2, and was adjusted for each recording using a continuous circular neutral density filter (ThorLabs, Inc., Newton, NJ) to the minimum required to record optical signals. For experiments in which constructs were excited with either 400 or 488 nm light, we used a SOLA Light Engine LED light source (Lumencor, Inc., Beaverton, OR). Excitation light measured at the preparation was 8.5 mW/mm2. For excitation at 400 nm we used an ET405/40 nm excitation filter, T495lprx nm dichroic mirror, and 525/50 nm emission filter (Chroma Technologies Corp.). For experiments with 488 nm light excitation, we used a 469/35 nm excitation filter, dichroic mirror 497 nm, and emission filter 525/39 nm (Semrock). The objective image was projected onto the 80 × 80 pixel chip of a NeuroCCD-SM camera controlled by NeuroPlex software (RedShirt Imaging, Decatur, GA). For image demagnification, we used either an Optem zoom system A45731 0.13 or Optem C-to-C mount 25-70-54 0.383 (Qioptiq LINOS, Waltham, MA). Images of all cell types were recorded at a frame rate of 125, 500, or 1000 Hz, and depicted optical traces were simple spatial averages of intensity of all pixels within the region of interest (ROI), with signals processed as previously reported10,58 with double-exponential fitting/subtractions used to compensate for rapid and slow photobleaching. All traces are single trials. SNRs were calculated as the maximum fluorescence response to action potential (as identified by the patch-clamp recording) divided by the SD of the baseline fluorescence. Initially, we used NeuroPlex software (RedShirtImaging, GA) to view the image sequences and output optical and electrophysiological recordings. The data were further processed and statistically analyzed using Igor Pro 6 (Wavemetrics, OR) and Numbers (Apple, Inc., CA).
Statistical Analysis
Results are expressed as means ± SEM, as indicated in figure legends. The statistical significance was evaluated using Student’s t test using IgorPro software (Wavemetrics, OR).
Acknowledgments
We would also like to thank The John B. Pierce Laboratory, Inc. for ongoing support. We would also like to acknowledge the expert technical contributions of the Pierce Laboratory Instrument shop including John Buckley, Andrew Wilkins, Tom D’ Alessandro, Ronald Goodman, and Angelo DiRubba. We would also like to thank Thomas Hughes, Mikhail Drobizhev, and Lauren Barnett for helpful discussions and advice. We are grateful to Madhuvanthi Kannan, Angela Quental, and Daniel Berman for technical assistance in molecular biology. We are grateful to Peter O’Brien for provided technical assistance in imaging.
Supporting Information Available
The Supporting Information is available free of charge on the ACS Publications website at DOI: 10.1021/acschemneuro.6b00234.
List of amino acids within fluorescent protein of GEVIs mutated in this study; size and speed of voltage dependent fluorescence response of GEVI Marina; raw optical traces recorded from the cells shown Figure 3; list of GEVIs (available at Addgene) based on different versions of GFP that were used in the experiment shown in Figure 7 (PDF)
Author Contributions
J.P. and V.A.P. conceived and designed the study. J.P., G.V., and A.Y. performed experiments. J.P., G.V., and V.A.P. analyzed data. J.P. and V.A.P. wrote the manuscript.
The authors would like to thank the National Institutes of Health for supporting the studies described herein (RO1 NS083875 and from the President’s BRAIN Initiative U01NS090565).
The authors declare no competing financial interest.
Supplementary Material
References
- Looger L. L.; Griesbeck O. (2012) Genetically encoded neural activity indicators. Curr. Opin. Neurobiol. 22, 18–23. 10.1016/j.conb.2011.10.024. [DOI] [PubMed] [Google Scholar]
- Siegel M. S.; Isacoff E. Y. (1997) A genetically encoded optical probe of membrane voltage. Neuron 19, 735–741. 10.1016/S0896-6273(00)80955-1. [DOI] [PubMed] [Google Scholar]
- Sakai R.; Repunte-Canonigo V.; Raj C. D.; Knöpfel T. (2001) Design and characterization of a DNA-encoded, voltage-sensitive fluorescent protein. Eur. J. Neurosci. 13, 2314–2318. 10.1046/j.0953-816x.2001.01617.x. [DOI] [PubMed] [Google Scholar]
- Ataka K.; Pieribone V. A. (2002) A Genetically Targetable Fluorescent Probe of Channel Gating with Rapid Kinetics. Biophys. J. 82, 509–516. 10.1016/S0006-3495(02)75415-5. [DOI] [PMC free article] [PubMed] [Google Scholar]
- Dimitrov D.; He Y.; Mutoh H.; Baker B. J.; Cohen L. B.; Akemann W.; Knöpfel T. (2007) Engineering and characterization of an enhanced fluorescent protein voltage sensor. PLoS One 2, e440. 10.1371/journal.pone.0000440. [DOI] [PMC free article] [PubMed] [Google Scholar]
- Lundby A.; Mutoh H.; Dimitrov D.; Akemann W.; Knöpfel T. (2008) Engineering of a Genetically Encodable Fluorescent Voltage Sensor Exploiting Fast Ci-VSP Voltage-Sensing Movements. PLoS One 3, e2514. 10.1371/journal.pone.0002514. [DOI] [PMC free article] [PubMed] [Google Scholar]
- Akemann W.; Mutoh H.; Perron A.; Rossier J.; Knöpfel T. (2010) Imaging brain electric signals with genetically targeted voltage-sensitive fluorescent proteins. Nat. Methods 7, 643–649. 10.1038/nmeth.1479. [DOI] [PubMed] [Google Scholar]
- Jin L.; Baker B. J.; Mealer R.; Cohen L. B.; Pieribone V. A.; Pralle A.; Hughes T. E. (2011) Random insertion of split-cans of the fluorescent protein venus into Shaker channels yields voltage sensitive probes with improved membrane localization in mammalian cells. J. Neurosci. Methods 199, 1–9. 10.1016/j.jneumeth.2011.03.028. [DOI] [PMC free article] [PubMed] [Google Scholar]
- Kralj J. M.; Douglass A. D.; Hochbaum D. R.; Maclaurin D.; Cohen A. E. (2012) Optical recording of action potentials in mammalian neurons using a microbial rhodopsin. Nat. Methods 9, 90–95. 10.1038/nmeth.1782. [DOI] [PMC free article] [PubMed] [Google Scholar]
- Jin L.; Han Z.; Platisa J.; Wooltorton J. R. A.; Cohen L. B.; Pieribone V. A. (2012) Single action potentials and subthreshold electrical events imaged in neurons with a fluorescent protein voltage probe. Neuron 75, 779–785. 10.1016/j.neuron.2012.06.040. [DOI] [PMC free article] [PubMed] [Google Scholar]
- Baker B. J.; Jin L.; Han Z.; Cohen L. B.; Popovic M.; Platisa J.; Pieribone V. A. (2012) Genetically encoded fluorescent voltage sensors using the voltage-sensing domain of Nematostella and Danio phosphatases exhibit fast kinetics. J. Neurosci. Methods 208, 190–196. 10.1016/j.jneumeth.2012.05.016. [DOI] [PMC free article] [PubMed] [Google Scholar]
- Barnett L.; Platisa J.; Popovic M.; Pieribone V. A.; Hughes T. E. (2012) A fluorescent, genetically-encoded voltage probe capable of resolving action potentials. PLoS One 7, e43454. 10.1371/journal.pone.0043454. [DOI] [PMC free article] [PubMed] [Google Scholar]
- Gong Y.; Li J. Z.; Schnitzer M. J. (2013) Enhanced Archaerhodopsin Fluorescent Protein Voltage Indicators. PLoS One 8, e66959. 10.1371/journal.pone.0066959. [DOI] [PMC free article] [PubMed] [Google Scholar]
- Hochbaum D. R.; Zhao Y.; Farhi S. L.; Klapoetke N.; Werley C. A.; Kapoor V.; Zou P.; Kralj J. M.; Maclaurin D.; Smedemark-Margulies N.; Saulnier J. L.; Boulting G. L.; Straub C.; Cho Y. K.; Melkonian M.; Wong G. K.-S.; Harrison D. J.; Murthy V. N.; Sabatini B. L.; Boyden E. S.; Campbell R. E.; Cohen A. E. (2014) All-optical electrophysiology in mammalian neurons using engineered microbial rhodopsins. Nat. Methods 11, 825–833. 10.1038/nmeth.3000. [DOI] [PMC free article] [PubMed] [Google Scholar]
- Flytzanis N. C.; Bedbrook C. N.; Chiu H.; Engqvist M. K. M.; Xiao C.; Chan K. Y.; Sternberg P. W.; Arnold F. H.; Gradinaru V. (2014) Archaerhodopsin variants with enhanced voltage-sensitive fluorescence in mammalian and Caenorhabditis elegans neurons. Nat. Commun. 5, 4894. 10.1038/ncomms5894. [DOI] [PMC free article] [PubMed] [Google Scholar]
- St-Pierre F.; Marshall J. D.; Yang Y.; Gong Y.; Schnitzer M. J.; Lin M. Z. (2014) High-fidelity optical reporting of neuronal electrical activity with an ultrafast fluorescent voltage sensor. Nat. Neurosci. 17 (6), 884–9. 10.1038/nn.3709. [DOI] [PMC free article] [PubMed] [Google Scholar]
- Murata Y.; Iwasaki H.; Sasaki M.; Inaba K.; Okamura Y. (2005) Phosphoinositide phosphatase activity coupled to an intrinsic voltage sensor. Nature 435, 1239–1243. 10.1038/nature03650. [DOI] [PubMed] [Google Scholar]
- Miesenbock G. G.; De Angelis D. A.; Rothman J. E. (1998) Visualizing secretion and synaptic transmission with pH-sensitive green fluorescent proteins. Nature 394 (6689), 192–5. 10.1038/28190. [DOI] [PubMed] [Google Scholar]
- Cao G.; Platisa J.; Pieribone V. A.; Raccuglia D.; Kunst M.; Nitabach M. N. (2013) Genetically targeted optical electrophysiology in intact neural circuits. Cell 154, 904–913. 10.1016/j.cell.2013.07.027. [DOI] [PMC free article] [PubMed] [Google Scholar]
- Klein M.; Afonso B.; Vonner A. J.; Hernandez-Nunez L.; Berck M.; Tabone C. J.; Kane E. A.; Pieribone V. A.; Nitabach M. N.; Cardona A.; Zlatic M.; Sprecher S. G.; Gershow M.; Garrity P. A.; Samuel A. D. T. (2015) Sensory determinants of behavioral dynamics in Drosophila thermotaxis. Proc. Natl. Acad. Sci. U. S. A. 112 (2), E220–9. 10.1073/pnas.1416212112. [DOI] [PMC free article] [PubMed] [Google Scholar]
- Kunst M.; Hughes M. E.; Raccuglia D.; Felix M.; Li M.; Barnett G.; Duah J.; Nitabach M. N. (2014) Calcitonin gene-related peptide neurons mediate sleep-specific circadian output in Drosophila. Curr. Biol. 24, 2652–2664. 10.1016/j.cub.2014.09.077. [DOI] [PMC free article] [PubMed] [Google Scholar]
- Sitaraman D.; Aso Y.; Jin X.; Chen N.; Felix M.; Rubin G. M.; Nitabach M. N. (2015) Propagation of Homeostatic Sleep Signals by Segregated Synaptic Microcircuits of the Drosophila Mushroom Body. Curr. Biol. 25, 2915–2927. 10.1016/j.cub.2015.09.017. [DOI] [PMC free article] [PubMed] [Google Scholar]
- Wooltorton J. R.; He L.; Salzberg B. M.; Fang-Yen C. (2013) In vivo Optical Recordings of Action Potentials in C. elegans Muscles using ArcLight, a Genetically Expressed Voltage Sensitive Fluorescent Protein. Biophys. J. 104, 340a. 10.1016/j.bpj.2012.11.1889. [DOI] [Google Scholar]
- Leyton-Mange J. S.; Mills R. W.; Macri V. S.; Jang M. Y.; Butte F. N.; Ellinor P. T.; Milan D. J. (2014) Rapid Cellular Phenotyping of Human Pluripotent Stem Cell-Derived Cardiomyocytes using a Genetically Encoded Fluorescent Voltage Sensor. Stem Cell Rep. 2, 163–170. 10.1016/j.stemcr.2014.01.003. [DOI] [PMC free article] [PubMed] [Google Scholar]
- Song L.; Awari D. W.; Han E. Y.; Uche-Anya E.; Park S. H.; Yabe Y. A.; Chung W. K.; Yazawa M. (2015) Dual Optical Recordings for Action Potentials and Calcium Handling in Induced Pluripotent Stem Cell Models of Cardiac Arrhythmias Using Genetically Encoded Fluorescent Indicators. Stem Cells Transl. Med. 4, 468. 10.5966/sctm.2014-0245. [DOI] [PMC free article] [PubMed] [Google Scholar]
- Han Z.; Jin L.; Platisa J.; Cohen L. B.; Baker B. J.; Pieribone V. A. (2013) Fluorescent Protein Voltage Probes Derived from ArcLight that Respond to Membrane Voltage Changes with Fast Kinetics. PLoS One 8, e81295. 10.1371/journal.pone.0081295. [DOI] [PMC free article] [PubMed] [Google Scholar]
- Storace D. A.; Braubach O. R.; Jin L.; Cohen L. B.; Sung U. (2015) Monitoring brain activity with protein voltage and calcium sensors. Sci. Rep. 5, 10212. 10.1038/srep10212. [DOI] [PMC free article] [PubMed] [Google Scholar]
- Cohen A. E. (2016) Optogenetics: Turning the Microscope on Its Head. Biophys. J. 110, 997–1003. 10.1016/j.bpj.2016.02.011. [DOI] [PMC free article] [PubMed] [Google Scholar]
- Perron A.; Mutoh H.; Launey T.; Knöpfel T. (2009) Red-shifted voltage-sensitive fluorescent proteins. Chem. Biol. 16, 1268–1277. 10.1016/j.chembiol.2009.11.014. [DOI] [PMC free article] [PubMed] [Google Scholar]
- Mishina Y.; Mutoh H.; Knöpfel T. (2012) Transfer of Kv3.1 voltage sensor features to the isolated Ci-VSP voltage-sensing domain. Biophys. J. 103, 669–676. 10.1016/j.bpj.2012.07.031. [DOI] [PMC free article] [PubMed] [Google Scholar]
- Jung A.; Garcia J. E.; Kim E.; Yoon B.-J.; Baker B. J. (2015) Linker length and fusion site composition improve the optical signal of genetically encoded fluorescent voltage sensors. Neurophotonics 2 (2), 021012. 10.1117/1.NPh.2.2.021012. [DOI] [PMC free article] [PubMed] [Google Scholar]
- Gong Y.; Huang C.; Li J. Z.; Grewe B. F.; Zhang Y.; Eismann S.; Schnitzer M. J. (2015) High-speed recording of neural spikes in awake mice and flies with a fluorescent voltage sensor. Science 350 (6266), 1361–1366. 10.1126/science.aab0810. [DOI] [PMC free article] [PubMed] [Google Scholar]
- Svoboda K. K.; Yasuda R. (2006) Principles of two-photon excitation microscopy and its applications to neuroscience. Neuron 50, 823–839. 10.1016/j.neuron.2006.05.019. [DOI] [PubMed] [Google Scholar]
- Sjulson L. L.; Miesenbock G. G. (2008) Rational optimization and imaging in vivo of a genetically encoded optical voltage reporter. J. Neurosci. 28, 5582–5593. 10.1523/JNEUROSCI.0055-08.2008. [DOI] [PMC free article] [PubMed] [Google Scholar]
- Wilt B. A.; Fitzgerald J. E.; Schnitzer M. J. (2013) Photon shot noise limits on optical detection of neuronal spikes and estimation of spike timing. Biophys. J. 104, 51–62. 10.1016/j.bpj.2012.07.058. [DOI] [PMC free article] [PubMed] [Google Scholar]
- Yang H. H.; St-Pierre F.; Sun X.; Ding X.; Lin M. Z.; Clandinin T. R. (2016) Subcellular Imaging of Voltage and Calcium Signals Reveals Neural Processing In Vivo. Cell 166, 247–257. 10.1016/j.cell.2016.05.031. [DOI] [PMC free article] [PubMed] [Google Scholar]
- Han Z.; Jin L.; Chen F.; LoTurco J. J.; Cohen L. B.; Bondar A.; Lazar J.; Pieribone V. A. (2014) Mechanistic Studies of the Genetically Encoded Fluorescent Protein Voltage Probe ArcLight. PLoS One 9, e113873–e113873. 10.1371/journal.pone.0113873. [DOI] [PMC free article] [PubMed] [Google Scholar]
- Piao H. H.; Rajakumar D.; Kang B. E.; Kim E. H.; Baker B. J. (2015) Combinatorial mutagenesis of the voltage-sensing domain enables the optical resolution of action potentials firing at 60 Hz by a genetically encoded fluorescent sensor of membrane potential. J. Neurosci. 35, 372–385. 10.1523/JNEUROSCI.3008-14.2015. [DOI] [PMC free article] [PubMed] [Google Scholar]
- Treger J. S.; Priest M. F.; Bezanilla F.; Aldrich R.; Aldrich R. (2015) Single-molecule fluorimetry and gating currents inspire an improved optical voltage indicator. eLife 4, e10482. 10.7554/eLife.10482. [DOI] [PMC free article] [PubMed] [Google Scholar]
- Abdelfattah A. S.; Farhi S. L.; Zhao Y.; Brinks D.; Zou P.; Ruangkittisakul A.; Platisa J.; Pieribone V. A.; Ballanyi K.; Cohen A. E.; Campbell R. E. (2016) A Bright and Fast Red Fluorescent Protein Voltage Indicator That Reports Neuronal Activity in Organotypic Brain Slices. J. Neurosci. 36 (8), 2458–2472. 10.1523/JNEUROSCI.3484-15.2016. [DOI] [PMC free article] [PubMed] [Google Scholar]
- Park J.; Werley C. A.; Venkatachalam V.; Kralj J. M.; Dib-Hajj S. D.; Waxman S. G.; Cohen A. E. (2013) Screening fluorescent voltage indicators with spontaneously spiking HEK cells. PLoS One 8, e85221. 10.1371/journal.pone.0085221. [DOI] [PMC free article] [PubMed] [Google Scholar]
- Seifert M. H. J.; Georgescu J.; Ksiazek D.; Smialowski P.; Rehm T.; Steipe B.; Holak T. A. (2003) Backbone dynamics of green fluorescent protein and the effect of histidine 148 substitution. Biochemistry 42, 2500–2512. 10.1021/bi026481b. [DOI] [PubMed] [Google Scholar]
- Agmon N. (2005) Proton pathways in green fluorescence protein. Biophys. J. 88, 2452–2461. 10.1529/biophysj.104.055541. [DOI] [PMC free article] [PubMed] [Google Scholar]
- Stoner-Ma D.; Jaye A. A.; Ronayne K. L.; Nappa J.; Meech S. R.; Tonge P. J. (2008) An Alternate Proton Acceptor for Excited-State Proton Transfer in Green Fluorescent Protein: Rewiring GFP. J. Am. Chem. Soc. 130, 1227–1235. 10.1021/ja0754507. [DOI] [PMC free article] [PubMed] [Google Scholar]
- Shinobu A.; Agmon N. (2015) The Hole in the Barrel: Water Exchange at the GFP Chromophore. J. Phys. Chem. B 119, 3464–3478. 10.1021/jp5127255. [DOI] [PubMed] [Google Scholar]
- Oltrogge L. M.; Boxer S. G. (2015) Short Hydrogen Bonds and Proton Delocalization in Green Fluorescent Protein (GFP). ACS Cent. Sci. 1 (3), 148–156. 10.1021/acscentsci.5b00160. [DOI] [PMC free article] [PubMed] [Google Scholar]
- Kang B. E.; Baker B. J. (2016) Pado, a fluorescent protein with proton channel activity can optically monitor membrane potential, intracellular pH, and map gap junctions. Sci. Rep. 6, 23865. 10.1038/srep23865. [DOI] [PMC free article] [PubMed] [Google Scholar]
- Yang F.; Moss L. G.; Phillips G. N. Jr. (1996) The molecular structure of green fluorescent protein. Nat. Biotechnol. 14 (10), 1246–51. 10.1038/nbt1096-1246. [DOI] [PubMed] [Google Scholar]
- Tsien R. Y. (1998) The green fluorescent protein. Annu. Rev. Biochem. 67, 509–544. 10.1146/annurev.biochem.67.1.509. [DOI] [PubMed] [Google Scholar]
- Zacharias D. A.; Tsien R. Y. (2005) Molecular biology and mutation of green fluorescent protein. Methods Biochem. Anal. 47, 83–120. 10.1002/0471739499.ch5. [DOI] [PubMed] [Google Scholar]
- Heim R.; Prasher D. C.; Tsien R. Y. (1994) Wavelength mutations and posttranslational autoxidation of green fluorescent protein. Proc. Natl. Acad. Sci. U. S. A. 91, 12501–12504. 10.1073/pnas.91.26.12501. [DOI] [PMC free article] [PubMed] [Google Scholar]
- Wachter R. M.; Elsliger M.-A.; Kallio K.; Hanson G. T.; Remington S. J. (1998) Structural basis of spectral shifts in the yellow-emission variants of green fluorescent protein. Structure 6 (10), 1267–1277. 10.1016/S0969-2126(98)00127-0. [DOI] [PubMed] [Google Scholar]
- Heim R.; Cubitt A. B.; Tsien R. Y. (1995) Improved green fluorescence. Nature 373, 663–664. 10.1038/373663b0. [DOI] [PubMed] [Google Scholar]
- Oltrogge L. M.; Wang Q.; Boxer S. G. (2014) Ground-state proton transfer kinetics in green fluorescent protein. Biochemistry 53, 5947–5957. 10.1021/bi500147n. [DOI] [PMC free article] [PubMed] [Google Scholar]
- Sankaranarayanan S.; De Angelis D.; Rothman J. E.; Ryan T. A. (2000) The Use of pHluorins for Optical Measurements of Presynaptic Activity. Biophys. J. 79, 2199–2208. 10.1016/S0006-3495(00)76468-X. [DOI] [PMC free article] [PubMed] [Google Scholar]
- Hofherr A. (2005) Selective Golgi export of Kir2.1 controls the stoichiometry of functional Kir2.x channel heteromers. J. Cell Sci. 118, 1935–1943. 10.1242/jcs.02322. [DOI] [PubMed] [Google Scholar]
- Gradinaru V.; Zhang F.; Ramakrishnan C.; Mattis J.; Prakash R.; Diester I.; Goshen I.; Thompson K. R.; Deisseroth K. (2010) Molecular and Cellular Approaches for Diversifying and Extending Optogenetics. Cell 141, 154–165. 10.1016/j.cell.2010.02.037. [DOI] [PMC free article] [PubMed] [Google Scholar]
- Popovic M. A.; Foust A. J.; McCormick D. A.; Zecevic D. (2011) The spatio-temporal characteristics of action potential initiation in layer 5 pyramidal neurons: a voltage imaging study. J. Physiol. (Oxford, U. K.) 589, 4167–4187. 10.1113/jphysiol.2011.209015. [DOI] [PMC free article] [PubMed] [Google Scholar]
Associated Data
This section collects any data citations, data availability statements, or supplementary materials included in this article.