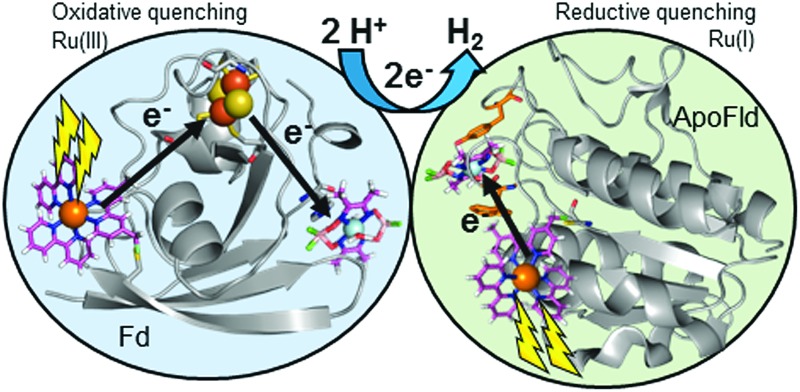
 Two ruthenium-protein-cobaloxime biohybrids produce photocatalytic hydrogen through different catalytic pathways characterized by EPR and transient optical spectroscopies.
Abstract
A series of Ru–protein–Co biohybrids have been prepared using the electron transfer proteins ferredoxin (Fd) and flavodoxin (Fld) as scaffolds for photocatalytic hydrogen production. The light-generated charge separation within these hybrids has been monitored by transient optical and electron paramagnetic resonance spectroscopies. Two distinct electron transfer pathways are observed. The Ru–Fd–Co biohybrid produces up to 650 turnovers of H2 utilizing an oxidative quenching mechanism for Ru(ii)* and a sequential electron transfer pathway via the native [2Fe–2S] cluster to generate a Ru(iii)–Fd–Co(i) charge separated state that lasts for ∼6 ms. In contrast, a direct electron transfer pathway occurs for the Ru–ApoFld–Co biohybrid, which lacks an internal electron relay, generating Ru(i)–ApoFld–Co(i) charge separated state that persists for ∼800 μs and produces 85 turnovers of H2 by a reductive quenching mechanism for Ru(ii)*. This work demonstrates the utility of protein architectures for linking donor and catalytic function via direct or sequential electron transfer pathways to enable stabilized charge separation which facilitates photocatalysis for solar fuel production.
Introduction
The direct conversion of sunlight into chemical fuels is a promising means for the production of clean and renewable carbon-free energy. Storage of solar-converted energy in the form of high-energy chemical bonds of molecules as a reduced fuel, such as hydrogen, is a particularly attractive approach to sustainable energy production. Numerous photocatalytic architectures for hydrogen generation are actively being pursued, with each diverse approach providing important insights about how to link photon-capture to multistep proton coupled electron transfers for catalysis. Hydrogen-evolving molecular catalysts composed of earth abundant metals such as iron, nickel, and cobalt are of particular interest due to future scalability capabilities.1,2 For successful photocatalysis, the reduction of H+ requires the efficient delivery of two successive light-generated electrons to a single catalyst molecule. Typical homogeneous multi-molecular systems operate with a catalyst, freely diffusing photosensitizer (PS) and sacrificial electron donor.2 More recent efforts to replace multi-molecular systems with supramolecular, nanoparticle, or protein-based systems for proton reduction provide opportunities to directly link a PS to a catalyst to increase electron transfer efficiency.3 Supramolecular complexes for hydrogen production have proven to be quite beneficial due to their amenability to spectroscopic resolution of both ground and excited state species,3 but are often hampered by limited stability in solution4,5 or short excited state lifetimes and rapid charge recombination.6 Nanoparticle systems offer an opportunity to improve catalyst photostability and collect electrons or holes on particles until needed for catalysis.3 For example, extensive studies of the RuP–TiO2–cobaloxime system by the Reisner group have shown the ability of nanoparticle complexes to extend charge separation lifetimes to outcompete charge recombination for high H2 production activity.7–9
Biological platforms provide yet another approach to solar fuels generation. Metal catalysts have been inserted into synthetic or semi-synthetic proteins with the goal of creating artificial hydrogenases.10,11 Initial efforts include covalent modification of peptides with earth abundant catalysts.12 More recent efforts to integrate catalysts into full protein architectures include incorporation of a synthetic diiron catalyst into apo-cyt c13 and nitrobindin;14 insertion of cobalt porphyrins15,16 and cobaloximes17 into apo-myoglobin; and a minimal hydrogenase model using a nickel substituted rubredoxin.18 These protein-based systems operate similarly to multi-molecular synthetic systems requiring diffusional interaction of catalyst and PSs (typically [Ru(bpy)3]2+ (bpy = 2,2′-bipyridine) and related derivatives) and achieve up to 520 turnovers (TON) of H2 with sodium ascorbate as a sacrificial electron donor.19 To enable direct supramolecular-like charge separation, an 18-amino acid peptide of cyt c556 has been modified by covalent binding of both a diiron catalyst and a [Ru(bpy)(tpy)(H2O)]2+ (tpy = 2,2′:6′2′′-terpyridine) PS. This system achieves 9 TON with a TOF of 11 h–1 and catalysis ceases with decomposition of the diiron catalyst.20
Many recent studies directly take advantage of photosynthetic reaction center (RC) proteins optimized light capture and charge separation capabilities to drive hydrogen production from abiotic catalysts;21 yet efforts to directly link both molecular PS and catalyst to proteins are limited. Smaller protein-based systems provide a means to target essential features of the RCs within a simpler context for monitoring electron transfer kinetics and charge recombination pathways as related to catalysis. We recently designed a hybrid using directed covalent binding of a [Ru(bpy)3]2+ derived PS ([Ru(4-CH2Br-4′-CH3-2,2′-bpy)(bpy)2]·2PF6, Ru PS) and cobaloxime (Co(dmgBF2)2·2H2O, CoBF2) catalyst to Spinacia oleracea ferredoxin (Fd).22 This Ru–Fd–CoBF2 hybrid achieves 210 ± 60 TON/Ru PS with H2 production for 6–8 hours. Importantly, this is the first biohybrid for which the light-induced intermediates have been spectroscopically analysed. We demonstrated evidence by electron paramagnetic resonance (EPR) and transient optical spectroscopy for the presence of a long-lived (>1.5 ms) Ru(iii)_Fd–Co(i) charge separated state and an oxidative quenching mechanism of the chromophore excited state. Significantly, the native [2Fe–2S] cluster was found to be required for H2 production, serving as an electron relay to shuttle electrons from the PS to the catalyst. Herein, we further interrogate the importance of the [2Fe–2S] cluster as an intermediate redox cofactor in the Fd system and expand upon these results to include another Ru PS–protein–catalyst system that utilizes flavodoxin (Fld) isolated from the thermophilic cyanobacteria, Synechococcus lividus. Through detailed transient optical spectroscopy and EPR studies we are able to differentiate two different mechanisms for electron transfer efficiency related to photocatalytic function in Ru–protein–catalyst systems and suggest implications for the development of biological approaches to solar hydrogen production.
Results and discussion
Preparation and photocatalytic hydrogen production of Ru–Fd–Co biohybrids
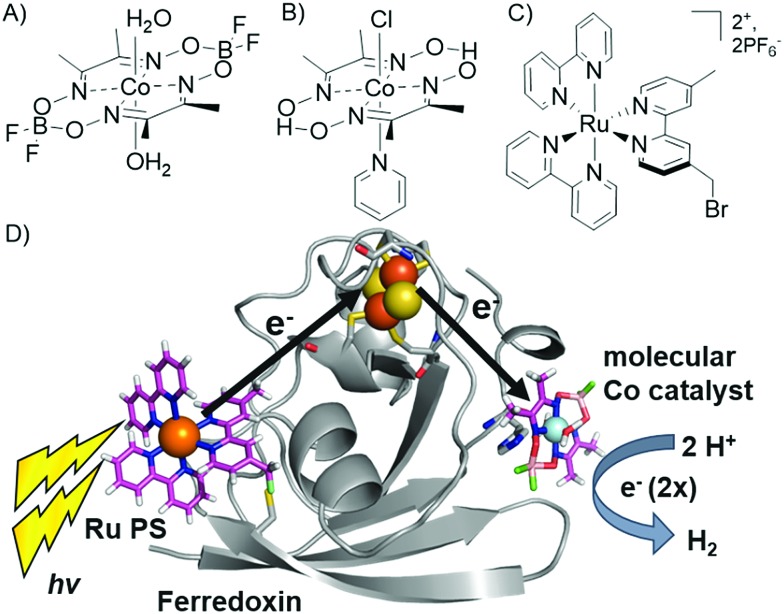
We have reported the photocatalytic hydrogen production for the Ru–Fd–CoBF2 biohybrid complex from S. oleracea Fd (Fig. 1). This complex used a cobaloxime catalyst (Fig. 1A) axially ligated to the nitrogen of Fd His90 and a Ru PS covalently bound through a substitution reaction of the brominated Ru PS (Fig. 1C) with Cys18.22 We now have determined the quantum efficiency for the two electron process of H2 production to be 1.0 ± 0.3% (Table 1). This H2 production quantum efficiency value compares reasonably well to multimolecular systems with Co polypyridyl23 and Co polypyrazine24 catalysts with H2 production quantum efficiencies of 3.6% and 0.49% respectively.
Fig. 1. (A–C) Catalysts and photosensitizers used in the current study. Cobaloxime catalysts (A) Co(dmgBF2)2·2H2O (CoBF2) and (B) Co(dmgH)2pyCl (CoPy) and (C) ruthenium photosensitizer (Ru PS), [Ru(4-CH2Br-4′-CH3-2,2′-bpy)(bpy)2]·2PF6. (D) Photocatalytic hydrogen production scheme in Ru–Fd–CoBF2 biohybrid utilizing electron transfer through the native Fd [2Fe–2S] cluster (1A70).25 .
Table 1. Photocatalysis parameters of Ru–protein–Co biohybrids in 10 mM MES buffer, pH 6.3 with 100 mM sodium ascorbate as a sacrificial electron donor.
In addition, we prepared another Ru–Fd–Co biohybrid complex which uses the cobaloxime catalyst [Co(dmgH)2pyridyl]Cl (CoPy) (Fig. 1B). Previous work has suggested that the CoPy catalyst is a superior H2 evolution catalyst due to the increased lability of the pyridyl ligand allowing access for substrate binding26–28 or increased basicity of the catalyst which facilitates greater catalyst stability.29 ICP-ACS metal analysis of the Ru–Fd–CoPy biohybrid yielded values of 1.2 ± 0.4 Co/Fd and 0.5 ± 0.2 Ru/Fd, similar to the binding ratios observed in our original Ru–Fd–CoBF2 complex. Photocatalysis by the Ru–Fd–CoPy complex (ESI Fig. S1†) resulted in greater than triple the TOF and TON compared to that obtained with the CoBF2 complex (Table 1). This is the highest TON reported for a photocatalytic non-RC molecular PS–protein based system to date. Cobaloximes are known to be relatively unstable under common photocatalytic conditions,22,26 and incorporation of more robust hydrogen evolution catalysts, such as Co polypyridyl23,30 or Ni diphosphine catalysts,31 into our protein-based hybrids could substantially improve the photocatalytic properties of these systems.
Our goal is to not only to prepare functional biohybrids, but to also understand how they work. A significant finding is that removal of the [2Fe–2S] cluster in the Ru–ApoFd–CoBF2 complex prevented H2 production.22 This discovery is further investigated here. In order to confirm that lack of H2 production is due to removal of the redox active [2Fe–2S] cluster and not a secondary effect of partial unfolding of the ApoFd protein, we prepared a related Ru–Fd–Co complex from S. oleracea Fd by substitution of the native Fd [2Fe–2S] for Ga (GaFd). Both solution NMR and X-ray crystallographic studies demonstrate good alignment of GaFd with native Fd and the same structural fold and characterization as the native protein.32–34 Thus, replacement of the native [2Fe–2S] with Ga makes Fd a redox inactive protein and is therefore a useful structural model for native Fd. After binding the CoBF2 catalyst and Ru PS, we determined metal-to-protein ratios of 1.4 Co/Fd and 0.3 Ru/Fd by ICP-AES for the Ru–GaFd–Co complex, which are consistent with the previous metal-to-protein ratios obtained for Ru–Fd–CoBF2 and Ru–ApoFd–CoBF2 samples.22
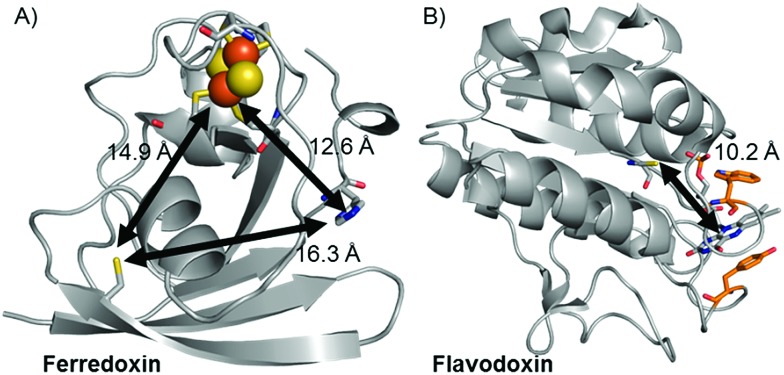
Replacement of the [2Fe–2S] cofactor with Ga yields a Ru–GaFd–Co hybrid with no measurable light-induced H2 production (Table 1), emphasizing the importance of the [2Fe–2S] cluster for photocatalysis. In the Ru–Fd–CoBF2 photocatalysis scheme (Fig. 2A), based on the crystal structure of S. oleracea Fd (1A70),25 the distance between the Cys18 where the Ru PS attaches and the His 90 where the Co catalyst binds is 16.3 Å, whereas the distance between the Cys18 and [2Fe–2S] is 14.9 Å. Our null photocatalysis results for both Ru–ApoFd–CoBF2 22 and Ru–GaFd–CoBF2 suggest that the physical distance between the catalyst and PS is too far for efficient direct electron transfer across the protein, and two electrons must travel this distance sequentially to achieve hydrogen production. Given the equivalent reduction potentials (–0.42 V vs. NHE) of the Fd [2Fe–2S] cluster35 and the CoBF2 catalyst,22 we expect similar driving force for the electron transfer process for each pathway. Based on a simplified picture, in which the rate of electron transfer process is primarily dependent on the distance between the donor and acceptor molecules, we estimate an ∼5 fold faster rate of electron transfer between Ru–[2Fe–2S] than Ru–Co,36 although this does not take into account the edge-to-edge distances of the cofactors. We also note that electron transfer rates vary in α-helical and β-sheet proteins, and that the protein matrix may have an important role in determining the electron transfer rates between the different cofactors.37–40 We next examine a new biohybrid for which only a direct electron transfer pathway exists for photocatalysis.
Fig. 2. Crystal structures of (A) Fd (1A70)25 and (B) Fld (1CZL)42 proteins with distances between possible binding sites for catalysts, PSs, and native redox cofactors. The closest relative distances between catalyst and PS binding sites and redox cofactors are indicated on the figure.
Preparation and photocatalytic hydrogen production of Ru–ApoFld–Co biohybrids
We have used S. lividus ApoFld as a scaffold to make a comparable complex to the Ru–Fd–Co biohybrids. After the native flavin mononucleotide (FMN) cofactor was extracted from Fld, the CoBF2 catalyst was reconstituted with the protein during the refolding process; a method that was developed for incorporation of a nickel diphosphine catalyst.41 Subsequent covalent modification of Cys54 of ApoFld–CoBF2 with the Ru PS produces the Ru–ApoFld–CoBF2 biohybrid complex. ICP-AES measurements indicate binding of 0.9 ± 0.2 Co/Fld and 1.1 ± 0.4 Ru/Fld. We believe that the Co catalyst molecule is non-covalently bound within the FMN binding pocket as binding during the refolding process is necessary; with minimal binding observed to native Fld or already refolded ApoFld (<0.15 Co/Fld). Competition experiments with the native FMN cofactor support this reasoning, as overnight incubation of ApoFld–CoBF2 with excess FMN cofactor (100 equivalents) removes up to 70% of the Co catalyst. Also note, Fld has no His residues to support axial binding of the Co catalyst. Specificity of the Ru PS binding was confirmed by 5,5′-dithio-bis(2-nitrobenzoic acid) (DTNB) modification of Cys54 preventing subsequent Ru PS binding (<0.2 Ru/DTNB-Fld).
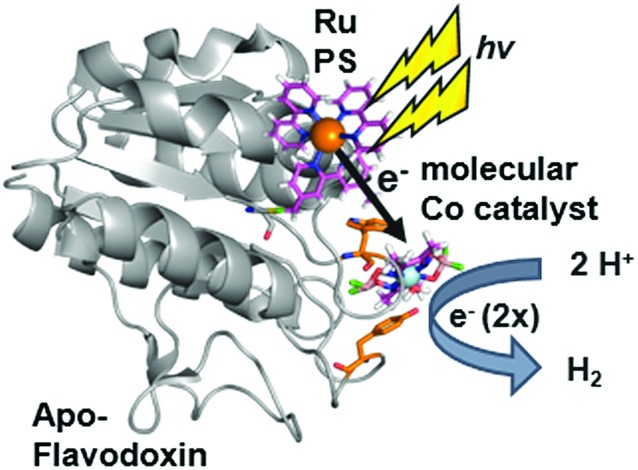
The published crystal structure of Fld from S. elongatus (1CZL),42 which has 69% sequence identity to S. lividus Fld, suggests that the Ru PS binding site at Cys54 (a conserved residue) in Fld is located 10.2 Å from the Co catalyst binding site in the FMN pocket (distance between the Cys thiol and the FMN N3, Fig. 2B). The Ru–ApoFld–CoBF2 biohybrid complex provides a much shorter pathway for electron transfer (Fig. 3) as compared to the direct electron transfer pathway in the Ru–Fd–Co biohybrids where Ru and Co are separated by 16.3 Å. Estimation of the rates of electron transfer based on distance suggest an ∼3000 fold faster rate for Ru–Co ET in Fld vs. Ru–Co ET in Fd assuming similar conditions in the protein environment.36 This is a high estimate of rate, as the edge-to-edge distances of the cofactors are not known, and ongoing crystallization experiments aim to address this issue. As with the Ru–Fd–CoBF2 electron transfer rates, this rate is subject to the nature of the protein environment, and the distribution of coil, sheet, and helical structures.38,40 Since there is no additional electron acceptor in the ApoFld system, the electron transfer pathway must be direct from Ru PS to Co for catalysis to occur.
Fig. 3. Scheme for hydrogen production in Ru–ApoFld–Co biohybrid complexes with electron transfer directly from the Ru PS to the Co catalyst (1CZL).42 The protein is proposed to refold around the catalyst in the FMN binding pocket.
Photocatalysis using Ru–ApoFld–CoBF2 complexes in MES buffer, pH 6.3 with 100 mM sodium ascorbate produced 85 ± 35 TON (Table 1, ESI Fig. S1†). Turnover and H2 production quantum efficiency of Ru–ApoFld–CoBF2 was about 40% of Ru–Fd–CoBF2. We hypothesize that the differences in rate and quantum efficiency for catalysis correlate to (1) the absence of the [2Fe–2S] cluster as an electron relay and/or (2) shorter distance between the cofactors; both of which might enable faster, more efficient back charge recombination. Comparison of the Fd and ApoFld biohybrids emphasize that tuning the spatial arrangement and physical distances of the electron transfer moieties can regulate photocatalysis, as has been long reported for electron transfer in Ru modified proteins.43
Electron paramagnetic resonance
EPR spectroscopy has been previously used to characterize the Co, Ru, and [2Fe–2S] cluster binding sites and probe electron transfer pathways in the Ru–Fd–CoBF2 biohybrid.22 The CoBF2 catalyst binds axially with single nitrogen coordination to the protein as determined by the hyperfine coupling.22,44 We also observed light-driven electron transfer from the Ru PS to the CoBF2 catalyst via a Ru(iii) intermediate detected by EPR.22 We have characterized the new Ru–Fd–CoPy biohybrid by EPR spectroscopy (ESI Fig. S2†) and find that this complex demonstrates a Ru(iii) species upon illumination. This is consistent with our previous work with Ru–Fd–CoBF2 in which we proposed that oxidative quenching of Ru* is the dominant mechanism for electron transfer between Ru PS and [2Fe–2S].22
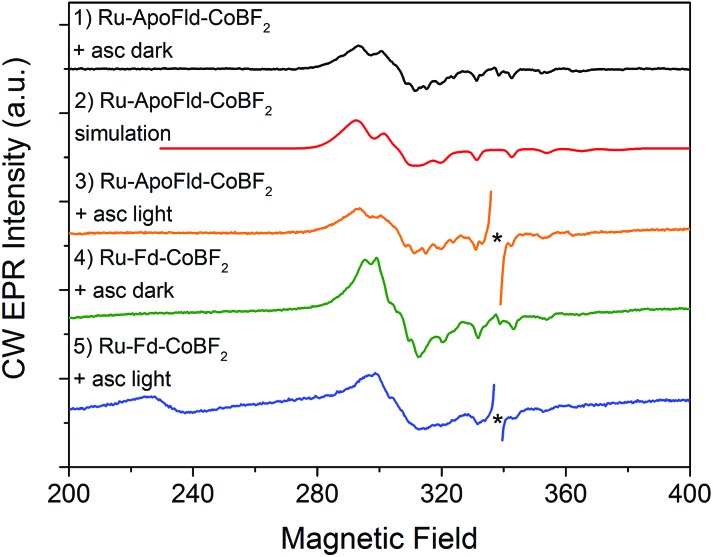
We have also used EPR to characterize the Co binding pocket of the Ru–ApoFld–CoBF2 biohybrid (Fig. 4 and ESI Fig. S3†). In the absence of reductant, minimal Co(ii) signal was observed (ESI Fig. S3†), which is consistent with prior reports of a mix of Co(ii) and Co(iii) for the resting CoBF2 catalyst when embedded in a protein environment.17,22 In the presence of excess sodium ascorbate a significant Co(ii) signal was observed (Fig. 4, black). The Co(ii) EPR spectrum was simulated (Fig. 4, red) with g-value parameters 2.275, 2.179, and 2.0076 and the 59Co A z principal component of 318 MHz. Comparison of the spectral parameters of CoBF2 catalyst in a variety of solvent conditions suggest that the Co catalyst in Ru–ApoFld–CoBF2 is positioned in a polar, protic environment with two water or other oxygen atoms as axial ligands to the Co catalyst (ESI, Fig. S4†).44 The EPR results are thus consistent with the Co catalyst binding in the FMN binding pocket of ApoFld where axial ligands to the catalyst are expected to be water ligands, as there are no free nitrogen ligands (protein residues) in Fld. Additionally, these results indicate that the Co(ii) in the Ru–ApoFld–CoBF2 and Ru–Fd–CoBF2 (Fig. 4, green; g x, 2.250, g y, 2.158, g z, 2.006, A z 280 MHz) have different coordination environments based on the g-value parameters, primarily due to the lack of histidine axial coordination in the ApoFld hybrid.
Fig. 4. CW X-band EPR spectra of Ru–Fd–Co and Ru–ApoFld–Co biohybrids. All EPR spectra were collected at 10 K. Samples were illuminated for 2 s at 293 K, followed by immersion in liquid N2 while illuminated and placed in a pre-cooled (10 K) EPR cavity for measurement. An asterisk marks organic species omitted for clarity. Ru–ApoFld–CoBF2 + asc dark (black, 1); simulation of Ru–ApoFld–CoBF2 (red, 2); Ru–ApoFld–CoBF2 + asc, light (orange, 3); Ru–Fd–CoBF2 + asc, dark (green, 4); Ru–Fd–CoBF2 + asc, light (blue, 5). Ru–Fd–CoBF2 spectra were scaled by a factor of 0.2 for comparison to the Ru–ApoFld–CoBF2 spectra.
In these Ru–Co hybrids, the Ru PS can transfer electrons to the catalyst via an oxidative or reductive quenching mechanism. Upon illumination of the Ru–Fd–Co hybrid with freeze trapping techniques, we observed a decrease in the Co(ii) signal intensity and appearance of a Ru(iii) signal consistent with oxidative quenching of Ru(ii)* by electron transfer to Co, forming an EPR silent Co(i) species (Fig. 4, blue).22 We have continued the examination of the light driven photochemistry for the Ru–ApoFld–CoBF2 biohybrid by EPR. When the sample is illuminated in the presence of sodium ascorbate (Fig. 4, orange), we observe an organic radical species likely due to the ascorbate decay products in the light. Interestingly, we do not observe formation of a Ru(iii) species with the Ru–ApoFld–CoBF2 biohybrid, either without ascorbate (ESI Fig. S3†) or in the presence of ascorbate (Fig. 4, orange). This suggests that electron transfer in the Ru–ApoFld–CoBF2 biohybrid, likely proceeds through a [Ru(bpy)3]+ species (which is a ligand centered reduction of the Ru PS that we were unable to detect by EPR), via a reductive quenching pathway in the presence of high concentrations of ascorbate. For clarity throughout the rest of manuscript, we refer to the reductively quenched [Ru(bpy)3]+ species as Ru(i). Transient optical spectroscopy has been used to help elucidate this species and propose more detailed catalytic pathways.
Transient optical spectroscopy
Transient optical spectroscopy has previously been used to investigate the species formed upon visible light excitation of the Ru PS in the Ru–Fd–Co biohybrids.22 Using single wavelength detection of a Co(i) species at 660 nm, we observed a long-lived (>1.5 ms) Ru(iii)–Fd–Co(i) charge separated state.22 We now present a comprehensive study of the transient states in both the Ru–Fd–Co and Ru–ApoFld–Co biohybrids using full spectral collection from ∼1.4 ns to several hundred milliseconds. This has allowed us to resolve the formation and decay of Ru and Co related species in the catalytic cycle of the Ru–Fd–Co and Ru–ApoFld–Co biohybrids. In both cases, the Ru PS was excited with a 460 nm laser pulse at 10 Hz and transient states were probed with a continuum fiber laser across the visible spectrum. Both biohybrids were probed in the presence of 200 mM sodium ascorbate with sample OD450 ∼ 0.4–0.5.
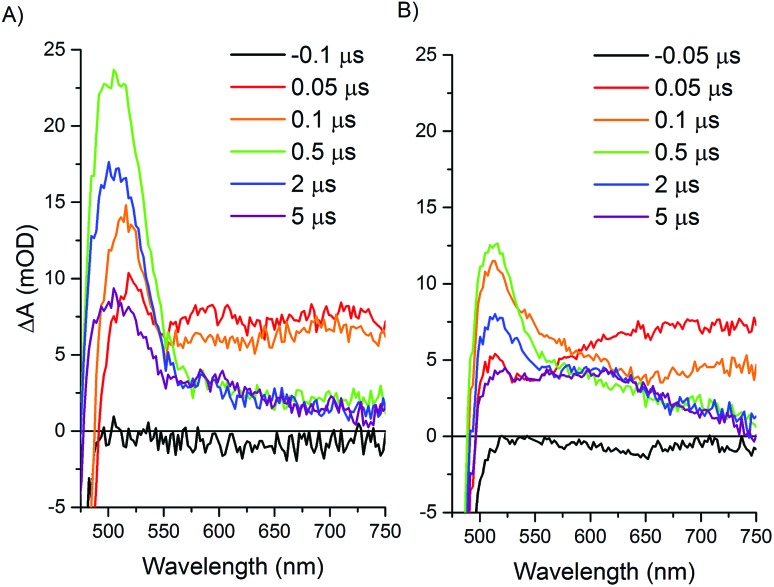
Upon excitation of the resting Ru(ii) state in both the Ru–Fd–CoBF2 and Ru–ApoFld–CoBF2 biohybrids there is an initial feature (50–100 ns) with broad absorption from 650–750 nm (Fig. 5). This feature is consistent with formation of a Ru(ii)* species that decays within a few hundred nanoseconds.45,46 Subsequent electron transfer forms a species with absorption centered around 510 nm and can be attributed to different electron transfer components in the pathways in each of the Ru–protein–Co systems. In the Ru–ApoFld–CoBF2 biohybrid, electron transfer occurs via a direct pathway between Ru PS and CoBF2. We propose that the signal at 510 nm with ∼22 mOD intensity occurs due to Ru(i), generated by reductive quenching of the excited state Ru(ii)* with ascorbate (eqn (1))47
| Ru(ii)*–Co(ii) + Asc ⇆ Ru(i)–Co(ii) + Asc+ | 1 |
Fig. 5. Transient optical absorption spectra at selected early times. Samples contained 200 mM sodium ascorbate and were excited at 460 nm and detected with a fiber laser. (A) Ru–ApoFld–CoBF2 spectra, (B) Ru–Fd–CoBF2 spectra.
In the case of the Ru–Fd–CoBF2 biohybrid, we have a more complicated situation with multiple electron transfer processes occurring on similar time scales. The native [2Fe–2S] cluster acts as an electron relay between Ru PS and CoBF2, which supports the formation of a Ru(iii) species that we observed by EPR.22 There is also formation of a Ru(i) species due to reductive quenching with ascorbate, however, the overall intensity of the 510 nm feature is considerably weaker (∼13 mOD). This feature also includes a broadening with a shoulder extending to ∼600 nm that can be observed in the 0.1–5 μs time traces for Ru–Fd–CoBF2 (Fig. 5B) which is not observed in the time traces of the Ru–ApoFld–CoBF2 sample. The lower intensity of the 510 nm feature and shoulder broadening is consistent with some additional electron transfer intermediates which cannot be uniquely observed in Ru–Fd–CoBF2 due to the overlapping spectral features of the [2Fe–2S] cluster in Fd (ESI Fig. S5†). We have also characterized the electron transfer process in the Ru–Fd hybrid (no Co catalyst) in the ESI (Fig. S6–S8†). We therefore propose that either of the following reactions (eqn (2) and (3)) are possible in Ru–Fd–CoBF2, but assert that the primary pathway for catalysis uses the second reaction (eqn (3)), an oxidative quenching pathway as supported by the Ru(iii) species observed by EPR.
| Ru(ii)*–[2Fe–2S]3+/3+–Co(ii) + Asc ⇆ Ru(i)–[2Fe–2S]3+/3+–Co(ii) + Asc+ | 2 |
| Ru(ii)*–[2Fe–2S]3+/3+–Co(ii) ⇆ Ru(iii)–[2Fe–2S]2+/3+–Co(ii) | 3 |
In eqn (3) one of the iron centers in the [2Fe–2S] cluster is reduced from Fe(iii) to Fe(ii), while the other remains Fe(iii). Some spectral features of the [2Fe–2S] are observed in the visible region (500–650 nm) upon chemical reduction with sodium dithionite (ESI Fig. S5†), which supports the broadening of the 510 nm feature by reduction of the Fd [2Fe–2S] cluster. This feature cannot be clearly resolved due to the overlapping spectral features.
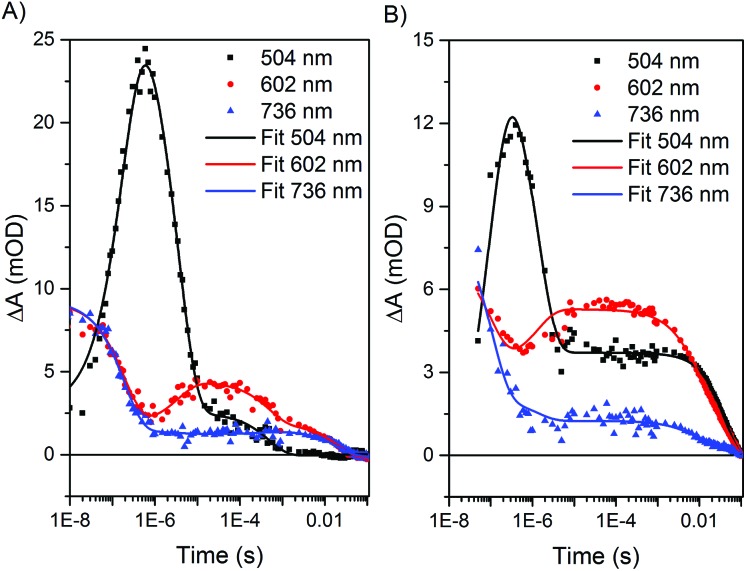
Using a four-exponential equation, a global kinetic fit of the data at three selected wavelengths (504, 602, and 736 nm) could be used to fit the data for both the formation and decay of these early time and later time features in both biohybrids (Table 2 and Fig. 6). The observed time constant for the initial electron transfer in Ru–ApoFld–CoBF2 (τ 1 = 170 ± 30 ns) is similar to what we observed previously in Ru–ApoFd (τ = 200 ± 10 ns),22 which also lacks an internal electron acceptor and we presume proceeds through a Ru(i) intermediate as in eqn (1). By contrast, the observed time constant for initial electron transfer in Ru–Fd–CoBF2 is more rapid (τ 1 = 90 ± 20 ns), which is consistent with Ru(ii)* → Ru(iii) electron transfer to the [2Fe–2S] cluster out competing the diffusionally governed Ru(ii)* → Ru(i) reductive electron transfer. The Ru–Fd biohybrid (no Co) with ascorbate also performs initial electron transfer on a similar time scale (τ 1 = 140 ± 10 ns, ESI Fig. S6–S8†) and is representative of the reductive quenching rate.
Table 2. Kinetic parameters derived from transient optical spectra of Ru–Fd–CoBF2 and Ru–ApoFld–CoBF2 biohybrids in 20 mM Hepes pH 7.9 with 200 mM sodium ascorbate. Samples were excited at 460 nm, and detected across the visible spectrum (Fig. 5 and 7). Kinetic parameters were calculated from global fits of data at 504, 602 and 736 nm (Fig. 6).
| Ru–Fd–CoBF2 | Ru–ApoFld–CoBF2 | |
| τ 1 | 90 ± 20 ns | 170 ± 30 ns |
| τ 2 | 1.5 ± 0.3 μs | 2.5 ± 0.1 μs |
| τ 3 | 6.3 ± 0.2 ms | 810 ± 50 μs |
| τ 4 | 40 ± 4.0 ms | 23 ± 2.9 ms |
Fig. 6. Kinetic fits of transient optical kinetic data for the (A) Ru–ApoFld–CoBF2 and (B) Ru–Fd–CoBF2 biohybrids with 200 mM sodium ascorbate using a global kinetic fitting routine at three wavelengths (504 nm (black), 602 nm (red), and 736 nm (blue)) in Origin Pro 9.1. The data sets were fit with four-exponential decay functions from 10–50 ns to 100 ms.
The species at 510 nm decays more slowly for Ru–ApoFld–CoBF2 than for Ru–Fd–CoBF2 (Table 2). In the Ru–ApoFld–CoBF2 biohybrid, there is only one possible pathway for Ru(ii)* → Co(ii) electron transfer; wherein the reductively quenched Ru(i) state transfers electrons to the Co(ii) catalyst, forming a Ru(ii)–ApoFld–Co(i) charge separated state (eqn (4)) in τ 2 = 2.5 ± 0.1 μs.
| Ru(i)–Co(ii) ⇆ Ru(ii)–Co(i) | 4 |
In Ru–Fd–CoBF2, we propose that the primary pathway for electron transfer is from the reduced [2Fe–2S]2+/3+ cluster to the Co catalyst (eqn (5))
| Ru(iii)–[2Fe–2S]2+/3+–Co(ii) ⇆ Ru(iii)–[2Fe–2S]3+/3+–Co(i) | 5 |
We also may observe the decay of the reductively quenched Ru(i) species with electron transfer through the [2Fe–2S] (τ 2 = 1.5 ± 0.3 μs) (eqn (6))
| Ru(i)–[2Fe–2S]3+/3+–Co(ii) ⇆ Ru(ii)–[2Fe–2S]2+/3+–Co(ii) | 6 |
Direct reduction of the [2Fe–2S] cluster in the absence of Co was observed by EPR in Ru–Fd–CoPy (ESI Fig. S2†) and Ru–Fd22 and transient optical experiments in Ru–Fd (ESI Fig. S6†), which further emphasizes the key role of the [2Fe–2S] in shuttling electrons and preventing back recombination in these biohybrids.
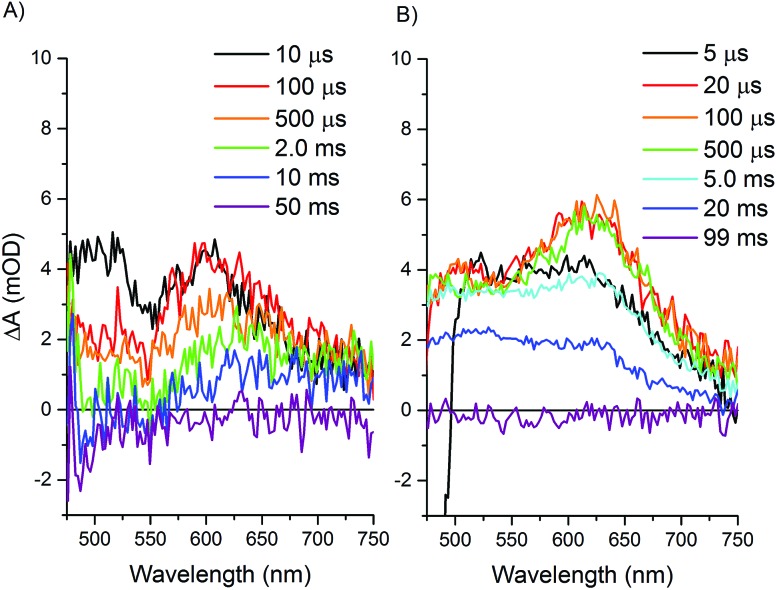
Longer time scale transient optical spectra show formation of an intermediate with an absorbance maximum at about 610 nm for both the Ru–Fd–CoBF2 and Ru–ApoFld–CoBF2 biohybrids (Fig. 7), which we attribute to the formation of a Co(i) species, an expected intermediate for H2 production by cobaloximes (ESI Fig. 9†).1 In the Ru–ApoFld–CoBF2 biohybrid, the Ru(ii)–Co(i) charge separated state (eqn (4)) forms in 2.5 μs (τ 2) and reaches maximum intensity in <10 μs. In Ru–Fd–CoBF2, further electron transfer from intermediates proposed in eqn (3), results in formation of the charge separated species Ru(iii)–Fd–Co(i) according to eqn (5). This species begins to form in 1.5 μs (τ 2), and reaches maximal intensity in about 10–20 μs (Fig. 7B). A Ru(ii)–Fd–Co(i) intermediate could also be achieved by a reductive quenching pathway (eqn (7)).
| Ru(ii)–[2Fe–2S]2+/3+–Co(ii) ⇆ Ru(ii)–[2Fe–2S]3+/3+–Co(i) | 7 |
Fig. 7. Transient optical absorption spectra at selected later times. Samples contained 200 mM sodium ascorbate and were excited at 460 nm and detected with a fiber laser. (A) Ru–ApoFld–CoBF2 spectra, (B) Ru–Fd–CoBF2 spectra.
This reductive pathway certainly is a viable pathway, but since we observe Ru(iii) by EPR, we think that this is a minor contribution in Ru–Fd–CoBF2 system. The μs time constants for formation of the Co(i) species in both biohybrids are similar to what has been observed in the literature for Co(i) species in multimolecular systems with Ru and Re PS.30,48,49
The lifetimes of the charge separated states vary based on the protein environment. In Ru–ApoFld–CoBF2, for which we propose a direct ET pathway from electron donor to acceptor, the lifetime is τ 3 = 810 ± 50 μs (Table 2). In Ru–Fd–CoBF2, for which we propose a sequential electron transfer pathway via [2Fe–2S], the lifetime is τ 3 = 6.3 ± 0.2 ms. This lifetime is consistent with our prior work in which we reported a longer than 1.5 ms lifetime for this charge separated state; however the previous transient absorption set up prevented data acquisition necessary to determine longer lifetimes.22
In Ru–Fd–CoBF2, the spectral feature at 610 nm for the Co(i) species decays in about 40 ms (Table 2), while in Ru–ApoFld–CoBF2 the Co(i) species decays in about 23 ms. These lifetimes allow full recovery of the resting Co(ii) and Ru(ii) states, but are not indicative of the time scale of H2 production. In the Ru–Fd–CoBF2 biohybrid, Ru(iii) is oxidatively quenched by sodium ascorbate to regenerate the Ru(ii) resting state.
These are the first kinetic measurements for biohybrid systems, so for comparison we look to the few reported systems for Co-based synthetic systems. Axially-linked or equatorially-linked Ru–Co supramolecular complexes form Co(i) species that exhibit short lifetimes of 20–70 ps due to rapid charge-recombination in small synthetic architectures that cannot provide opportunities to capture or accumulate electrons needed for catalysis.5,6,50 In multimolecular systems, the Co(i) state of Co–polypyridyl catalysts with Ru PSs have reported lifetimes of 30–60 μs,30,49 while the Co(i) state of another Co–polypyridyl complex with a Re PS has been proposed to last from 2–200 ms.48 Time-resolved X-ray absorption techniques using the CoBF2 catalyst, [Ru(bpy)3]2+ as a PS, and methyl viologen as an electron relay show transient formation of a Co(i) species over the time regime of 0.5–100 μs,51 which is consistent with the time regime for the Co(i) species in our protein hybrids.
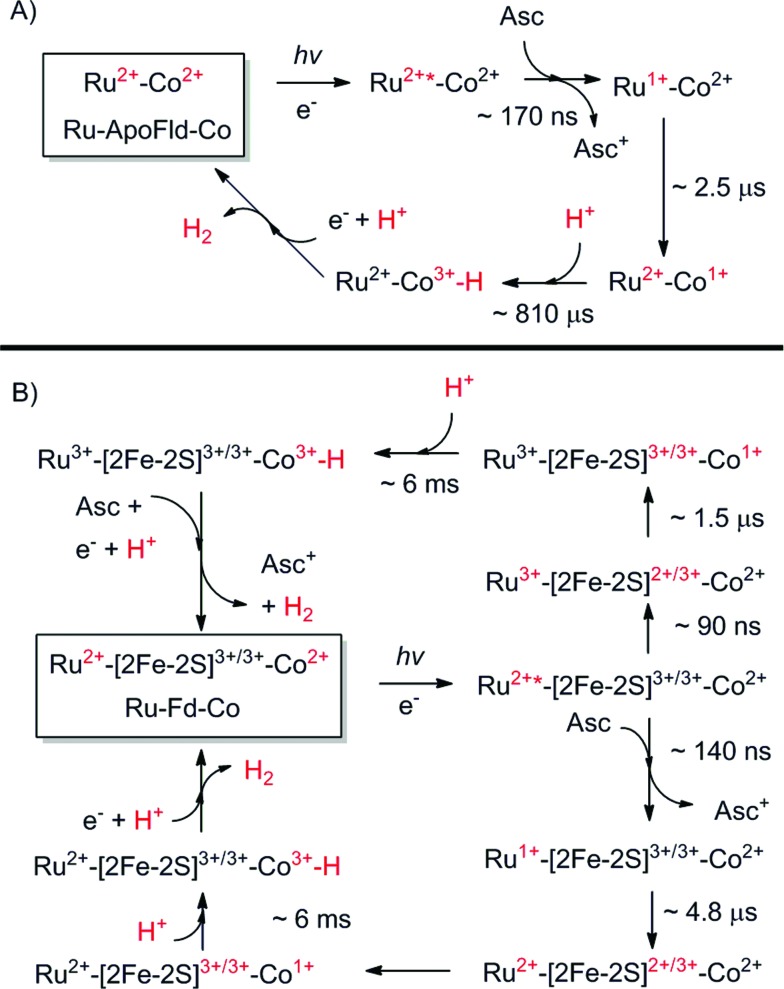
For hydrogen generation in both Ru–Fd–CoBF2 and Ru–ApoFld–CoBF2 the Co(i) species is protonated and we propose that the mechanism of H2 catalysis proceeds through the commonly accepted hetero-coupling mechanism of cobaloximes (Scheme 1).52–54 It is particularly unlikely that a CoBF2 catalyst bound to a protein will diffusionally interact with another Co(iii)–H to proceed through the homo-coupling mechanism.55,56 Protein aggregates can be excluded as intact complexes can be observed by ICP-AES after photocatalysis or transient optical experiments with similar metal binding before and after catalysis. Thus, our experimental results favour the Co(iii)–H scheme for catalysis, which is supported by our results with PSI–Co biohybrids57 as well as recent electrochemical studies on cobaloxime complexes.53,54 We believe the addition of the second electron and proton to our system to be the rate limiting step in catalysis and further investigation of Co–hydride intermediates should help to determine if this is limited by the time needed to regenerate the Ru PS.
Scheme 1. Proposed catalytic cycles of both Ru–Fd–Co and Ru–ApoFld–Co biohybrids as observed by EPR and transient optical kinetic studies. A Co(iii)–H species is shown as a catalytic intermediate as discussed in the text. (A) Ru–ApoFld–Co pathway is unidirectional using a reductive quenching pathway that produces H2. (B) Ru–Fd–Co pathway is bidirectional with an oxidative quenching pathway (top) as the primary pathway to H2 production as observed by EPR. There is evidence for a small component of the reductive quenching pathway (bottom), which can continue on to perform H2 through the above scheme.
Our protein-based hybrids serve as architectures to (1) position the PS and Co catalyst in close proximity, circumventing common diffusion-related challenges encountered by multimolecular systems and (2) stabilize long-lived (ms) charge-separated states by way of the intermediary protein matrix which inhibits back charge recombination. We have shown that in the Ru–Fd–CoBF2 biohybrid, forward electron transfer is fast (μs) compared to slow charge recombination (ms). This is a key feature of photosynthetic RCs which enables their stabilized charge separation: ps or ns forward electron transfers with 102 ms lifetimes of the charge separated state.58 Additionally, the Ru–Fd–CoBF2 biohybrid has an [2Fe–2S] cluster that acts as an electron relay between PS and catalyst and can serve as an electron “holding place” for the second electron necessary for H2 production. Sequential electron relays are an essential design factor of the highly efficient charge separation in RC proteins.59 Thus, in combination, these RC-like features facilitate photocatalysis in our biohybrids when compared to synthetic systems.
Experimental
Preparation of the Ru–protein–catalyst biohybrids
The chemicals for the synthesis of the CoBF2, CoPy, and Ru PS were purchased from Sigma-Aldrich and used as received. The CoBF2 catalyst,60 CoPy catalyst,61 and Ru PS62,63 were synthesized according to published methods.
The Ru–Fd–CoBF2 biohybrids (100–500 μM) were prepared as previously reported from S. oleracea Fd (Sigma-Aldrich) in 20 mM Hepes pH 7.9.22 The Ru–Fd–CoPy biohybrids (100–500 μM) were prepared in the same manner as the Ru–Fd–CoBF2 biohybrids except that a 3–5 mM stock of Co(dmgH)2pyCl was used as the cobaloxime catalyst. Gallium substituted Fd (GaFd) was prepared as previously described including Q-sepharose chromatography and metal content was verified by ICP-AES.33 Ru–GaFd–CoBF2 biohybrid samples (125 μM) were prepared in the same manner as the Ru–Fd–CoBF2 samples using GaFd instead of holo–Fd. Ru–Fd biohybrids were also prepared as previously described.22
Ru–ApoFld–CoBF2 biohybrids were prepared from S. lividus Fld purified according to published methods.64 The FNM cofactor was removed from Fld as reported previously by a trichloroacetic acid precipitation in the presence of dithiothreitol41 and reconstitution with the CoBF2 catalyst at a final concentration of 80 μM in 10 mM Hepes pH 8.0. ApoFld and CoBF2 catalyst were tumbled in the dark at room temperature for 2 h. Unbound catalyst was removed by microfiltration through 3000 MWCO centrifuge devices (Amicon Ultra) using 10 mM Hepes pH 8.0 and multiple wash sequences. Ru PS binding to the ApoFld–CoBF2 complexes was performed by adding 4 mol equiv. of Ru/Fld (6.5 mM stock in DMSO) in 10 mM Hepes pH 8.0. The sample was tumbled at 4 °C overnight in the dark. Unbound Ru PS was removed by microfiltration using 10 mM Hepes pH 8.0. ICP-AES analysis was used to determine the metal-to-protein ratios.
For competition experiments, 8–30 μM Ru–ApoFld–CoBF2 biohybrid was incubated with 100 mol eq. of FMN (Riboflavin 5′-monophosphate, sodium salt, Sigma Aldrich) diluted from a 5 mM stock in 20 mM Hepes buffer pH 7.3. After overnight incubation at 4 °C, unbound metal ions and FMN were removed by microfiltration until all excess FMN was removed as monitored by UV-Vis. ICP-AES was used to quantitate metal binding after the competition experiment, and Co content dropped to ∼30%. The CoBF2 catalyst (12 mol equiv. per Fld) was incubated overnight with holo–Fld (FMN bound), then washed 6 times by microfiltration to remove unbound metals or FMN cofactor. Co binding was determined by ICP-AES (∼0.15 Co/Fld). 5,5′-Dithio-bis(2-nitrobenzoic acid) (DTNB) was used to quantify free cysteine residues in Fld hybrids using the concentration of 2-nitro-5-thiobenzoate anion (ε 412 = 14 150 M–1 cm–1).65 Metal content of all samples was analysed by ICP-AES on a ThermoScientific iCAP6000 spectrometer and compared to known standards. Fd and Fld protein content was determined using the Bradford protein assay method.66 In addition, holo Fd content was verified with an extinction coefficient of 9600 M–1 cm–1 at 422 nm,67 and Fld with an extinction coefficient of 8300 M–1 cm–1 at 465 nm.64
Photocatalytic hydrogen generation
Photocatalytic hydrogen generation experiments for total TON or TOF were performed with a 300 W Xe lamp (Perkin-Elmer) using a long-pass 375 nm filter, a 29 cm water filter, and a short-pass filter (KG-1, Schott) in 3.0–3.8 mL sample volumes with 1–5 μM Ru–protein–catalyst biohybrid as previously described for the Ru–Fd–CoBF2 biohybrids,22 in 10 mM MES buffer, pH 6.3 with 100 mM sodium ascorbate as a sacrificial electron donor. Hydrogen was detected from headspace measurements with a Varian CP-4900A micro gas chromatograph with a 10 m 5 Å molecular sieves column with a thermal conductivity detector and UHP N2 carrier gas. Calibration curves for H2 concentrations were determined using injections of a known standard of 3% H2 in N2.
For the determination of H2 evolution quantum efficiency, a CW LED centered at 455 nm (ThorLabs 455L2) with a DC2100 power controller (ThorLabs) was used to estimate light illuminating the sample at ∼455 nm. Higher protein concentrations (5–10 μM) were required to determine quantum efficiency due to small spot size of the LED on the sample (area = 6.4 × 10⁻⁵ m2). Quantum efficiency was calculated according to eqn (8).
 |
8 |
Hydrogen production rates (mol H2 per s) were calculated from headspace measurements of gas evolution with gas chromatograph per unit time as described above. Initial photon flux at 455 nm was measured with a Quantum Meter (Apogee Instruments Inc.), and corrected for the spot area, with LED power decreased to <3000 μmol photons per m2 per s according to the meter and multiplied by the spot area (unit = mol photons per s). Photon flux on the sample during illumination was determined by UV-visible spectroscopy of the Ru bound fraction of the sample, as determined by ICP-AES, and this value was multiplied by the spot area. The change in photon flux was used to determine mol photons per s.
Electron paramagnetic resonance
Biohybrid protein (Ru–Fd–CoPy, Ru–ApoFld–CoBF2, and Ru–Fd–CoBF2) samples were prepared as discussed above in 20 mM Hepes buffer pH 7.9 at protein concentrations of 400–500 μM. 200 mM sodium ascorbate was added to samples. The sample of Fd reduced with sodium dithionite was prepared with 400 μM Fd in 100 mM CAPS buffer, pH 10.0 with 10 mM sodium dithionite. Samples were prepared in quartz EPR tubes in a nitrogen box as previously described.22 CW X-band (9 GHz) EPR experiments were performed with a Bruker ELEXSYS E580 EPR spectrometer (Bruker Biospin, Rheinstetten, Germany) equipped with a super high Q resonator (Bruker ER 4122SHQE) and a helium gas-flow cryostat (ICE Oxford, UK). Temperature control was provided by an ITC (Oxford Instruments, UK) and illumination was performed with a 300 W Xe lamp (Perkin-Elmer) using a 15 cm water filter, a KG-2 filter (Schott) and a 400 nm long pass filter to block UV and IR light. 200 K illumination was performed in a dry ice/ethanol bath directly in the light, while 293 K illumination was performed directly in the light without additional temperature control. Samples were illuminated for 2 s before immersion in liquid N2 under illumination and subsequent placement in a pre-cooled EPR cavity. Data processing was performing using Xepr (Bruker BioSpin, Rheinstetten, Germany) and MatlabTM 7.11.2 (MathWorks) environment. The magnetic parameters were simulated using EasySpin.68
Transient optical spectroscopy
Ru–Fd, Ru–Fd–CoBF2, and Ru–ApoFld–CoBF2 biohybrid samples were prepared as described above to ∼250–500 μM in 20 mM Hepes buffer, pH 7.9 and placed in 2 mm cuvettes to provide sufficient optical density (A 450 nm ∼ 0.4–0.5). Nitrogen gas was bubbled over the top of samples for at least 10 minutes before collecting spectra. Aliquots of sodium ascorbate were injected to a concentration of 200 mM in appropriate samples before excitation.
Transient absorption measurements were performed using a homebuilt instrument. The optical pump was generated using a diode pumped Nd:YAG and OPA system tuned to 460 nm (Ekspla PL220 and PG403). The repetition rate for the pump beam was 10 Hz with a pulse power of 350 μJ cm–2 at the sample. The broadband probe was generated via a supercontinuum fiber laser (Leukos STM). The probe repetition rate was 1.0 kHz and pulse power was ∼10 μJ cm–2. The time delay between the optical pump and probe beams was obtained using a delay generator (SRS DG535) giving an overall instrument response function of ∼1.4 ns (ESI Fig. S10†). Dithering of a stir bar during data collection allowed continuous mixing of samples throughout the measurement. UV-visible spectra of the samples after the transient optical measurements were collected to check for sample degradation. Data was binned by a factor of 4 or 16 and four-exponential kinetic fits were determined by a Global Fitting routine for the three selected wavelengths (504 nm, 602 nm, 736 nm) using Origin Pro 9.1 from 10–50 ns to 100 ms. The specific fitting wavelengths (504 nm, 602 nm, and 736 nm) were selected as near the center of the Ru(i) species, Co(i) species, and Ru(ii)* species, respectively, while the 504 and 602 nm wavelengths also represent the broadening of the Ru(i) signal from reduction of the [2Fe–2S] cluster in Ru–Fd–Co. Data collection time averaged about 2 hours for each short time scale data set and an additional 2 hours for each long time scale data set.
Conclusions
We have developed two systems for photocatalytic hydrogen production that both directly link a proton reduction catalyst and a PS with a protein scaffold (Scheme 1), yet utilize different electron transfer pathways to achieve catalysis. The first system, Ru–Fd–Co, uses an internal electron transfer relay through the [2Fe–2S] cluster of Fd to transport electrons to the Co catalyst using an oxidative quenching mechanism via Ru(iii). Our extensive EPR and transient optical spectroscopy studies indicate that a long lived (6.3 ± 0.2 ms) light-induced Ru(iii)–Fd–Co(i) charge separated state forms which gives this hybrid system increased stability and longevity as a photocatalytic system. We have also studied the ability to perturb and modify this system, through removal of the [2Fe–2S] cluster22 and replacement of the [2Fe–2S] with a redox inactive metal, Ga. Photocatalysis is not observed in the absence of the redox active cofactor, supporting our assertion that sequential electron transfer pathway thru the [2Fe–2S] cluster is the functional pathway. Changing the catalyst from the CoBF2 catalyst previously studied22 to the CoPy catalyst increases the catalytic turnover of the system by a factor of greater than three.
The second system, Ru–ApoFld–Co, does not contain an internal electron transfer relay and we propose that light-induced electron transfer from the Ru PS directly to the Co catalyst initiates photocatalysis. This system relies on a close spatial arrangement of electron donor and acceptor for direct transfer of electrons necessary for hydrogen production. Through our EPR and transient optical spectroscopy results, we demonstrate that the Ru–ApoFd–Co biohybrid utilizes a Ru(ii)–Co(i) charge separated state formed after reductive quenching of the Ru PS. This species has a shorter lifetime, 810 ± 50 μs which might be the result of more favorable back charge recombination due to the shorter distance between cofactors or the lack of an intermediary electron acceptor. Through these two different systems, we have developed a new regime for protein engineering to place catalysts, PSs, and redox active electron transfer moieties at designed locations in the protein scaffolds to enable rapid electron transfer and prohibit charge recombination. Continued studies of biohybrid designs will provide a knowledge base about system catalysis function related to underlying electron transfer kinetic mechanisms and pathways that will guide future development of photochemical systems for conversion and storage of sunlight.
Acknowledgments
This work is supported by the Division of Chemical Sciences, Geosciences, and Biosciences, Office of Basic Energy Sciences of the U.S. Department of Energy under Contract No. DE-AC02-06CH11357.
Footnotes
References
- Dempsey J. L., Brunschwig B. S., Winkler J. R., Gray H. B. Acc. Chem. Res. 2009;42:1995–2004. doi: 10.1021/ar900253e. [DOI] [PubMed] [Google Scholar]
- Du P. W., Eisenberg R. Energy Environ. Sci. 2012;5:6012–6021. [Google Scholar]
- Mulfort K. L., Utschig L. M. Acc. Chem. Res. 2016;49:835–843. doi: 10.1021/acs.accounts.5b00539. [DOI] [PubMed] [Google Scholar]
- Fihri A., Artero V., Razavet M., Baffert C., Leibl W., Fontecave M. Angew. Chem., Int. Ed. 2008;47:564–567. doi: 10.1002/anie.200702953. [DOI] [PubMed] [Google Scholar]
- Mulfort K. L., Mukherjee A., Kokhan O., Du P. W., Tiede D. M. Chem. Soc. Rev. 2013;42:2215–2227. doi: 10.1039/c2cs35247h. [DOI] [PubMed] [Google Scholar]
- Mukherjee A., Kokhan O., Huang J., Niklas J., Chen L. X., Tiede D. M., Mulfort K. L. Phys. Chem. Chem. Phys. 2013;15:21070–21076. doi: 10.1039/c3cp54420f. [DOI] [PubMed] [Google Scholar]
- Reynal A., Lakadamyali F., Gross M. A., Reisner E., Durrant J. R. Energy Environ. Sci. 2013;6:3291–3300. [Google Scholar]
- Lakadamyali F., Reisner E. Chem. Commun. 2011;47:1695–1697. doi: 10.1039/c0cc04658b. [DOI] [PubMed] [Google Scholar]
- Reynal A., Pastor E., Gross M. A., Selim S., Reisner E., Durrant J. R. Chem. Sci. 2015;6:4855–4859. doi: 10.1039/c5sc01349f. [DOI] [PMC free article] [PubMed] [Google Scholar]
- Olson T. L., Espiritu E., Edwardraja S., Simmons C. R., Williams J. C., Ghirlanda G., Allen J. P. Biochim. Biophys. Acta, Bioenerg. 2016;1857:539–547. doi: 10.1016/j.bbabio.2015.09.003. [DOI] [PubMed] [Google Scholar]
- Lichtenstein B. R., Bialas C., Cerda J. F., Fry B. A., Dutton P. L., Moser C. C. Angew. Chem., Int. Ed. 2015;54:13626–13629. doi: 10.1002/anie.201507094. [DOI] [PMC free article] [PubMed] [Google Scholar]
- Roy A., Madden C., Ghirlanda G. Chem. Commun. 2012;48:9816–9818. doi: 10.1039/c2cc34470j. [DOI] [PubMed] [Google Scholar]
- Sano Y., Onoda A., Hayashi T. Chem. Commun. 2011;47:8229–8231. doi: 10.1039/c1cc11157d. [DOI] [PubMed] [Google Scholar]
- Onoda A., Kihara Y., Fukumoto K., Sano Y., Hayashi T. ACS Catal. 2014;4:2645–2648. [Google Scholar]
- Sommer D. J., Vaughn M. D., Ghirlanda G. Chem. Commun. 2014;50:15852–15855. doi: 10.1039/c4cc06700b. [DOI] [PubMed] [Google Scholar]
- Sommer D. J., Vaughn M. D., Clark B. C., Tomlin J., Roy A., Ghirlanda G. Biochim. Biophys. Acta, Bioenerg. 2016;1857:598–603. doi: 10.1016/j.bbabio.2015.09.001. [DOI] [PubMed] [Google Scholar]
- Bacchi M., Berggren G., Niklas J., Veinberg E., Mara M. W., Shelby M. L., Poluektov O. G., Chen L. X., Tiede D. M., Cavazza C., Field M. J., Fontecave M., Artero V. Inorg. Chem. 2014;53:8071–8082. doi: 10.1021/ic501014c. [DOI] [PubMed] [Google Scholar]
- Slater J. W., Shafaat H. S. J. Phys. Chem. Lett. 2015;6:3731–3736. doi: 10.1021/acs.jpclett.5b01750. [DOI] [PubMed] [Google Scholar]
- Kandemir B., Chakraborty S., Guo Y., Bren K. L. Inorg. Chem. 2016;55:467–477. doi: 10.1021/acs.inorgchem.5b02054. [DOI] [PubMed] [Google Scholar]
- Sano Y., Onoda A., Hayashi T. J. Inorg. Biochem. 2012;108:159–162. doi: 10.1016/j.jinorgbio.2011.07.010. [DOI] [PubMed] [Google Scholar]
- Utschig L. M., Soltau S. R., Tiede D. M. Curr. Opin. Chem. Biol. 2015;25:1–8. doi: 10.1016/j.cbpa.2014.11.019. [DOI] [PubMed] [Google Scholar]
- Soltau S. R., Niklas J., Dahlberg P. D., Poluektov O. G., Tiede D. M., Mulfort K. L., Utschig L. M. Chem. Commun. 2015;51:10628–10631. doi: 10.1039/c5cc03006d. [DOI] [PubMed] [Google Scholar]
- Nippe M., Khnayzer R. S., Panetier J. A., Zee D. Z., Olaiya B. S., Head-Gordon M., Chang C. J., Castellano F. N., Long J. R. Chem. Sci. 2013;4:3934–3945. [Google Scholar]
- Jurss J. W., Khnayzer R. S., Panetier J. A., El Roz K. A., Nichols E. M., Head-Gordon M., Long J. R., Castellano F. N., Chang C. J. Chem. Sci. 2015;6:4954–4972. doi: 10.1039/c5sc01414j. [DOI] [PMC free article] [PubMed] [Google Scholar]
- Binda C., Coda A., Aliverti A., Zanetti G., Mattevi A. Acta Crystallogr., Sect. D: Biol. Crystallogr. 1998;54:1353–1358. doi: 10.1107/s0907444998005137. [DOI] [PubMed] [Google Scholar]
- McCormick T. M., Calitree B. D., Orchard A., Kraut N. D., Bright F. V., Detty M. R., Eisenberg R. J. Am. Chem. Soc. 2010;132:15480–15483. doi: 10.1021/ja1057357. [DOI] [PubMed] [Google Scholar]
- Lazarides T., McCormick T., Du P. W., Luo G. G., Lindley B., Eisenberg R. J. Am. Chem. Soc. 2009;131:9192–9194. doi: 10.1021/ja903044n. [DOI] [PubMed] [Google Scholar]
- Du P. W., Schneider J., Luo G. G., Brennessel W. W., Eisenberg R. Inorg. Chem. 2009;48:4952–4962. doi: 10.1021/ic900389z. [DOI] [PubMed] [Google Scholar]
- Panagiotopoulos A., Ladomenou K., Sun D., Artero V., Coutsolelos A. G. Dalton Trans. 2016;45:6732–6738. doi: 10.1039/c5dt04502a. [DOI] [PMC free article] [PubMed] [Google Scholar]
- Khnayzer R. S., Thoi V. S., Nippe M., King A. E., Jurss J. W., El Roz K. A., Long J. R., Chang C. J., Castellano F. N. Energy Environ. Sci. 2014;7:1477–1488. [Google Scholar]
- McLaughlin M. P., McCormick T. M., Eisenberg R., Holland P. L. Chem. Commun. 2011;47:7989–7991. doi: 10.1039/c1cc12347e. [DOI] [PubMed] [Google Scholar]
- Xu X., Scanu S., Chung J. S., Hirasawa M., Knaff D. B., Ubbink M. Biochemistry. 2010;49:7790–7797. doi: 10.1021/bi100712g. [DOI] [PubMed] [Google Scholar]
- Xu X., Kim S. K., Schurmann P., Hirasawa M., Tripathy J. N., Smith J., Knaff D. B., Ubbink M. FEBS Lett. 2006;580:6714–6720. doi: 10.1016/j.febslet.2006.11.027. [DOI] [PubMed] [Google Scholar]
- Mutoh R., Muraki N., Shinmura K., Kubota-Kawai H., Lee Y. H., Nowaczyk M. M., Rogner M., Hase T., Ikegami T., Kurisu G. Biochemistry. 2015;54:6052–6061. doi: 10.1021/acs.biochem.5b00601. [DOI] [PubMed] [Google Scholar]
- Cammack R., Rao K. K., Bargeron C. P., Hutson K. G., Andrew P. W., Rogers L. J. Biochem. J. 1977;168:205–209. doi: 10.1042/bj1680205. [DOI] [PMC free article] [PubMed] [Google Scholar]
- Moser C. C., Keske J. M., Warncke K., Farid R. S., Dutton P. L. Nature. 1992;355:796–802. doi: 10.1038/355796a0. [DOI] [PubMed] [Google Scholar]
- Axup A. W., Albin M., Mayo S. L., Crutchley R. J., Gray H. B. J. Am. Chem. Soc. 1988;110:435–439. [Google Scholar]
- Wuttke D. S., Bjerrum M. J., Winkler J. R., Gray H. B. Science. 1992;256:1007–1009. doi: 10.1126/science.256.5059.1007. [DOI] [PubMed] [Google Scholar]
- Onuchic J. N., Beratan D. N., Winkler J. R., Gray H. B. Annu. Rev. Biophys. Biomol. Struct. 1992;21:349–377. doi: 10.1146/annurev.bb.21.060192.002025. [DOI] [PubMed] [Google Scholar]
- Bjerrum M. J., Casimiro D. R., Chang I. J., Di Bilio A. J., Gray H. B., Hill M. G., Langen R., Mines G. A., Skov L. K., Winkler J. R. J. Bioenerg. Biomembr. 1995;27:295–302. doi: 10.1007/BF02110099. [DOI] [PubMed] [Google Scholar]
- Silver S. C., Niklas J., Du P. W., Poluektov O. G., Tiede D. M., Utschig L. M. J. Am. Chem. Soc. 2013;135:13246–13249. doi: 10.1021/ja405277g. [DOI] [PubMed] [Google Scholar]
- Hoover D. M., Drennan C. L., Metzger A. L., Osborne C., Weber C. H., Pattridge K. A., Ludwig M. L. J. Mol. Biol. 1999;294:725–743. doi: 10.1006/jmbi.1999.3152. [DOI] [PubMed] [Google Scholar]
- Meade T. J., Gray H. B., Winkler J. R. J. Am. Chem. Soc. 1989;111:4353–4356. [Google Scholar]
- Niklas J., Mardis K. L., Rakhimov R. R., Mulfort K. L., Tiede D. M., Poluektov O. G. J. Phys. Chem. B. 2012;116:2943–2957. doi: 10.1021/jp209395n. [DOI] [PMC free article] [PubMed] [Google Scholar]
- Muller P., Brettel K. Photochem. Photobiol. Sci. 2012;11:632–636. doi: 10.1039/c2pp05333k. [DOI] [PubMed] [Google Scholar]
- Tarnovsky A. N., Gawelda W., Johnson M., Bressler C., Chergui M. J. Phys. Chem. B. 2006;110:26497–26505. doi: 10.1021/jp064696f. [DOI] [PubMed] [Google Scholar]
- Shan B., Baine T., Ma X. A. N., Zhao X., Schmehl R. H. Inorg. Chem. 2013;52:4853–4859. doi: 10.1021/ic302381w. [DOI] [PubMed] [Google Scholar]
- Rodenberg A., Orazietti M., Probst B., Bachmann C., Alberto R., Baldridge K. K., Hamm P. Inorg. Chem. 2015;54:646–657. doi: 10.1021/ic502591a. [DOI] [PubMed] [Google Scholar]
- Lewandowska-Andralojc A., Baine T., Zhao X., Muckerman J. T., Fujita E., Polyansky D. E. Inorg. Chem. 2015;54:4310–4321. doi: 10.1021/ic5031137. [DOI] [PubMed] [Google Scholar]
- Mulfort K. L., Tiede D. M. J. Phys. Chem. B. 2010;114:14572–14581. doi: 10.1021/jp1023636. [DOI] [PubMed] [Google Scholar]
- Smolentsev G., Cecconi B., Guda A., Chavarot-Kerlidou M., van Bokhoven J. A., Nachtegaal M., Artero V. Chemistry. 2015;21:15158–15162. doi: 10.1002/chem.201502900. [DOI] [PMC free article] [PubMed] [Google Scholar]
- Solis B. H., Hammes-Schiffer S. J. Am. Chem. Soc. 2011;133:19036–19039. doi: 10.1021/ja208091e. [DOI] [PubMed] [Google Scholar]
- Rountree E. S., Martin D. J., McCarthy B. D., Dempsey J. L. ACS Catal. 2016;6:3326–3335. [Google Scholar]
- Wiedner E. S., Bullock R. M. J. Am. Chem. Soc. 2016;138:8309–8318. doi: 10.1021/jacs.6b04779. [DOI] [PubMed] [Google Scholar]
- Muckerman J. T., Fujita E. Chem. Commun. 2011;47:12456–12458. doi: 10.1039/c1cc15330g. [DOI] [PubMed] [Google Scholar]
- Lacy D. C., Roberts G. M., Peters J. C. J. Am. Chem. Soc. 2015;137:4860–4864. doi: 10.1021/jacs.5b01838. [DOI] [PubMed] [Google Scholar]
- Utschig L. M., Silver S. C., Mulfort K. L., Tiede D. M. J. Am. Chem. Soc. 2011;133:16334–16337. doi: 10.1021/ja206012r. [DOI] [PubMed] [Google Scholar]
- Blankenship R. E., Molecular Mechanisms of Photosynthesis, Blackwell Science Ltd, Malden, USA, 2002. [Google Scholar]
- Lubner C. E., Grimme R., Bryant D. A., Golbeck J. H. Biochemistry. 2010;49:404–414. doi: 10.1021/bi901704v. [DOI] [PubMed] [Google Scholar]
- Bakac A., Espenson J. H. J. Am. Chem. Soc. 1984;106:5197–5202. [Google Scholar]
- Trogler W. C., Stewart R. C., Epps L. A., Marzilli L. G. Inorg. Chem. 1974;13:1564–1570. [Google Scholar]
- Sun L. C., Berglund H., Davydov R., Norrby T., Hammarstrom L., Korall P., Borje A., Philouze C., Berg K., Tran A., Andersson M., Stenhagen G., Martensson J., Almgren M., Styring S., Akermark B. J. Am. Chem. Soc. 1997;119:6996–7004. [Google Scholar]
- Gould S., Strouse G. F., Meyer T. J., Sullivan B. P. Inorg. Chem. 1991;30:2942–2949. [Google Scholar]
- Crespi H. L., Smith U., Gajda L., Tisue T., Ammeraal R. M. Biochim. Biophys. Acta, Bioenerg. 1972;256:611–618. doi: 10.1016/0005-2728(72)90196-x. [DOI] [PubMed] [Google Scholar]
- Riddles P. W., Blakeley R. L., Zerner B. Methods Enzymol. 1983;91:49–60. doi: 10.1016/s0076-6879(83)91010-8. [DOI] [PubMed] [Google Scholar]
- Bradford M. M. Anal. Biochem. 1976;72:248–254. doi: 10.1006/abio.1976.9999. [DOI] [PubMed] [Google Scholar]
- Moal G., Lagoutte B. Biochim. Biophys. Acta, Bioenerg. 2012;1817:1635–1645. doi: 10.1016/j.bbabio.2012.05.015. [DOI] [PubMed] [Google Scholar]
- Stoll S., Schweiger A. J. Magn. Reson. 2006;178:42–55. doi: 10.1016/j.jmr.2005.08.013. [DOI] [PubMed] [Google Scholar]
Associated Data
This section collects any data citations, data availability statements, or supplementary materials included in this article.


