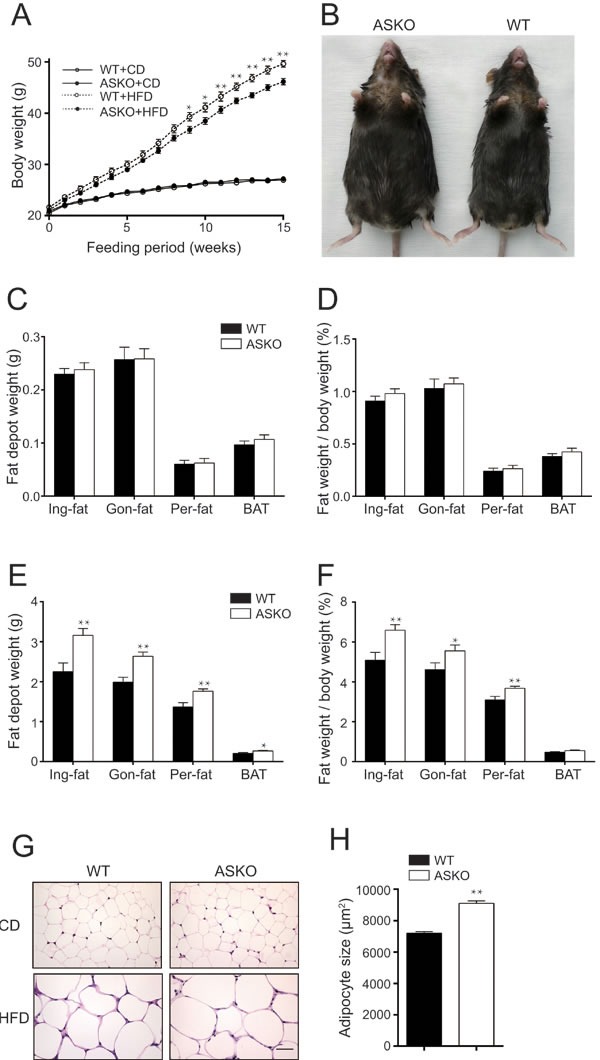
Figure 2. Increased body weight and fat content in ASKO mice under HFD conditions. A.

Body weight of the WT and ASKO mice on both diet conditions (n > 10). B. Representative photographs of mice exhibiting HFD-induced obesity. C.-D. Organ weight analysis from CD-fed D.-F., n = 12) and HFD-fed E.-F., n > 11) mice, including absolute fat pad weight, the percentage of the total body weight and absolute weight of other peripheral organs, as indicated in the figure. G. H&E staining of the Gon-fat from ASKO and WT mice under both diets conditions. Scale bar, 50 μm. H. The mean adipocyte area in the gonadal fat (square micrometers) of the HFD-fed mice. The values represent the means ± SEM. *p < 0.05; **p < 0.01.
