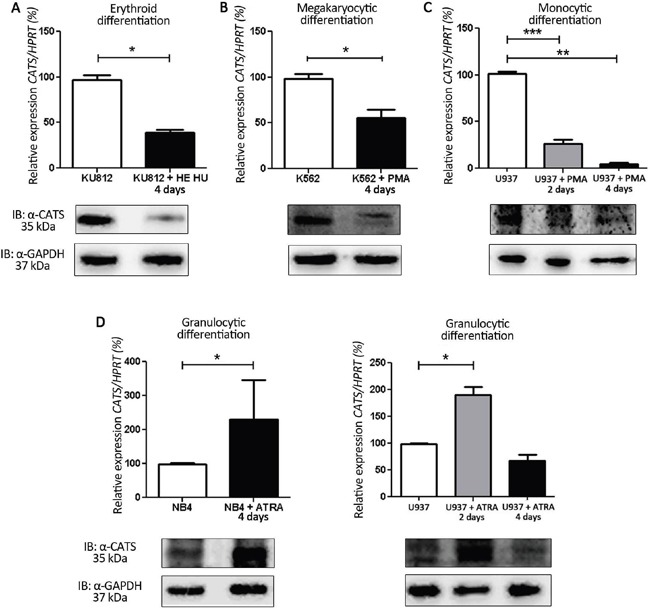
Figure 1. CATS expression during induced differentiation of leukemia cell lines.

Relative CATS expression at days 2 and/or 4 of differentiation. Upper panels: CATS mRNA levels normalized by HPRT. Lower panels: Representative Western blots of total cell extracts. Membrane was blotted against anti-CATS 2C4 and anti-GAPDH, used as a loading control. A. HE + HU induced erythroid differentiation of KU812 cells. Results are shown as mean ± SD of three independent experiments. B. PMA induced megakaryocytic differentiation of K562 cells. Results are shown as mean ± SD of three independent experiments. C. PMA induced monocytic differentiation of U937 cells. Results are shown as mean ± SD of four independent experiments. D. ATRA induced granulocytic differentiation of NB4 (left panel) and U937 cells (right panel). Results are shown as mean ± SD of six and four independent experiments, respectively. *p<0.05; **p<0.01 and ***p<0.001, Student's t test.
