
Figure 3. Forest plots of the overall outcome for disease-free survival (DFS).
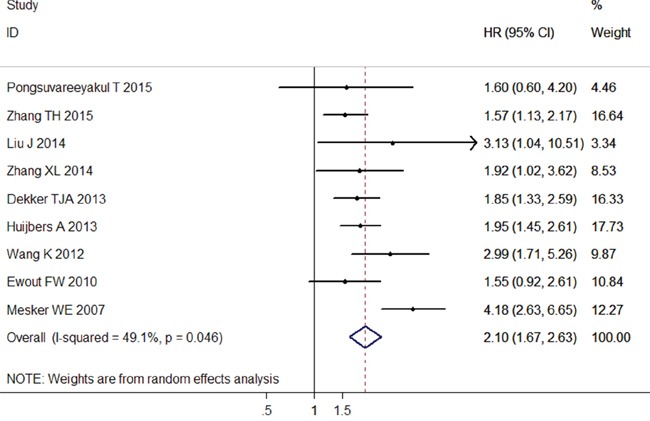
Hazard ratios (HRs) for each trial are represented by the squares, and the horizontal lines crossing the square stand for the 95% confidence intervals (CIs). The diamonds represent the estimated pooled effect of the overall outcome for DFS in all solid tumors. All P values are two-sided.