
Figure 4. Effect of individual studies on pooled hazard ratios (HR) for the relationship between tumor-stroma ratio (TSR) and prognosis of solid tumors.
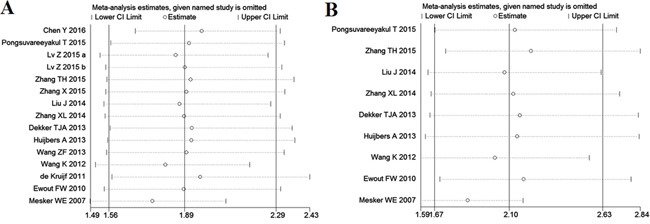
A. Sensitivity analysis for overall survival (OS). The vertical axis at 1.89 indicates the overall HR, and the two vertical axes at 1.56 and 2.29 indicate its 95% confidence interval (CI). Every hollow round indicates the pooled HR when the left study was omitted in a meta-analysis with a random model. The two ends of every broken line represent the respective 95% CI. B. Sensitivity analysis for disease-free survival (DFS). The vertical axis at 2.10 indicates the overall HR, and the two vertical axes at 1.67 and 2.63 indicate its 95% CI. Every hollow round indicates the pooled HR when the left study was omitted in a meta-analysis with a random model. The two ends of every broken line represent the respective 95% CI.