

Abstract
Background
Immunotherapy targeting the programmed death-1 (PD-1)/programmed death ligand-1 (PD-L1) checkpoint has shown the good outcomes in non-small cell lung cancer (NSCLC). We investigated PD-1 and PD-L1 protein expression and their correlation with tumor-infiltrating lymphocytes (TILs), and association with survival in NSCLC.
Material/Methods
The expression of PD-1 (NAT105, Cell Marque) and PD-L1 (28-8, Dako) protein was assessed in 55 NSCLC cell lines by immunohistochemistry (IHC). PD-1 (NAT105, Cell Marque) and PD-L1 (22C3, Dako) protein expression was evaluated by IHC, and TIL percentage was scored, in 139 surgically resected specimens from patients with NSCLC.
Results
PD-1 was not expressed on NSCLC cell lines. PD-L1 was expressed on 20 NSCLC cell lines (36.4%). A total of 60 patient samples (43.2%) were positive for PD-1 on the TILs, and 25 (18.0%) were positive for PD-L1 on tumor cells. High expression of PD-1 on tumor cells was significantly correlated with higher expression of PD-L1 (P=0.026) and a higher percentage of TILs (P<0.001). In the Cox regression model, the odds ratio for PD-1 was 2.828 (95% CI: 1.325–11.165; P=0.013) and 8.579 (95% CI: 4.148–22.676; P<0.001) when PD-L1 and TILs were positive. Patients whose tumor cells were PD-L1 negative had a tendency for longer relapse-free survival (RFS) than patients who were PD-L1 positive (1.85 years, 95% CI: 0.77–2.93 vs. 0.97 years, 95% CI: 0.71–1.23; P=0.054).
Conclusions
PD-1 was expressed on TILs in tumor tissues in NSCLC patients. PD-L1 was expressed on both TILs and tumor tissues. PD-1 expression was correlated with PD-L1 on tumor cells and TILs. Patients who were PD-L1 positive tended to experience progression after surgery.
MeSH Keywords: Carcinoma, Non-Small-Cell Lung; Immunity, Active; Tumor Escape
Background
Lung cancer is the leading cause of cancer death [1]. About 80% of lung cancers are non-small cell lung cancer (NSCLC) [2]. Chemotherapy is a standard first-line therapy for advanced stage disease and has a poor prognosis. Targeted therapy shows promise outcome for advanced NSCLC [3–5], but only patients who harbor driving mutations such as epidermal growth factor receptor (EGFR) can get benefit [6,7]. Moreover, acquired resistance of targeted therapy limits their ability to prolong survival [5]. Therefore, it remains urgent to find new, more effective therapeutic strategies for patients with advanced NSCLC.
Immunotherapy can reverse tumor immune escape [8]. The inhibition of checkpoints, such as cytotoxic T lymphocyte antigen-4 (CTLA-4), programmed death-1 (PD-1), and programmed death ligand-1 (PD-L1) [9–14], can activate T cells to eliminate tumors. Recently, anti-PD-1 or anti-PD-L1 antibodies have shown promising efficacy in different cancers [9,11,13–30]. Significantly, nivolumab and pembolizumab have been approved by the U.S. Food and Drug Administration (FDA) as second-line treatments for advanced NSCLC based on the CheckMate 017 and 057 and Keynote 010 trials [21,22,26,31,32].
In this study, we investigated PD-1 and PD-L1 protein expression in NSCLC cell lines and NSCLC patient tumor tissues by immunohistochemistry (IHC); analyzed the correlation between PD-1 and PD-L1, clinicopathological characteristics, and tumor-infiltrating lymphocytes (TILs); and conducted survival analysis of NSCLC patients.
Material and Methods
Patients
Primary tumor specimens were obtained from 139 NSCLC surgical patients at Department of Oncology and Radiotherapy, Medical University of Gdansk, Poland, from April 2008 to August 2010. The patients had not undergone radiation or chemotherapy before surgery. The surgical histology reports were reviewed, and the lymph node and lung cancer stages were categorized by the seventh edition International Association for the Study of Lung Cancer (IASLC) TNM staging system. The protocol was approved by the Shanghai Pulmonary Hospital, Tongji University (ethical number 15–235). All participants were competent to provide their consent.
Cell lines
A tissue micro array (TMA) containing 55 NSCLC cell lines was produced in the Hirsch Lab. Cell lines were grown in RPMI 1640 media with 10% fetal bovine serum. Cells were harvested, fixed overnight, mixed with 0.9% agarose, and then allowed to solidify at room temperature for at least 5 minutes. Each solidified agar pellet was gently placed in a cassette and submerged in 70% ethyl alcohol. The pellets were processed and embedded in paraffin blocks. Cores were taken from each cell line block to create the TMA, from which 4 mm sections were cut.
IHC for PD-1 by Ventana Benchmark XT®
Paraffin tissue sections were baked in a drying oven at 60°C for 1 hour. Heat-mediated antigen retrieval was performed in LAG-3 slides. All slides were labeled and put in a Benchmark XT® (Ventana Medical Systems, Inc.). After treating slides with standard cell conditioning 1 for 60 minutes (PD-1, predilute, NAT105, Cell marque) was applied, and the slides were incubated at 37°C for 1 hour. An UltraView DAB detection and amplification kit was used. Slides were counterstained with hematoxylin for 4 minutes and post-counterstained with bluing agent for 4 minutes. Slides were washed and then dehydrated in 70% to 100% reagent alcohol baths and then xylenes baths before applying coverslips.
IHC for PD-L1 by Dako
Paraffin tissue sections were baked in a drying oven at 60°C for 1 hour. Slides were loaded onto the Dako autostainer and treated with Proteinase K for 5 minutes. Primary antibody (PD-L1, 28-8, Dako) (PD-L1, 22C3, Dako) was applied by the Dako autostainer, and then the slides were incubated at room temperature for 30 minutes. After a wash in buffer, slides were incubated with a labeled polymer, HRP, at room temperature for 30 minutes. Next, DAB+ substrate-chromagen solution was applied for 10 minutes. Slides were counterstained with Dako automation hematoxylin for 5 minutes and post-counterstained with bluing agent for 1 minute. Slides were washed and then dehydrated in 3 washes of 70%, 95%, and 100% reagent alcohol and then 3 xylenes baths before applying coverslips.
Determination of PD-1, and PD-L1 IHC cutoff
All IHC results were checked independently by two pathologists. The cutoff for PD-1 was equal to or more than 8% staining [33]. The cutoff for PD-L1 on tumor cells (Dako, 22C3) (approved by FDA) was equal to or more than 50% staining. We use the same cutoff (50%) for PD-L1 (Dako, 28-8) in NSCLC cell lines.
Evaluation of TILs
We calculated the number of lymphocytes in each histospot, as described [34]. A score of 1+ (<30%) was low TILs; 2+ (30–60%) was moderate; and 3+ (>60%) was marked increase in TILs. Spots with discordance in TIL category between pathologists were reviewed jointly and a single consensus category was established [18].
Statistical analysis
We performed statistical analysis by using the SPSS statistical software package (version 17.0; SPSS, Inc.; Chicago, Illinois, USA). Chi-square tests were used to analyze the correlation between PD-1 and PD-L1 protein expression, clinicopathological variables, and TILs. The correlation between the expression of PD-1 and PD-L1 and TILs was analyzed by Spearman’s rank correlation. The odds ratios for positive PD-1 in TILs and PD-L1 in tumor cell expression were calculated by logistic regression model for factors including age, gender, smoking history, pathology, lung cancer stage, grade, PD-L1 expression, and TILs. The survival curves were estimated by the Kaplan-Meier method. All statistics were 2-sided and statistical significance was defined as P<0.05.
Results
PD-1 and PD-L1 on NSCLC cell lines
PD-1 was not expressed on any of the 55 NSCLC cell lines. PD-L1 was expressed on 20 NSCLC cell lines (36.4%) (Figure 1).
Figure 1.

PD-1 and PD-L1 in NSCLC cell lines. (A) PD-1 negative expression on a NSCLC cell line (H1435) (20×); (B) PD-L1 negative expression on a NSCLC cell line (H520) (20×); (C) PD-L1 positive expression on a NSCLC cell line (H2444) (20×).
Patient characteristics
NSCLC patient tissues were obtained from 139 patients undergoing surgery at the Department of Oncology and Radiotherapy, Medical University of Gdansk, Poland, from April 2008 to August 2010. Among them, 109 (78.4%) were male and 30 (21.6%) were female. The mean age was 64 years old. Six (4.3%) were never smokers. A total of 58 patients (43.7%) were stage I, 35 (25.2%) were stage II, 39 (28.1%) were stage III, and 7 (5.0%) were stage IV. Forty patients (28.8%) had adenocarcinoma, and 81 (52.3%) had squamous cell carcinoma (SCC) (Table 1).
Table 1.
Patient Characteristics (n=139).
| Characteristic | Total | Characteristic | Total |
|---|---|---|---|
| Gender, n (%) | M stage, n (%) | ||
| Male | 109 (78.4%) | 0 | 132 (95.0%) |
| Female | 30 (21.6%) | 1 | 7 (5.0%) |
| Age, median | 64 | Lung cancer staging, n (%) | |
| <70, n (%) | 105 (75.5%) | I | 58 (41.7%) |
| ≥70, n (%) | 34 (24.5%) | II | 35 (25.2%) |
| Smoking status, n (%) | III | 39 (28.1%) | |
| Non-smoker | 6 (4.3%) | IV | 7 (5.0%) |
| Smoker | 133 (95.7%) | Pathology, n (%) | |
| Surgery, n (%) | SCC | 81 (52.3%) | |
| Wedge | 2 (1.4%) | Adenocarcinoma | 40 (28.8%) |
| Segmentectomy | 3 (2.2%) | Large cell carcinoma | 4 (2.9%) |
| Lobectomy | 73 (52.5%) | NSCLC NOS/Mixed | 12 (8.6%) |
| Bilobectomy | 8 (5.8%) | NSCLC others | 2 (1.4%) |
| Pneumonectomy | 47 (33.8%) | Grade, n (%) | |
| Sleeve lobectomy | 6 (4.3%) | G1 | 16 (11.5%) |
| T stage, n (%) | G2 | 57 (41.0%) | |
| 1 | 25 (18.0%) | G3 | 47 (33.8%) |
| 2 | 80 (57.6%) | Unknown | 19 (13.7%) |
| 3 | 24 (17.3%) | Surgical margin, n (%) | |
| 4 | 10 (7.2%) | Complete | 113 (81.3%) |
| N stage, n (%) | Macroscopic positive | 11 (7.9%) | |
| 0 | 75 (54.0%) | Unknown | 15 (10.8%) |
| 1 | 31 (22.3%) | ||
| 2 | 33 (23.7%) |
Characterization of PD-1, PD-L1, and TILs in NSCLC and their association with clinicopathological factors
Sixty samples (43.2%) stained positive for PD-1 on the TILs, and 25 (18.0%) had positive PD-L1 expression on tumor cells (Figure 2). Neither the expression of PD-1 on TILs nor that of PD-L1 on tumor cells had significant correlation with clinicopathological factors.
Figure 2.

IHC staining for PD-1, and PD-L1 (20×). (A) IHC positivity for PD-1 on TILS; (B) IHC negative for PD-1 on TILS; (C) IHC positivity for PD-L1 on tumor cells; (D) IHC negative for PD-L1 on tumor cells.
Relationship between checkpoints and TIL abundance
There was a correlation between the percentage of TILs and PD-1 (R2=0.212, y=1.274x+0.030, P<0.001) (Figure 3). We also performed correlation analysis between PD-L1 and TIL percentage (R2=0.005, y=12.441x+1.568; P=0.015), and PD-1 and PD-L1 (R2=0.052, y=12.970x+0.125; P<0.001).
Figure 3.
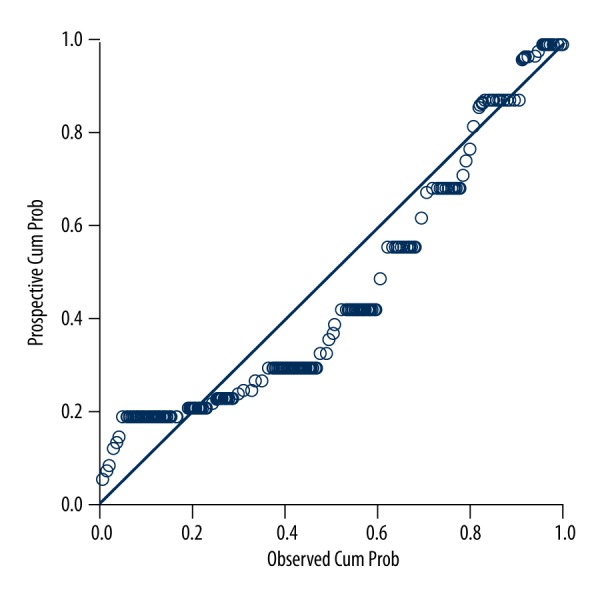
P-P plot for the correlation between PD-1 and PD-L1.
High expression of PD-L1 on tumor cells was significantly correlated with higher expression of PD-1 (P=0.026). The same relationship was also found between PD-1 and TIL expression (P<0.001) (Table 2).
Table 2.
Relationships between different checkpoints.
| Characteristic | PD-L1 expression on tumor cells, n (%) | TILs, n (%) | ||||
|---|---|---|---|---|---|---|
| <50% | ≥50% | P | <30% | ≥30% | P | |
| PD-1 expression on TILs, n(%) | ||||||
| <8% | 70 (88.6%) | 9 (11.4%) | 0.026 | 52 (65.8%) | 27 (34.2%) | <0.001 |
| ≥8% | 44 (73.3%) | 16 (26.7%) | 11 (18.3%) | 49 (81.7%) | ||
| PD-L1 expression on tumor cells, n (%) | ||||||
| <50% | 52 (45.6%) | 62 (54.4%) | 1.000 | |||
| ≥50% | 11 (44.0%) | 14 (56.0%) | ||||
Univariate and multivariate logistic analysis for predicting PD-1 and PD-L1 expression
With the Cox regression model, after adjusting for age, gender, smoking history, pathology, lung cancer stage, grade, PD-L1 expression, and TILs, the odds ratio for PD-1 was 2.828 (95% CI: 1.325–11.165; P =0.013) and 8.579 (95% CI: 4.148–22.676; P<0.001) when PD-L1 and TILs are positive (Tables 3, 4).
Table 3.
Univariate and multivariate analysis for prediction of PD-1 expression in all patients.
| Variables | Univariate | Multivariate | ||||
|---|---|---|---|---|---|---|
| Odds Ratio | 95% CI | P | Odds Ratio | 95% CI | P | |
| Age (<70 vs. ≥70) | 1.442 | 0.663–3.135 | 0.356 | |||
| Gender (Female vs. Male) | 0.592 | 0.263–1.335 | 0.207 | |||
| Smoking status (Non-smoker vs. Smoker) | 1.547 | 0.274–8.738 | 0.622 | |||
| Pathology (AD vs. non-AD) | 0.720 | 0.339–1.528 | 0.392 | |||
| Stage (I–II vs. III–IV) | 1.019 | 0.500–2.079 | 0.959 | |||
| Grade (1 vs. 2–3) | 0.934 | 0.547–1,595 | 0.802 | |||
| PD-L1 on tumor cells (negative vs. positive) | 2.828 | 1.150–6.953 | 0.023 | 3.846 | 1.325–11.165 | 0.013 |
| TILs (<30% vs. ≥30%) | 8.579 | 3.846–19.138 | <0.001 | 9.698 | 4.148–22.676 | <0.001 |
Table 4.
Univariate and multivariate analysis for prediction of PD-L1 expression in all patients.
| Variables | Univariate | Multivariate | ||||
|---|---|---|---|---|---|---|
| Odds Ratio | 95% CI | P | Odds Ratio | 95% CI | P | |
| Age (<70 vs. ≥70) | 0.970 | 0.353–2.669 | 0.953 | |||
| Gender (Female vs. Male) | 0.650 | 0.243–1.741 | 0.392 | |||
| Smoking status (Non-smoker vs. Smoker) | 0.418 | 0.072–2.421 | 0.330 | |||
| Pathology (AD vs. non-AD) | 0.564 | 0.196–1.625 | 0.289 | |||
| Stage (I–II vs. III–IV) | 1.444 | 0.592–3.526 | 0.419 | |||
| Grade (1 vs. 2–3) | 1.051 | 0.500–2.212 | 0.895 | |||
| PD-1 on tumor cells (negative vs. positive) | 2.828 | 1.150–6.953 | 0.023 | 2.828 | 1.150–6.953 | 0.023 |
| TILs (<30% vs. ≥30%) | 1.067 | 0.447–2.552 | 0.883 | |||
Association between PD-1 and PD-L1 and RFS and OS in NSCLC patients
Relapse-free survival (RFS) and overall survival (OS) were not significantly different in PD-1 positive patients and PD-1 negative patients (1.470 years, 95% CI: 0.58–2.36 vs. 1.760 years, 95% CI: 1.28–2.24; P=0.881 for RFS) (2.29 years, 95% CI 1.04–3.54 vs. 2.97 years, 95% CI 1.36–4.58; P=0.558 for OS). Likewise, PD-L1 status did not significantly affect OS (2.96 years, 95% CI: 2.25–3.67 vs. 1.29 years, 95% CI 0.62–1.96; P=0.290). We found that patients with PD-L1-negative tumor cells had longer RFS than patients who were PD-L1 positive (1.85 years, 95% CI: 0.77–2.93 vs. 0.97 years, 95% CI: 0.71–1.23; P=0.054) (Figure 4).
Figure 4.

RFS, OS by PD-1 and PD-L1. (A) RFS by PD-1; (B) OS by PD-1; (C) RFS by PD-L1; (D) OS by PD-L1.
Discussion
In this study, we analyzed PD-1 and PD-L1 in NSCLC cell lines and patient tumor tissues as well as described the correlations between TILs and survival.
PD-1 and PD-L1 have been described in several malignancies, including ovarian cancer [35], lung cancer [33,36], breast cancer [34], etc. In our study, PD-L1 was expressed on 36.4% of NSCLC cell lines. In tumor tissues, PD-1 was expressed on TILs, and PD-L1 was detected on both tumor cells and TILs. Among the samples, 43.2% stained positive for PD-1 on the TILs, and 18.0% stained positive for PD-L1 on tumor cells. PD-1 on TILs was significant correlated with PD-L1 expression on tumor cells. It was reported that there was no relationship between PD-L1 and clinicopathological factors in ovarian cancer [35]. In addition, PD-L1 did not correlate to clinical factors in lung cancer patients [33]. In our study, we also analyzed the correlation between PD-1 and PD-L1 and found there was no significant correlation between patient clinicopathological characteristics and PD-1 and PD-L1.
TILs were significant prognostic factors in cancer [35,37,38]. CD8 T cell infiltration was an independent prognostic factor indicating favorable outcome in esophageal carcinomas [37]. In human renal cell carcinoma, the activation of CD8 T cells could reflect effective antitumor immunity [38]. PD-L1 on tumor cells was correlated with TILs, which may down-regulate antitumor immune responses in NSCLC [33]. Our results showed that PD-1 expression, not PD-L1, was correlated with TILs in NSCLC, which was consistent with the other results of the past.
The prognostic value of PD-1 and PD-L1 in various cancers has also been discussed. PD-L1 on tumor cells correlates with poor clinical prognosis in ovarian cancer, renal cancer, lung cancer, and breast cancer [34,35,39,40]. In ovarian cancers, patients with lower expression of PD-L1 had a better outcome [35]. PD-L1 negatively regulated antitumor immunity, and was independently associated with poor outcome in clear cell renal cell carcinoma. Tumor PD-L1-positive clear cell renal cell carcinoma patients had a risk of progression and mortality [39]. High PD-L1 expression in NSCLC was an independent predictor of poor prognosis [41]. However, the prognostic function of PD-L1 still remains controversial. Cooper et al. revealed that high PD-L1 expression is independently associated with longer OS [42]. In our study, there was no significant difference in OS between PD-L1-positive and PD-L1-negative patients. PD-L1-positive NSCLC patients tended to have lower RFS after surgery.
The limits of this study were that it was retrospective research and had a relatively small number of patients. We are going to expand our samples and conduct a larger prospective study. As there are many ongoing PD-1 or PD-L1 clinical trials, we will add the treatment outcomes in our further study.
Conclusions
In this study, we analyzed the relationship between PD-1 and PD-L1 expression, clinical characteristics, and TILs. Furthermore, we also investigated the association between PD-1 and PD-L1 expression and postoperative survival. We have demonstrated the expression of PD-1 and PD-L1 in surgically resected specimens of NSCLC. PD-1 expression on TILs was correlated with PD-L1 and TIL percentage. Patients with PD-L1-positive NSCLC tended to have progression after surgery.
Footnotes
Conflicts of interest
There is no conflict of interest.
Source of support: This project was supported by the IASLC Young Investigator Award, the Pia and Fred R. Hirsch Endowed Chair at the University of Colorado, and the Young Program of Shanghai Health Bureau
References
- 1.Chen W, Zheng R, Zhang S, et al. Lung cancer incidence and mortality in China, 2009. Thoracic Cancer. 2013;4(2):102–8. doi: 10.1111/1759-7714.12025. [DOI] [PubMed] [Google Scholar]
- 2.Walker EB, Haley D, Miller W, et al. gp100(209-2M) peptide immunization of human lymphocyte antigen-A2+ stage I–III melanoma patients induces significant increase in antigen-specific effector and long-term memory CD8+ T cells. Clin Cancer Res. 2004;10(2):668–80. doi: 10.1158/1078-0432.ccr-0095-03. [DOI] [PubMed] [Google Scholar]
- 3.Giaccone G, Gallegos Ruiz M, Le Chevalier T, et al. Erlotinib for frontline treatment of advanced non-small cell lung cancer: A phase II study. Clin Cancer Res. 2006;12(20 Pt 1):6049–55. doi: 10.1158/1078-0432.CCR-06-0260. [DOI] [PubMed] [Google Scholar]
- 4.Cameron L, Solomon B. New treatment options for ALK-rearranged non-small cell lung cancer. Curr Treat Options Oncol. 2015;16(10):49. doi: 10.1007/s11864-015-0367-z. [DOI] [PubMed] [Google Scholar]
- 5.Zhou C, Wu YL, Chen G, et al. Final overall survival results from a randomised, phase III study of erlotinib versus chemotherapy as first-line treatment of EGFR mutation-positive advanced non-small-cell lung cancer (OPTIMAL, CTONG-0802) Ann Oncol. 2015;26(9):1877–83. doi: 10.1093/annonc/mdv276. [DOI] [PubMed] [Google Scholar]
- 6.He Y, Li S, Ren S, Cai W, et al. Impact of family history of cancer on the incidence of mutation in epidermal growth factor receptor gene in non-small cell lung cancer patients. Lung Cancer. 2013;81(2):162–66. doi: 10.1016/j.lungcan.2013.05.004. [DOI] [PubMed] [Google Scholar]
- 7.He Y, Wang Y, Boyle T, et al. Hepatic metastases is associated with poor efficacy of erlotinib as 2nd/3rd line therapy in patients with lung adenocarcinoma. Med Sci Monit. 2016;22:276–83. doi: 10.12659/MSM.896607. [DOI] [PMC free article] [PubMed] [Google Scholar]
- 8.Couzin-Frankel J. Breakthrough of the year 2013. Cancer immunotherapy. Science. 2013;342(6165):1432–33. doi: 10.1126/science.342.6165.1432. [DOI] [PubMed] [Google Scholar]
- 9.Dong H, Zhu G, Tamada K, Chen L. B7-H1, a third member of the B7 family, co-stimulates T-cell proliferation and interleukin-10 secretion. Nat Med. 1999;5(12):1365–69. doi: 10.1038/70932. [DOI] [PubMed] [Google Scholar]
- 10.Dong H, Strome SE, Salomao DR, et al. Tumor-associated B7-H1 promotes T-cell apoptosis: a potential mechanism of immune evasion. Nat Med. 2002;8(8):793–800. doi: 10.1038/nm730. [DOI] [PubMed] [Google Scholar]
- 11.Sharpe AH, Wherry EJ, Ahmed R, Freeman GJ. The function of programmed cell death 1 and its ligands in regulating autoimmunity and infection. Nat Immunol. 2007;8(3):239–45. doi: 10.1038/ni1443. [DOI] [PubMed] [Google Scholar]
- 12.Brahmer JR, Drake CG, Wollner I, et al. Phase I study of single-agent anti-programmed death-1 (MDX-1106) in refractory solid tumors: Safety, clinical activity, pharmacodynamics, and immunologic correlates. J Clin Oncol. 2010;28(19):3167–75. doi: 10.1200/JCO.2009.26.7609. [DOI] [PMC free article] [PubMed] [Google Scholar]
- 13.Brahmer JR, Tykodi SS, Chow LQ, et al. Safety and activity of anti-PD-L1 antibody in patients with advanced cancer. N Engl J Med. 2012;366(26):2455–65. doi: 10.1056/NEJMoa1200694. [DOI] [PMC free article] [PubMed] [Google Scholar]
- 14.Topalian SL, Hodi FS, Brahmer JR, et al. Safety, activity, and immune correlates of anti-PD-1 antibody in cancer. N Engl J Med. 2012;366(26):2443–54. doi: 10.1056/NEJMoa1200690. [DOI] [PMC free article] [PubMed] [Google Scholar]
- 15.Hamid O, Robert C, Daud A, et al. Safety and tumor responses with lambrolizumab (anti-PD-1) in melanoma. N Engl J Med. 2013;369(2):134–44. doi: 10.1056/NEJMoa1305133. [DOI] [PMC free article] [PubMed] [Google Scholar]
- 16.Herbst RS, Soria JC, Kowanetz M, et al. Predictive correlates of response to the anti-PD-L1 antibody MPDL3280A in cancer patients. Nature. 2014;515(7528):563–67. doi: 10.1038/nature14011. [DOI] [PMC free article] [PubMed] [Google Scholar]
- 17.Powles T, Eder JP, Fine GD, et al. MPDL3280A (anti-PD-L1) treatment leads to clinical activity in metastatic bladder cancer. Nature. 2014;515(7528):558–62. doi: 10.1038/nature13904. [DOI] [PubMed] [Google Scholar]
- 18.Schalper KA, Velcheti V, Carvajal D, et al. In situ tumor PD-L1 mRNA expression is associated with increased TILs and better outcome in breast carcinomas. Clin Cancer Res. 2014;20(10):2773–82. doi: 10.1158/1078-0432.CCR-13-2702. [DOI] [PubMed] [Google Scholar]
- 19.Tumeh PC, Harview CL, Yearley JH, et al. PD-1 blockade induces responses by inhibiting adaptive immune resistance. Nature. 2014;515(7528):568–71. doi: 10.1038/nature13954. [DOI] [PMC free article] [PubMed] [Google Scholar]
- 20.Asaoka Y, Ijichi H, Koike K. PD-1 blockade in tumors with mismatch-repair deficiency. N Engl J Med. 2015;373(20):1979. doi: 10.1056/NEJMc1510353. [DOI] [PubMed] [Google Scholar]
- 21.Borghaei H, Paz-Ares L, Horn L, et al. Nivolumab versus docetaxel in advanced nonsquamous non-small-cell lung cancer. N Engl J Med. 2015;373(17):1627–39. doi: 10.1056/NEJMoa1507643. [DOI] [PMC free article] [PubMed] [Google Scholar]
- 22.Brahmer J, Reckamp KL, Baas P, et al. Nivolumab versus docetaxel in advanced squamous-cell non-small-cell lung cancer. N Engl J Med. 2015;373(2):123–35. doi: 10.1056/NEJMoa1504627. [DOI] [PMC free article] [PubMed] [Google Scholar]
- 23.Diaz LA, Jr, Le DT. PD-1 blockade in tumors with mismatch-repair deficiency. N Engl J Med. 2015;373(20):1979. doi: 10.1056/NEJMc1510353. [DOI] [PubMed] [Google Scholar]
- 24.Errico A. Melanoma: CheckMate 067 – frontline nivolumab improves PFS alone or in combination with ipilimumab. Nat Rev Clin Oncol. 2015;12(8):435. doi: 10.1038/nrclinonc.2015.112. [DOI] [PubMed] [Google Scholar]
- 25.Garon EB, Rizvi NA, Hui R, et al. Pembrolizumab for the treatment of non-small-cell lung cancer. N Engl J Med. 2015;372(21):2018–28. doi: 10.1056/NEJMoa1501824. [DOI] [PubMed] [Google Scholar]
- 26.Herbst RS, Baas P, Kim DW, et al. Pembrolizumab versus docetaxel for previously treated, PD-L1-positive, advanced non-small-cell lung cancer (KEYNOTE-010): A randomised controlled trial. Lancet. 2016;387(10027):1540–50. doi: 10.1016/S0140-6736(15)01281-7. [DOI] [PubMed] [Google Scholar]
- 27.Larkin J, Chiarion-Sileni V, Gonzalez R, et al. Combined nivolumab and ipilimumab or monotherapy in untreated melanoma. N Engl J Med. 2015;373(1):23–34. doi: 10.1056/NEJMoa1504030. [DOI] [PMC free article] [PubMed] [Google Scholar]
- 28.Larkin J, Hodi FS, Wolchok JD. Combined nivolumab and ipilimumab or monotherapy in untreated melanoma. N Engl J Med. 2015;373(13):1270–71. doi: 10.1056/NEJMc1509660. [DOI] [PubMed] [Google Scholar]
- 29.Le DT, Uram JN, Wang H, et al. PD-1 blockade in tumors with mismatch-repair deficiency. N Engl J Med. 2015;372(26):2509–20. doi: 10.1056/NEJMoa1500596. [DOI] [PMC free article] [PubMed] [Google Scholar]
- 30.Valsecchi ME. Combined nivolumab and ipilimumab or monotherapy in untreated melanoma. N Engl J Med. 2015;373(13):1270. doi: 10.1056/NEJMc1509660. [DOI] [PubMed] [Google Scholar]
- 31.Thoma C. CheckMate for advanced-stage ccRCC? Nivolumab and cabozantinib aMETEORate poor survival. Nat Rev Clin Oncol. 2015;12(12):742. doi: 10.1038/nrclinonc.2015.207. [DOI] [PubMed] [Google Scholar]
- 32.Hutchinson L. Lung cancer: Squiring immunotherapy to CheckMate. Nat Rev Clin Oncol. 2015;12(8):436. doi: 10.1038/nrclinonc.2015.110. [DOI] [PubMed] [Google Scholar]
- 33.Konishi J, Yamazaki K, Azuma M, et al. B7-H1 expression on non-small cell lung cancer cells and its relationship with tumor-infiltrating lymphocytes and their PD-1 expression. Clin Cancer Res. 2004;10(15):5094–100. doi: 10.1158/1078-0432.CCR-04-0428. [DOI] [PubMed] [Google Scholar]
- 34.Ghebeh H, Mohammed S, Al-Omair A, et al. The B7-H1 (PD-L1) T lymphocyte-inhibitory molecule is expressed in breast cancer patients with infiltrating ductal carcinoma: Correlation with important high-risk prognostic factors. Neoplasia. 2006;8(3):190–98. doi: 10.1593/neo.05733. [DOI] [PMC free article] [PubMed] [Google Scholar]
- 35.Hamanishi J, Mandai M, Iwasaki M, et al. Programmed cell death 1 ligand 1 and tumor-infiltrating CD8+ T lymphocytes are prognostic factors of human ovarian cancer. Proc Natl Acad Sci USA. 2007;104(9):3360–65. doi: 10.1073/pnas.0611533104. [DOI] [PMC free article] [PubMed] [Google Scholar]
- 36.Gettinger S, Herbst RS. B7-H1/PD-1 blockade therapy in non-small cell lung cancer: Current status and future direction. Cancer J. 2014;20(4):281–89. doi: 10.1097/PPO.0000000000000063. [DOI] [PubMed] [Google Scholar]
- 37.Schumacher K, Haensch W, Roefzaad C, Schlag PM. Prognostic significance of activated CD8(+) T cell infiltrations within esophageal carcinomas. Cancer Res. 2001;61(10):3932–36. [PubMed] [Google Scholar]
- 38.Nakano O, Sato M, Naito Y, et al. Proliferative activity of intratumoral CD8(+) T-lymphocytes as a prognostic factor in human renal cell carcinoma: clinicopathologic demonstration of antitumor immunity. Cancer Res. 2001;61(13):5132–36. [PubMed] [Google Scholar]
- 39.Thompson RH, Kuntz SM, Leibovich BC, et al. Tumor B7-H1 is associated with poor prognosis in renal cell carcinoma patients with long-term follow-up. Cancer Res. 2006;66(7):3381–85. doi: 10.1158/0008-5472.CAN-05-4303. [DOI] [PubMed] [Google Scholar]
- 40.Yang CY, Lin MW, Chang YL, et al. Programmed cell death-ligand 1 expression in surgically resected stage I pulmonary adenocarcinoma and its correlation with driver mutations and clinical outcomes. Eur J Cancer. 2014;50(7):1361–69. doi: 10.1016/j.ejca.2014.01.018. [DOI] [PubMed] [Google Scholar]
- 41.Mu CY, Huang JA, Chen Y, et al. High expression of PD-L1 in lung cancer may contribute to poor prognosis and tumor cells immune escape through suppressing tumor infiltrating dendritic cells maturation. Med Oncol. 2011;28(3):682–88. doi: 10.1007/s12032-010-9515-2. [DOI] [PubMed] [Google Scholar]
- 42.Cooper WA, Tran T, Vilain RE, et al. PD-L1 expression is a favorable prognostic factor in early stage non-small cell carcinoma. Lung Cancer. 2015;89(2):181–88. doi: 10.1016/j.lungcan.2015.05.007. [DOI] [PubMed] [Google Scholar]