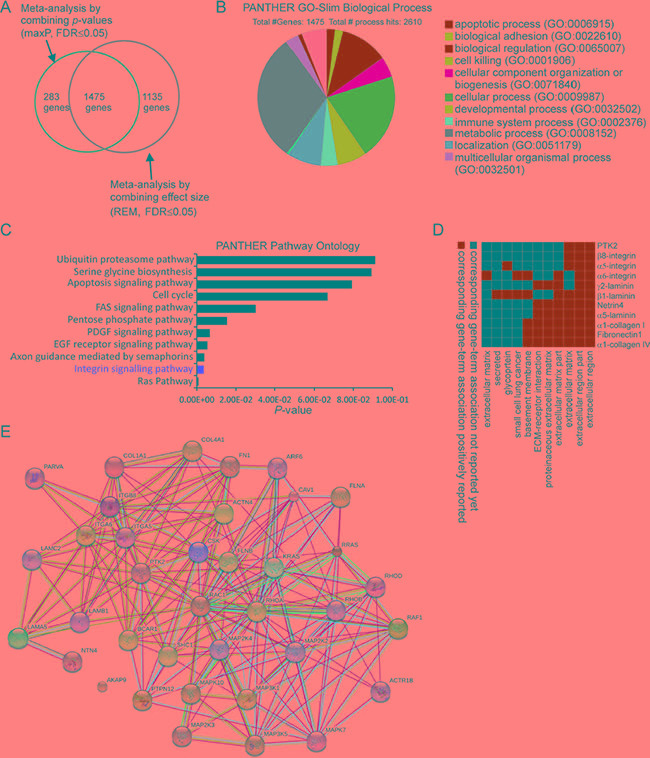
Figure 4. Comparative meta-analysis of differentially expressed genes between PRCC1 and PRCC2 samples.

(A) A Venn Diagram showing the overlap of DE genes detected by two meta-analyses, one combining the p-values (maxP) and another combining the effect sizes (REM). (B) PANTHER GO-Slim biological process analysis revealing 11 major functional categories associated with the 1475 DE genes. Biological adhesion is one of the major categories. (C) PANTHER pathway ontology analysis highlighting integrin pathway as the second-most enriched pathway. (D) A functional annotation clustering 2D report highlighting the cell adhesion related pathways associated with the integrin-related DE genes from the meta-analysis. (E) Protein-protein functional interaction network including 37 integrin pathway-associated genes extracted from the meta-analysis.
