
Figure 4. H2S slow-releasing by NEs.
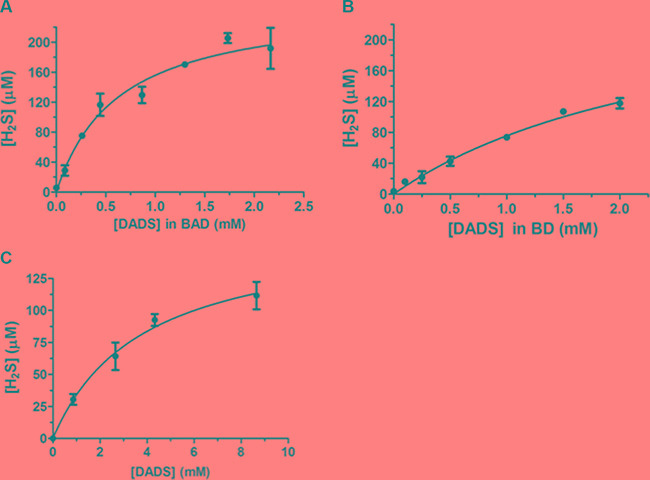
H2S-release detected by methylene blue assay at different concentrations of (A) BAD-NEs, (B) BD-NEs and (C) DADS in DMSO, in the presence of 1 mM DTT in 50 mM Tris-HCl, pH 7.4 buffer. The H2S concentrations are calculated using a calibration curve obtained at different concentrations of Na2S (see also Supplementary Figure S2). Each bar represents the ± SD of three experiments.