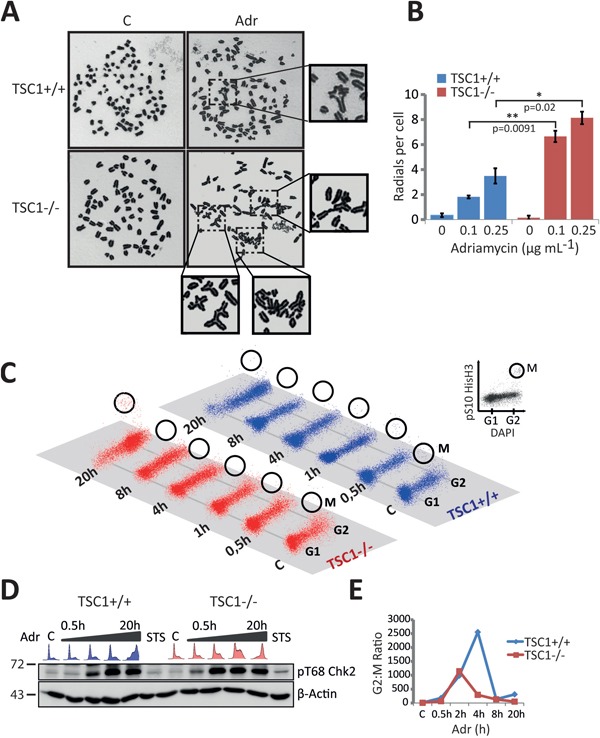
Figure 6. Leaky G2-M checkpoint and catastrophic cell death in TSC1-/- MEFs.

A-B. Representative metaphase chromosome spreads and quantification indicating frequency of aberrations following low-dose Adriamycin treatment per 100 spreads from two independent experiments. C. Mitotic entry monitored at various time-points after 0.5 μg/ml Adriamycin treatment in TSC1+/+ and TSC1-/- MEFs, by DAPI/pSer10–HisH3 flow cytometry to distinguish between G2 and M phase cells. D. Western blot showing Chk2 activation, indicating a proficient ATM-Chk2-mediated G2-M checkpoint after Adriamycin damage. E. Percentage ratios of G2 to M phase cells as a measure of the fidelity of G2/M checkpoint, plotted as the geometric mean of 2 experiments; the lower ratios in TSC1-/- MEFs suggest a checkpoint maintenance defect, eventually permitting damage-prone mitotic entry. Representative flow cytometry gating strategy is presented in Supplementary Figure S8. Raw data are provided in Supplementary Table S1.
