Abstract
As we are moving into the post genome-sequencing era, various high-throughput experimental techniques have been developed to characterize biological systems on the genomic scale. Discovering new biological knowledge from the high-throughput biological data is a major challenge to bioinformatics today. To address this challenge, we developed a Bayesian statistical method together with Boltzmann machine and simulated annealing for protein functional annotation in the yeast Saccharomyces cerevisiae through integrating various high-throughput biological data, including yeast two-hybrid data, protein complexes and microarray gene expression profiles. In our approach, we quantified the relationship between functional similarity and high-throughput data, and coded the relationship into ‘functional linkage graph’, where each node represents one protein and the weight of each edge is characterized by the Bayesian probability of function similarity between two proteins. We also integrated the evolution information and protein subcellular localization information into the prediction. Based on our method, 1802 out of 2280 unannotated proteins in yeast were assigned functions systematically.
INTRODUCTION
An immediate challenge of the post-genomic era is to assign biological functions to all the proteins encoded by the genome. Despite all the efforts, only 50–60% of genes have been annotated in most organisms (1). This leaves bioinformatics with the opportunity and challenge of predicting functions for unannotated proteins, by developing effective and automated methods. Several approaches have been developed for predicting protein function based on sequence similarity, such as FASTA (2) and PSI-BLAST (3). Another method to predict function is based on sequence fusion information, e.g. the Rosetta Stone approach (4). Function can also be inferred through the phylogenetic profiling of proteins in multiple genomes (5). With ever-increasing flow of biological data generated by the high-throughput methods, such as yeast two-hybrid systems (6), protein complexes identification by mass spectrometry (7,8) and microarray gene expression profiles (9,10), some computational approaches have been developed to use these data for gene function prediction. Cluster analysis of the gene-expression profiles is a common approach for predicting functions based on the assumption that genes with similar functions are likely to be co-expressed (9,10). Using protein–protein interaction data to assign functions to novel proteins is another approach. Proteins often interact with one another in an interaction network to achieve a common objective. It is therefore possible to infer the functions of proteins based on the functions of their interaction partners, also known as ‘guilt by association’ (11). Schwikowski et al. (11) applied a neighbor-counting method for predicting the function. They assigned function to an unknown protein based on the frequencies of its neighbors having certain functions. The method was improved by Hishigaki et al. (12), who used χ2-statistics. Both these approaches give equal significance to all the functions contributed by the protein neighbors in the interaction network. Other function prediction methods using high-throughput data include machine-learning and data-mining approaches (13) and Markov random fields (14,15). MAGIC (Multisource Association of Genes by Integration of Clusters) also combined heterogeneous data for function assignment (16).
One major challenge for protein function prediction is that, the errors in the high-throughput data have not been handled well and the rich information contained in various high-throughput data has not been fully utilized, given the complexity and the quality of high-throughput data (17). A possible solution for this problem is Bayesian probabilistic model (18), which could lead to a coherent function prediction and reduce the effect of noise by combining information from diverse data sources within a common probabilistic framework, and naturally weighs each information source according to the conditional probability relationship among information sources. Another major limitation of current function prediction methods based on ‘majority rule’ assignment (11) is that the global properties of interaction network are underutilized, since current methods often do not take into account the links among proteins of unknown functions. Recently, to address this challenge, Vazquez et al. (19) proposed a global method to assign protein functions based on protein interaction network, by minimizing the number of protein interactions among different functional categories. Karaoz et al. (20) mapped gene expression and protein interaction data into Hopfield network to make function predictions for >200 proteins with unknown functions.
To further overcome these limitations, we developed a computational framework for systematic protein function annotation on the genomic scale. Our current study focuses on the yeast Saccharomyces cerevisiae (Baker's yeast), where rich high-throughput data are available. Comparing with current methods, our method is distinctive in the following aspects: (i) unannotated proteins can be assigned to various function categories of Gene Ontology (GO) biological processes (21) with Reliability scores. This is in contrast to most other prediction methods, where proteins were predicted as yes or no without confidence assessment to a limited number of function categories [e.g. MIPS (22), which are less detailed than GO]. (ii) We quantitatively measured functional relationship between genes underlying each type of high-throughput data (protein binary interactions, protein complexes and microarray gene expression profiles) and coded the relationship into ‘functional linkage graph’ (interaction network), where each node represents one protein and the weight of each edge is characterized by the Bayesian probability of function similarity between two proteins. (iii) We also integrated evolutionary information and protein subcellular localization information into function annotation. (iv) We developed a novel global function prediction method based on Boltzmann machine, for protein function annotation with integration of functional linkage evidences from different types of high-throughput data. We may predict the function of an unannotated gene, even if none of its neighbors in the network has known function. Our method is robust for combining and propagating information systematically across the entire network based on the global optimization of the network configuration.
DATA SOURCES
The high-throughput data including microarray data, protein binary interaction data and protein complex data were coded into an interaction network, which can be viewed as a weighted non-directed graph Gp (D) = (Vp, Ep) with the vertex set Vp = {di|di ∈ D}; and the edge set Ep = {(di, dj)|for di, dj ∈ D and i ≠ j}. Each vertex represents one protein and each edge represents one measured connection between the two linked proteins from different types of high-throughput data, which are denoted as correlation in gene expression profiles with Pearson correlation coefficient r, the protein binary interaction or protein complex interaction.
Protein–protein binary interaction data
The protein–protein interaction data from high-throughput yeast two-hybrid interaction experiments were from Uetz et al. (23) and Ito et al. (24), together with 5075 unique interactions among 3567 proteins. We combined the yeast two-hybrid data with the known protein–protein interaction data in the MIPS database (http://mips.gsf.de/proj/yeast/CYGD/db/). In total, 6516 unique binary interactions among 3989 proteins were used in this study.
Protein complexes
The protein complex data were obtained from Gavin et al. (7) and Ho et al. (8). In the protein complexes, although it is unclear which proteins are in physical contact, the protein complex data contain rich information about functional relationship among involved proteins. For simplicity, we assigned binary interactions between any two proteins participating in a complex. Thus in general, if there are n proteins in a protein complex, we add n * (n−1)/2 binary interactions. This yields 49 313 edges to the interaction network.
Microarray gene expression data
The gene-express profiles of microarray data were from Gasch et al. (25), which included 174 experimental conditions for all the genes in yeast. For each experiment, if there was a missing point, we substituted its gene expression ratio to the reference state with the average ratio of all the genes under that specific experimental condition. A Pearson correlation coefficient was calculated for each possible gene pairs to quantify the correlation between the gene pairs.
Subcellular localization data
We used the genome-scale protein subcellular localization data obtained from green fluorescent protein (GFP)-tagged yeast strain (26). The 4156 proteins were assigned into 22 distinct subcellular localization categories. The data are available at http://yeastgfp.ucsf.edu/.
Genomic sequence data
We downloaded the genomic sequence and the protein annotation data of five species at public databases, including budding yeast S.cerevisiae (http://genome-www.stanford.edu/Saccharomyces/), Arabidopsis thaliana (http://www.arabidopsis.org/), Drosophila melanogaster (http://flybase.bio.indiana.edu/) and Caenorhabditis elegans (http://www.wormbase.org/).
METHODS
Measurement of protein function similarity
A particular gene product can be characterized with different types of functions, including molecular function at the biochemical level (e.g. cyclase or kinase, whose annotation is often more related to sequence similarity and protein structure) and the biological process at the cellular level (e.g. pyrimidine metabolism or signal transduction, which is often revealed in the high-throughput data of protein interaction and gene expression profiles). In our study, function annotation of protein is defined by the GO biological process (21). The GO biological process ontology is available at http://www.geneontology.org. It has a hierarchical structure with multiple inheritances. We used GO biological process classification, as of November 2003, to assign function to unannotated proteins in our study. After acquiring the biological process functional annotation for the known proteins along with their GO Identification (ID), we generated a numerical GO INDEX, which represents the hierarchical structure of the classification. The more detailed level of the GO INDEX, the more specific is the function assigned to a protein. The maximum level of GO INDEX is 12. The following shows an example of GO INDEX hierarchy, with the numbers on the left giving the GO INDICES and the numbers in the brackets indicating the GO IDs:
2 cellular process (GO:0009987)
2-1 cell communication (GO:0007154)
2-1-8 signal transduction (GO:0007165)
2-1-8-1 cell surface receptor linked signal transduction (GO:0007166)
2-1-8-1- 4 G-protein coupled receptor protein signaling pathway (GO:0030454)
2-1-8-4-4-12 signal transduction during conjugation with cellular fusion (GO:0000750)
In SGD (http://www.yeastgenome.org/), 4044 yeast proteins have been annotated with one or more GO biological process IDs.We calculated protein function similarity by comparing the level of similarity that the two proteins share in terms of their GO INDICES. For example, if both gene-1 and gene-2 have annotated functions, assume gene-1 has a function represented by GO INDEX 2-1-8-1 and gene-2 has a function represented by GO INDEX 2-1-8. When compared with each other for the level of matching GO INDEX, they match with each other through 2-1-8, i.e. INDEX level 1 (2), INDEX level 2 (2-1) and INDEX level 3 (2-1-8). In general, the function similarity between proteins x and y is defined by the maximum number of index levels from the top shared by x and y. The smaller the value of function similarity, the broader is the functional category shared by the two proteins.
Calculation of Bayesian probabilities
We calculated probabilities for two genes to share the same function based on different types of high-throughput data, i.e. microarray data, protein binary interaction data and protein complex data. Given two genes are correlated in gene expression with Pearson correlation coefficient r in microarray data (Mr), the posterior probability that two genes have the same function, p(S|Mr), is computed using the Bayes' formula:

where S represents the event that two genes have the same function at a given level of GO INDEX, p(Mr|S) is the conditional (a priori) probability that two genes are correlated in their expression profiles with correlation coefficient r, given that two genes have the same level of GO INDEX. The probability p(S) is the probability of proteins whose functions are similar at the given level of GO INDEX by chance. The probabilities p(Mr|S) and p(S) are computed based on a set of proteins whose functions have been annotated in the GO biological process. The probability p(Mr) is the frequency of gene expression correlated with coefficient r over all gene pairs in yeast, which is calculated from the genome-wide gene expression profiles.
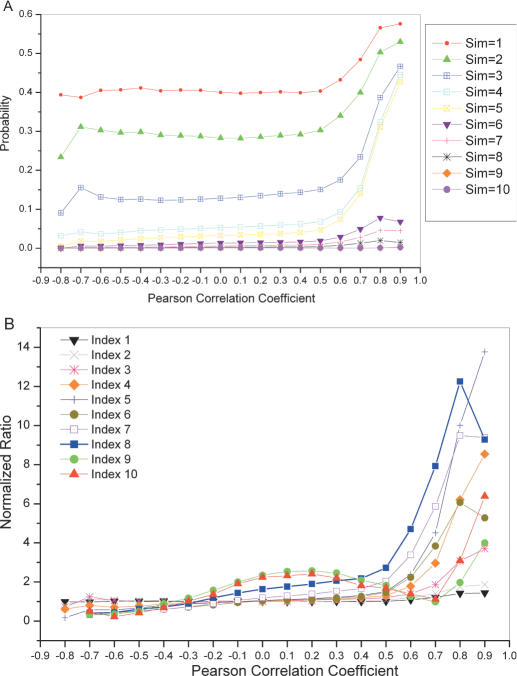
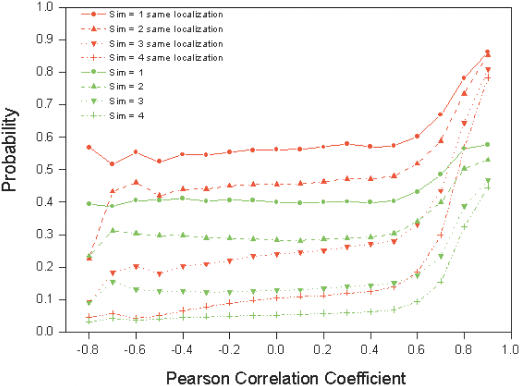
To quantify the gene function relationship among the correlated gene expression pairs, we calculated the probabilities of such gene expression correlated pairs sharing the same function at each GO INDEX level. It shows a higher probability of sharing the same function for broad functional categories (the high-order GO INDEX levels), or highly correlated genes in expression profiles (Figure 1A). Figure 1B shows the presence of information in highly correlated gene-expression pairs for their gene functional relationship in comparison to random pairs. Based on Figure 1, we decided to consider pairs with gene expression profile correlation coefficient ≥0.7 for function predictions, as other pairs have little information for function prediction. The estimated probabilities of sharing the same function corresponding to gene pairs with r ≥ 0.7 were smoothed by using a monotone regression function [the pool-adjacent-violators algorithm (27)] for protein function prediction. We also integrated protein subcellular information into probability calculations of microarray data. As shown in Figure 2, two genes with correlated gene expression profiles are more likely to have the same function if they share the same cellular compartment.
Figure 1.
(A) Probabilities of pairs sharing the same levels of GO indices versus Pearson correlation coefficient of microarray gene expression profiles. (B) Normalized ratios for the probabilities of gene pairs sharing the same levels of GO indices (p(S|Mr)) against the probabilities of random gene pairs sharing the same levels function similarity (p(S)) versus Pearson correlation coefficient of microarray gene expression profiles.
Figure 2.
Probabilities of sharing the same function calculated from the gene pairs with the same localization (red lines) and from all the gene pairs without localization information considered (green lines) versus Pearson correlation coefficient of microarray gene expression profiles.
For protein binary interaction (B), the probability that two proteins have the same function, p(S|B), is computed as:

where S represents the event that two proteins have the same function at a given GO INDEX level. p(B|S) is the probability for two proteins to have a protein binary interaction given the knowledge that they share the same function. The prior probability p(S) is the relative frequency of proteins whose functions are the same. The probabilities of p(B|S) and p(S) are computed based on the set of proteins whose functions have been annotated in the GO biological process. The probability p(B) is the relative frequency of two proteins having a known binary interaction over all possible pairs in yeast, which is estimated from the known protein interaction data set.
Similarly, given two proteins are in the same complex, i.e. have a complex interaction (C), we can estimate the probability of two proteins having the same function p(S|C) as:

where S represents the event that two proteins have the same function at a given GO INDEX level. p(C|S) is the probability for two proteins to be in the same complex given that they share the same function. The probability p(C) is the relative frequency of proteins having complex interaction over all protein pairs in yeast. The prior probability p(S) is the relative frequency of proteins whose functions are similar. The calculation of p(C|S) and p(S) is based on the set of proteins whose functions have been annotated in the GO biological process.
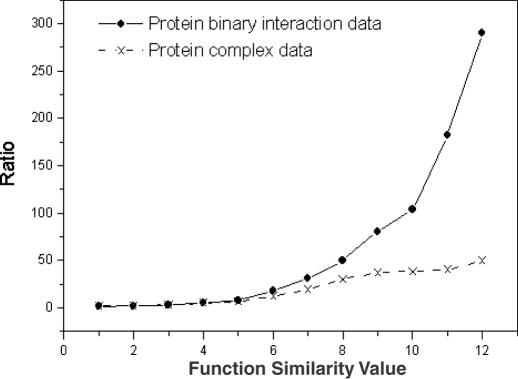
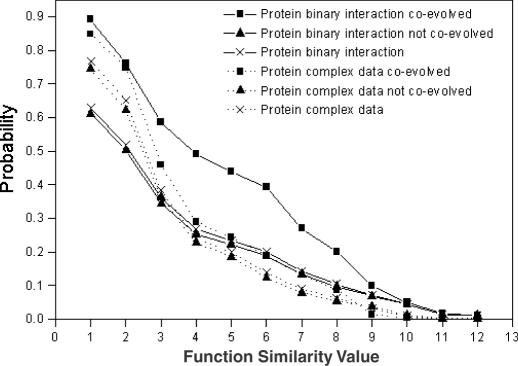
The analysis result of the protein–protein interaction data is shown in Figure 3 that shows the normalized ratios of protein–protein interaction pairs against the random pairs for sharing the same GO INDEX level. Since the value is highly above 1, particularly for more specific function categories, there clearly exists a relationship between the protein–protein interaction data and similarity in function. Such relationships can be utilized to make function predictions. It is assumed that if the protein interaction pairs are evolutionally conserved, they are more likely to share the same function since protein interaction might put constraints on sequence divergence (28). We added the evolution information into the probability calculations for interacting proteins to share the same function based on sequence comparison. For each protein in S.cerevisiae, its putative orthologs in other three distantly related species (A.thaliana, D.melanogaster and C.elegans) were identified using the reciprocal search method (29). Thus, protein interaction data can be classified into two subsets: (i) for each interacting pair {Pi, Pj}, both proteins i and j have orthologs in at least one organism out of the three species; and (ii) the remaining data. For each subset we calculated its Bayesian probability (Figure 4). The interaction pairs in subset (i) can be considered as co-evolved and they indeed have higher probabilities of sharing the same function as shown in Figure 4.
Figure 3.
Functional relationship in yeast protein–protein interaction data. The horizontal axis shows the GO INDEX levels that two proteins share. The normalized ratios between the probabilities of interacting proteins sharing the same levels of GO INDICES compared with the probabilities of random pairs are shown in vertical axis.
Figure 4.
The probabilities of sharing the same function for interaction pairs that are co-evolved (line with square), interaction pairs that are not co-evolved (line with up triangle) and overall interaction pairs (line with cross). The solid lines are for protein binary interaction data and dot lines are for protein complex interaction data.
Protein function prediction
Local prediction
In the local prediction of an unannotated protein using its immediate neighbors in the network graph, we follow the idea of ‘guilt by association’, i.e. if an interaction partner of the studied unannotated protein x has a known function, x may share the same function with a probability underlying the high-throughput data between x and its partner. We identify the possible interactors for protein x in each high-throughput data type (protein binary interaction, protein complex interaction and microarray gene expression with correlation coefficient r ≥ 0.7). We assign functions to the unannotated proteins on the basis of common functions identified among the annotated interaction partners, using the probabilities described in the previous section on Calculation of Bayesian probabilities. Furthermore, we assume that the information contents for protein function prediction from different sources of high-throughput data or different interaction partners are independent, based on the early suggestion that the information from different high-throughput data are conditionally uncorrelated (30,31). A protein can belong to one or more GO INDICES, depending upon its interaction partners and their functions. For example, in Figure 5, protein x is an unannotated protein. Proteins a, b and c that interact with x have known functions. With the assumption that Fl, l = 1, 2,…, n, represents a collection of all the functions that proteins a, b and c have, a likelihood score function for protein x to have function Fl, G(Fl, x), is defined as:
Figure 5.
Illustration of prediction method. Protein x is an unannotated protein. Proteins a, b and c are all the proteins with known functions that have interaction with protein x. The interaction events could be correlation in gene expression (M), protein binary interaction (B) or protein complex interaction (C).

where Sl represents the event that two proteins have the same function in terms of their GO INDEX level as Fl. P′(Sl|M), P′(Sl|B) and P′(Sl|C) are calculated based on probabilities of interaction pairs to have the same function at the given GO INDEX level for gene expression correlation coefficient ≥0.7 (M), protein binary interaction (B) and protein complex interaction (C), respectively. In each type of high-throughput data, one unannotated protein might have multiple interaction partners with function Fl. Suppose that there are nM, nB and nC interaction partners with function Fl in the three types of high-throughput data, respectively. P′(Sl|M), P′(Sl|B) and P′(Sl|C) in Equation 4 are calculated as:


Pj(Sl|M), Pj(Sl|B) and Pj(Sl|C) were estimated probabilities retrieved from the probability curves calculated in the previous section. We defined the likelihood score G(Fl, x) as Reliability score for each function Fl. The final predictions are sorted based on the Reliability score for each predicted GO INDEX. The Reliability score represents the probability for the unannotated protein to have a function Fl, assuming all the evidences from the high-throughput data are independent and only applicable to immediate neighbors in the network.
Global prediction
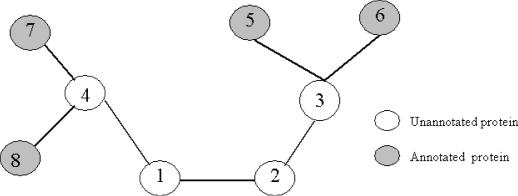
The major limitation of the local prediction method is that it only uses the information of immediate neighbors in a graph to predict a protein's function. In some cases, the uncharacterized proteins may not have any interacting partners with known function annotation, and its function cannot be predicted using the local prediction method. In addition, the global properties of the graph are underutilized since this analysis does not include the links among proteins of unknown functions. In Figure 6 proteins 1, 2, 3 and 4 are unannotated proteins and proteins 5, 6, 7 and 8 are annotated proteins with known functions. If we only use the local prediction method, the function of proteins 3 and 4 can be predicted but the function of proteins 1 and 2 cannot be predicted, since all the neighbors of proteins 1 and 2 are unannotated proteins. Moreover, the contributions of function assignment for protein 4 are not only from the neighbor proteins 7 and 8 whose functions are already known, but also from protein 1 when its functions are predicted through the following information propagation: proteins 5 and 6 → protein 3 → protein 2 → protein 1. Hence, the functional annotation of uncharacterized proteins should not only be decided by their direct neighbors, but also controlled by the global configuration of the interaction network. Based on such global optimization strategy, we developed a new approach for predicting protein function. We used the Boltzmann machine to characterize the global stochastic behavior of the network. A protein can be assigned to multiple functional classes, each with a certain probability.
Figure 6.
Illustration of protein function global prediction from interaction network. Proteins 1, 2, 3 and 4 are unannotated proteins. Proteins 5, 6, 7 and 8 are annotated proteins with known functions.
In the Boltzmann machine, we consider a physical system with a set of states, α, each of which has energy Hα. In thermal equilibrium, given a temperature T, each of the possible states α occurs with probability:
![]()
where the normalizing factor R = ∑αe−Hα/KBT and KB is the Boltzmann's constant. This is called the Boltzmann–Gibbs distribution (32). It is usually derived from the general assumptions about microscopic dynamics. It is also applied to a stochastic network. In an undirected graphical model with binary-valued nodes, each node (protein) i in the network has only one state value Z (1 or 0). In our case, Z = 1 means that the corresponding node (protein/gene) has either known functions or predicted functions assigned to the node. Now, we consider the system going through a dynamic process from non-equilibrium to equilibrium, which corresponds to the optimization process for the function prediction. For the state at time t (optimization integration step t), node i has the probability for Zt,i to be 1, P(Zt,I = 1|Zt−1, j≠I) and the probability is given as a sigmoid-function of the inputs from all the other nodes at time t − 1:
![]()
where β is a parameter reversely proportional to the annealing temperature and Wij is the weight of the edge connecting proteins i and j in the interaction graph. Wij is calculated by combining the evidence from gene expression correlation coefficient ≥ 0.7 (M), protein binary interaction (B) and protein complex interaction (C):
![]()
where Sk represents the event that two proteins i and j have the same function at the GO INDEX level k, k = 1,2,…,12. P(Sk|M), P(Sk|B) and P(Sk|C) are the estimated probabilities retrieved from the probability curves calculated in the previous section. δj is the modifying weight:

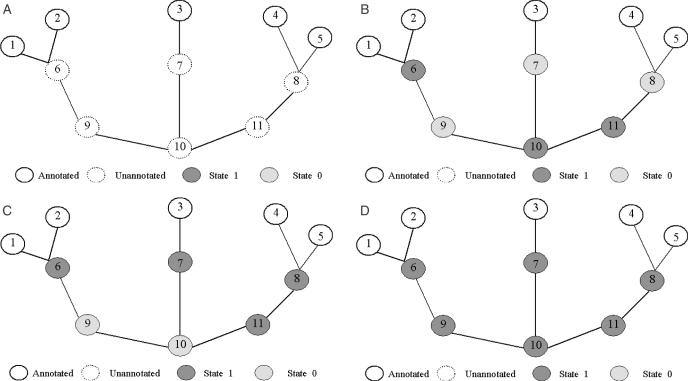
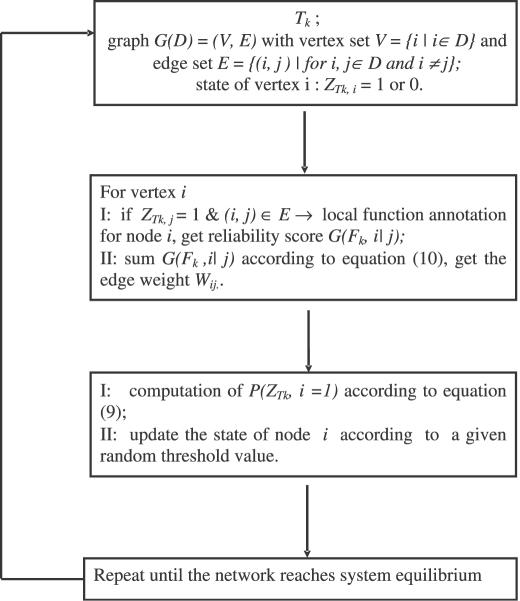
To achieve the global optimization, we applied simulated annealing technique as the following process (Figure 7): first, we set the initial state of all unannotated proteins (nodes) to be 0 or 1 randomly. The state of any annotated protein is always 1. If an unannotated protein is assigned with the state 1, its function will be predicted based on its immediate neighbors with known functions, using the local prediction method. Next, starting with a high temperature, pick a node i and compute Pi according to Equation 9, then update its state to 1 if the probability Pi is above a certain threshold. Each update of function prediction is based on its immediate neighbors with state 1 (i.e. known functions or predicted functions in the previous steps), using the local prediction method. The iterations are done till all the nodes in the network reach the equilibrium. Figure 8 shows the flow chart of this process. With gradually cooling down, the system is likely to settle in a global optimal state of the network configuration (Figure 7D).
Figure 7.
Illustration of the global method for function prediction using simulated annealing technique. (A) A given interaction network where proteins (1–5) have known function and proteins (6–11) are unannotated proteins. (B) In the initial state, the states of all unannotated proteins (nodes) are randomly selected to be 0 or 1 and the state of any annotated protein is always 1. For the unannotated protein with assigned state as 1, its functions are predicted using the local prediction method. (C) Starting with a high temperature, for each node i we compute its value μi, then update its state. Thus proteins 6, 7, 8, 11 can be assigned function. This process is shown in Figure 8. (D) With temperature going down, all unannotated proteins might be assigned function finally. The system might resettle in a global optimization of network configuration.
Figure 8.
The flow chart of dynamical process of protein functional prediction and state updating in an interaction network.
RESULTS
We have implemented three methods for predicting the protein functions as described above, i.e. (i) local prediction without integrating evolution and localization information; (ii) local prediction with integrating evolution and localization information; and (iii) global prediction with integrating evolution and localization information. We evaluated the performance of the three methods using all annotated proteins in yeast. The performance of our prediction methods was evaluated using two different methods: function prediction accuracy at the level of protein, and sensitivity and specificity of prediction at the level of function.
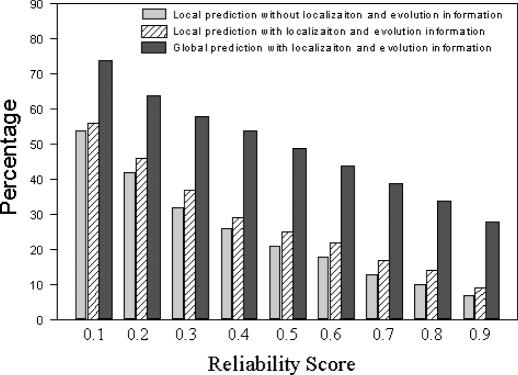
We first measured the performance of our methods at the level of proteins, i.e. a correct prediction for a protein means that at least one predicted function is the same as a known function for the protein. For validation, we divided the 4044 annotated proteins with known GO INDICES into two sets randomly, i.e. 75% for the training set and 25% for the test set. All a priori probabilities were calculated from the training set and used for function prediction in the test set. Figure 9 shows the percentage of proteins whose functions can be predicted accurately. We found that the localization and evolution information improved the prediction. The global method has the best performance since it utilizes the maximal available information. Moreover, 84% proteins of the test set can be predicted using the local prediction method while 87% proteins of the test set can be predicted using the global method since the global method can assign functions to proteins that only have unannotated interaction partners. The function of the remaining 13% proteins cannot be predicted, since they do not connect to any other protein with known function, either directly or indirectly, in the current available high-throughput data.
Figure 9.
Percentage of proteins in testing data whose functions can be successfully predicted versus the Reliability score, with an interval of 0.1. The percentage is calculated as P = n/N where n is the number of proteins whose functions are correctly predicted, and N is the number of predictable proteins for their functions by the method. For local prediction method N = 0.84 × (number of testing proteins) and for the global prediction method N = 0.87 × (number of testing proteins).
We further used sensitivity (SN) and specificity (SP) to measure the performance of our methods at the level of functions (one protein can have multiple functions) using 10-fold cross-validation. We labeled all 4044 annotated proteins with known GO INDICES into fold 1–10. Each time, we pick one fold as the test data set and the other nine folds were used as training data to calculate prior probabilities. We estimate the SN to determine the success rate of the method and SP to assess the confidence in the predictions (14). For a given set of proteins K, let ni be the number of the known functions for protein Pi. Let mi be the number of functions predicted for the protein Pi by the method. Let ki be the number of predicted functions that are correct (the same as the known function). Thus, SN and SP are defined as:


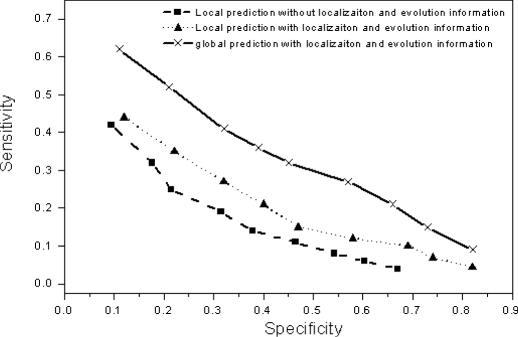
Figure 10 shows the SN versus SP of the method with Reliability score cutoff from 0.1 to 0.9. It shows that the localization and evolution information can improve the sensitivity. The global prediction shows significantly better sensitivity–specificity plot than local predictions. It is worthwhile mentioning that while the global method can predict many more functions, it is not at the cost of specificity. This is because the probability for a particular function decays fast as the information of the function propagates through the network. Typically for a given protein, one or very few functions have probability >10%, and the remaining predictions can be ignored. On the other hand, the highest specificity can only reach 70%. Some false positives generated in our method might be caused by the independence assumption of different sources of high-throughput data. Such assumption could be oversimplified due to biases inherent in the data. For example, protein binary interactions are related to correlations between gene expression profiles (17). Nevertheless, some predicted functions from our methods could be true but they have not yet been determined by experiments, and thus they are not included in the GO annotation.
Figure 10.
Sensitivity–specificity plot on the test set for the three prediction methods.
Using all the 4044 annotated proteins with known GO INDICES as the training set, we are able to assign functions to 1802 out of the 2280 unannotated proteins in yeast at different levels of functions (GO INDICES). The detail prediction results are available at http://digbio.missouri.edu/~ychen/ProFunPred. The number of unannotated genes with function predictions with respect to the specificity and GO INDEX levels can be found in Table 1. Using our method, we assign not only general functional categories to unannotated protein, but also the specific functions to unannotated proteins. For example, Table 2 shows 14 genes whose predicted functions are with Reliability score ≥0.9 and GO index level ≥8. A total of 104 unannotated proteins were assigned functions with Reliability score ≥0.9 and GO index level ≥7. The MS Excel file of 104 proteins can be downloaded at http://digbio.missouri.edu/~ychen/ProFunPred.
Table 1. Number of unannotated genes with function predictions with respect to prediction Reliability score and index level.
| Index | Reliability score | ||||||||
|---|---|---|---|---|---|---|---|---|---|
| ≥0.9 | ≥0.8 | ≥0.7 | ≥0.6 | ≥0.5 | ≥0.4 | ≥0.3 | ≥0.2 | ≥0.1 | |
| 1 | 897 | 964 | 1045 | 1116 | 1185 | 1264 | 1331 | 1530 | 1707 |
| 2 | 847 | 922 | 978 | 1052 | 1130 | 1217 | 1315 | 1519 | 1707 |
| 3 | 710 | 801 | 883 | 955 | 1018 | 1102 | 1236 | 1491 | 1693 |
| 4 | 627 | 714 | 789 | 870 | 949 | 1052 | 1151 | 1433 | 1673 |
| 5 | 593 | 691 | 761 | 836 | 918 | 1016 | 1120 | 1405 | 1659 |
| 6 | 271 | 378 | 472 | 447 | 622 | 707 | 849 | 1128 | 1495 |
| 7 | 104 | 173 | 248 | 316 | 395 | 483 | 595 | 722 | 1159 |
| 8 | 14 | 31 | 48 | 68 | 103 | 147 | 194 | 299 | 680 |
| 9 | 0 | 1 | 2 | 3 | 4 | 4 | 11 | 20 | 105 |
| 10 | 0 | 0 | 0 | 0 | 0 | 0 | 0 | 0 | 6 |
Table 2. Function predictions for 14 genes whose Reliability score ≥0.9 and GO index level ≥8.
| ORF ID | Predicted GO biological process index with Reliability score | ||
|---|---|---|---|
| YDR091C | 2-4-5-3-4-2-4-2 (0.9) | 5-20-26-12-2-10-3-2 (0.9) | |
| Ribosome biogenesis: processing of 20S pre-rRNA | rRNA processing: processing of 20S pre-rRNA | ||
| YDR365C | 2-4-5-3-4-2-4-2 (0.97) | 5-20-26-12-2-10-3-1 (0.92) | |
| Ribosome biogenesis: processing of 20S pre-rRNA | rRNA processing: 35S primary transcript processing | ||
| YDR496C | 2-4-5-3-4-2-4-1 (0.97) | 5-4-5-3-4-2-4-1 (0.93) | |
| Ribosome biogenesis: 35S primary transcript processing | Ribosome biogenesis: 35S primary transcript processing | ||
| YGR145W | 2-4-5-3-4-2-4-2 (0.99) | 5-20-26-12-2-10-3-1 (0.99) | 5-4-5-3-4-1-2-1 (0.94) |
| Ribosome biogenesis: processing of 20S pre-rRNA | Ribosome biogenesis: 35S primary transcript processing | Ribosome biogenesis: 35S primary transcript processing | |
| YHR033W | 5-20-9-21-2-4-9-3 (0.94) | ||
| Ubiquitin-dependent protein catabolism | |||
| YJL069C | 2-4-5-3-4-2-4-2 (0.97) | 5-20-26-12-2-10-3-2 (0.93) | |
| Ribosome biogenesis: processing of 20S pre-rRNA | rRNA processing: processingof 20S pre-rRNA | ||
| YKR060W | 5-20-26-12-2-10-3-2 (0.96) | ||
| rRNA processing: processing of 20S pre-rRNA | |||
| YLR196W | 2-4-5-3-4-2-4-2 (0.97) | ||
| Ribosome biogenesis: processing of 20S pre-rRNA | |||
| YLR409C | 5-20-26-12-2-10-3-2 (0.99) | 5-20-26-12-2-10-3-1 (0.96) | |
| rRNA processing: processing of 20S pre-rRNA | Ribosome biogenesis: 35S primary transcript processing | ||
| YMR116C | 5-20-26-12-2-10-3-2 (0.96) | ||
| rRNA processing: processing of 20S pre-rRNA | |||
| YMR290C | 5-4-5-3-4-2-4-1 (0.98) | 5-20-26-12-2-10-3-2 (0.97) | 2-4-5-3-4-1-2-1 (0.96) |
| Ribosome biogenesis: 35S primary transcript processing | rRNA processing: processingof 20S pre-rRNA | Ribosome biogenesis: 35S primary transcript processing | |
| YNL132W | 2-4-5-3-4-2-4-2 (0.99) | 5-4-5-3-4-2-4-1 (0.99) | 5-20-9-21-2-4-9-3 (0.92) |
| Ribosome biogenesis: processing of 20S pre-rRNA | Ribosome biogenesis: 35Sprimary transcriptprocessing | Ubiquitin-dependentprotein catabolism | |
| YNL175C | 2-4-5-3-4-2-4-2 (0.92) | 5-20-26-12-2-10-3-2 (0.92) | |
| Ribosome biogenesis: processing of 20S pre-rRNA | Ribosome biogenesis: 35S primary transcriptprocessing | ||
| YNR054C | 2-4-5-3-4-2-4-2 (0.92) | 5-20-26-12-2-10-3-2 (0.92) | |
| Ribosome biogenesis: 35S primary transcript processing | Ribosome biogenesis: 35S primary transcript processing | ||
Numbers in parentheses denote the Reliability score.
DISCUSSION
Systematic and automated prediction of gene function using high-throughput data represents a major challenge in the post genomic era. To address this challenge, we developed a systematic method to assign function in an automated fashion, using integrated computational analysis of yeast high-throughput data, including binary interaction, protein complexes and gene expression microarray data, together with the GO biological process functional annotation. The main contribution of our work is to provide a framework of integrating heterogeneous biological information for genome-scale protein function prediction. In addition, we combine protein subcellular localization and evolution information into function prediction. It is worthwhile mentioning that some predictions can be used as input data for our framework, although predicted results are not as reliable as experimental data. We used predicted protein–protein interactions, together with microarray data for gene function prediction in A.thaliana (33). In addition, subcellular localization can be predicted with good confidence (34,35) and the information may help gene function prediction as well. Our method is robust to obtain global optimization using simulated annealing. With starting from six different sets of randomly selected starting points, we obtained exactly the same result as shown in Table 1.
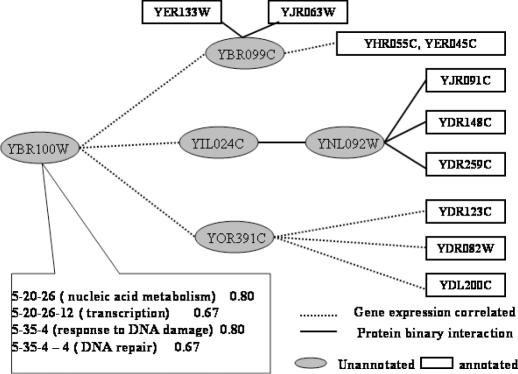
Our methods assign functions for unannotated proteins on the genomic scale. To our knowledge, our method covers more unannotated proteins for functional predictions than any other methods published previously (see Table 3). From 29 proteins listed in Table 1 in the paper of Schwikowski et al. (11) that have two or more interacting proteins, we randomly choose five unannotated proteins that are not annotated till now to compare the prediction results between our method and other methods by Schwikowski et al. (11), Deng et al. (14), Letovsky and Kasif (15), Vazquez et al. (19) and Karaoz et al. (20) (see Table 4). One improvement from our method is that we can assign unannotated proteins into deeper levels of biological processes, while most other methods make protein function prediction using less detailed functional categories defined in YPD (http://proteome.incyte.com) or MIPS (http://mips.gfs.de) databases. Some of the increased performance of our method might be due to the different size of data set used in different studies, but we believe it does not account for the major improvement of our method. The major contribution is that our method integrated multiple sources of data, by combining and propagating information systematically across the entire network, based on the global optimization. Moreover, using our global prediction method, we can assign functions for the proteins whose interacting partners do not have any known function as shown in Figure 11 and Table 5. Our predictions can provide biologists with hypotheses to study and design specific experiments, to validate the predicted functions using tools such as mutagenesis. Such combination of computational methods and experiments may discover biological functions much more efficiently than traditional approaches.
Table 3. The prediction methods and the number of proteins with predicted functions.
Table 4. The comparison of prediction results from five methods.
| Prediction methods | YMR322C | YDR100W | YLR449W | YLR128W | YER079W |
|---|---|---|---|---|---|
| Schwikowski et al. (11)a | Cell stress (3/3) | Vesicular transport (2/2) | Protein synthesis (2/3) | Cell polarity (2/4) | Signal transduction(2/2) |
| Membrane fusion (2/2) | |||||
| Deng et al. (14)b | Other metabolism (0.78) | Small molecule transport (0.99) | No prediction | No prediction | Cell polarity (0.49) |
| Cell stress (0.63) | Membrane fusion (0.17) | Signal tranduction (0.48) | |||
| Small molecule transport (0.25) | |||||
| Letovsky and Kasif (15)c | Pyridoxine metabolism (0.1) | Intracellular protein transport (0.8) | No prediction | No prediction | No prediction |
| Thiamine biosynthesis (0.2) | Vesicle-mediated transport (0.9) | ||||
| Vazquez et al. (19)d | Biosynthesis of vitamins, cofactors, and prosthetic groups (100) | Vacuolar and lysosomal organization (43) | No prediction | Cell cycle check point proteins (94) | Cell growth (20) |
| Vacuolar transport (35) | Organization of cytoskeleton (5) | Budding, cell polarity and filament formation (20) | |||
| Vesicular transport (Golgi network, etc.) (22) | Proteasome (1) | Cytokinesis (20) | |||
| Karaoz et al. (20)e | Not available | ER to Golgi transport (GO:0006888) | Not available | Not available | Not available |
| Retrograde (Golgi to ER) transport (GO:0006890) | |||||
| Our methodf | 5-20-42-5-9-4 (0.93) | 5-20-36 (0.68) | 5-20-26-11-4-5-3 (0.95) | 2-4-6-3 (0.65) | 5-20-36-13-54-5 (0.98) |
| Pyridoxine metabolism | Protein metabolism | Processing of 27S pre-rRNA | Cytokinesis | Protein-lipolyation | |
| 5-20-42-5-10-5 (0.92) | 2-4-11-15-4 (0.56) | 2-4-11-15-14-2-4 (0.93) | 2-4-2-2 (0.65) | 2-4-11-15-9-4-10 (0.89) | |
| Vitamin biosynthesis: thiamine biosynthesis | Intracellular transport: nucleocytoplasmic transport | Ribosome-nucleus export | Cell growth: bud growth | Protein-vacuolar targeting | |
| 5-20-36-13-58-2 (0.91) | 5-4-11-34-8 (0.54) | 3-17-1-1-2 (0.6) | 5-20-12-1-5-3-1 (0.86) | ||
| Protein ubiquitination | Retrograde (Golgi to ER) transport | Cellular process: bud growth | Negative regulation of gluconeogenesis |
aNumbers in parentheses denote the number of neighbors with the predicted function/number of interaction partners with any known functions. Predictions are classified according to the YPD annotation categories of ‘cellular role’.
bData are from cellular role prediction results available at http://www.cmb.usc.edu/msms/FunctionPrediction/. Number in the parenthesis denotes the probability of a protein belonging to the functional category. There were 44 categories of cellular roles used in prediction.
cPredictions are from http://genomics10.bu.edu/netmark using the GO categories as function labels. Numbers in parentheses denote the probability of function assignment.
dFunctional classifications were based on the MIPS. The numbers in parentheses show the percentage of occurrence of the corresponding function in 100 runs of prediction algorithm.
eThe results come from the Supplementary Data. Function predictions are made with GO IDs and the authors listed a predicted function if the F-measure for this function as obtained by the cross-validation evaluation is at least 75%.
fFunction annotations were from our method with the GO biological process INDEX and its Reliability score shown in the parentheses.
Figure 11.
Global function prediction for yeast YBR100W. All interacting partners of YBR100W are unknown in functions. Through the global prediction method, it was assigned to several functions GO Indices. The functions of related proteins are shown in Table 5.
Table 5. GO indices of proteins in Figure 11.
| ORF ID | Name | A/P | GO index | GO biological process annotation |
|---|---|---|---|---|
| YER133W | GLC7 | A | 5-20-26-11-4-5-1 | 35S primary transcript processing |
| 5-35-7 | Response to heat | |||
| YJR063W | RPA12 | A | 5-20-7-16-8-6 | Glycogen metabolism |
| 5-20-26-12-2-10-3-1 | 35S primary transcript processing | |||
| YER045C | ACA1 | A | 5-20-26-12-2-13-2 | Transcription initiation from Pol II promoter |
| 5-20-26-12-2-11-6 | Transcription initiation from Pol II promoter | |||
| YHR055C | CUP1 | A | 5-34-3-2-3-6-4 | Response to copper ion |
| YJR091C | JSN1 | A | 5-20-9-21-3-1-1 | Deadenylation-dependent decapping |
| 5-20-26-11-2-2-1 | mRNA catabolism, deadenylation-dependent | |||
| YDR148C | KGD2 | A | 5-20-7-11-7 | Tricarboxylic acid cycle |
| 5-20-13-1-4-6-1 | 2-Oxoglutarate metabolism | |||
| YDR259C | YAP6 | A | 5-20-26-12-1-3-2-5 | Positive regulation of transcription from Pol II promoter |
| 5-20-26-12-1-3-6-6 | Positive regulation of transcription from Pol II promoter | |||
| YDR123C | INO2 | A | 5-20-26-12-2-3-6-6 | Positive regulation of transcription from Pol II promoter |
| YDR082W | STN1 | A | 5-35-4-5-3 | Telomere capping |
| YDL200C | MGT1 | A | 5-35-4-4-3 | DNA dealkylation |
| YBR099C | P | 5-35-4-4 (0.96) | DNA ligation | |
| 5-20-26-12 (0.96) | Transcription | |||
| YNL092W | P | 5-20-26-12-2 (0.96) | Transcription, DNA-dependent | |
| 5-20-26-11-4-5 (0.88) | rRNA processing | |||
| 5-35-4-4-6-1 (0.85) | Double-strand break repair via homologous recombination | |||
| YIL024C | P | 5-20-26 (0.93) | Nucleic acid metabolism | |
| 5-35-4-4-6 (0.82) | Double-strand break repair | |||
| YOR391C | P | 5-35-4-4-3 (0.98) | DNA dealkylation | |
| 5-20-26-12-2-11 (0.89) | Transcription from Pol II promoter |
A, annotated proteins; and P, predicted functions for unannotated proteins. The numbers in the parentheses denote the Reliability score.
Future work includes exploring better optimization methods and statistical models. To solve the optimization problem in Boltzmann machine, in contrast to the simulated annealing technique, a Bayesian learning of posterior distributions over parameters (36) provides a more elaborate and systematic estimation of maximum likelihood. In addition, supervised learning methods such as Conditional Random Fields (37) can also be alternative schemes to model this stochastic learning process. Furthermore, we will develop more elaborate model-based integrations to address the dependences among different high-throughput data for protein function prediction.
Acknowledgments
ACKNOWLEDGEMENTS
We would like to thank Drs Jeff Becker, Ying Xu, Loren Hauser and Qiang Zhao for helpful discussions. We would also like to thank the two anonymous reviewers for their helpful suggestions and comments. This research is supported in part by the US Department of Energy's Genomes to Life program (http://www.doegenomestolife.org) under project, ‘Carbon Sequestration in Synechococcus Sp.: From Molecular Machines to Hierarchical Modeling’ (www.genomes-to-life.org). It was also partially funded by Nation Science Foundation (EIA-0325386).
REFERENCES
- 1.Goffeau A., Barrell,B.G., Bussey,H., Davis,R.W., Dujon,B., Feldmann,H., Galibert,F., Hoheisel,J.D., Jacq,C., Johnston,M., Louis,E.J, Mewes,H.W., Murakami,Y., Philippsen,P., Tettelin,H. and Oliver,S.G. (1996) Life with 6000 genes. Science, 546, 346–352. [DOI] [PubMed] [Google Scholar]
- 2.Pearson W. and Lipman,D. (1998) Improved tools for biological sequence comparison. Proc. Natl Acad. Sci. USA, 85, 2444–2448. [DOI] [PMC free article] [PubMed] [Google Scholar]
- 3.Altschul S., Madden,T., Schaffer,A., Zhang,J., Zhang,Z., Miller,W. and Lipman,D. (1997) Gapped BLAST and PSI-BLAST: a new generation of protein database search programs. Nucleic Acids Res., 25, 3389–3402. [DOI] [PMC free article] [PubMed] [Google Scholar]
- 4.Marcotte E., Pellegrini,M., Thompson,M., Yeates,T. and Eisenberg,D. (1999) A combined algorithm for genome-wide prediction of protein function. Nature, 402, 83–86. [DOI] [PubMed] [Google Scholar]
- 5.Pellegrini M., Marcotte,E., Thompson,M., Eisenberg,D. and Yeates,T. (1999) Assigning protein functions by comparative genome analysis: protein phylogenetic profiles. Proc. Natl Acad. Sci. USA, 96, 4285–4288. [DOI] [PMC free article] [PubMed] [Google Scholar]
- 6.Chien C., Bartel,P., Sternglanz,R. and Fields,S. (1991) The two-hybrid system: a method to identify and clone genes for proteins that interact with a protein of interest. Proc. Natl Acad. Sci. USA, 88, 9578–9582. [DOI] [PMC free article] [PubMed] [Google Scholar]
- 7.Gavin A., Bosche,M., Krause,R., Grandi,P., Marzioch,M., Bauer,A., Schultz,J., Rick,J., Michon,A. and Cruciat,C. (2002) Functional organization of the yeast proteome by systematic analysis of protein complexes. Nature, 415, 141–147. [DOI] [PubMed] [Google Scholar]
- 8.Ho Y., Gruhler,A., Heilbut,A., Bader,G.D., Moore,L., Adams,S., Millar,A., Taylor,P., Bennett,K., Boutilier,K. et al. (2002) Systematic identification of protein complexes in Saccharomyces cerevisiae by mass spectrometry. Nature, 415, 180–183. [DOI] [PubMed] [Google Scholar]
- 9.Eisen M., Spellman,P., Brown,P. and Bostein,D. (1998) Cluster analysis and display of genome-wide expression patterns. Proc. Natl Acad. Sci. USA, 95, 14863–14868. [DOI] [PMC free article] [PubMed] [Google Scholar]
- 10.Brown M., Grundy,W., Lin,D., Cristianini,N., Sugnet,C., Furey,T., Ares,M. and Haussler,D. (2000) Knowledge-based analysis of microarray gene expression data by using support vector machines. Proc. Natl Acad. Sci. USA, 97, 262–267. [DOI] [PMC free article] [PubMed] [Google Scholar]
- 11.Schwikowski B., Uetz,P. and Fields,S. (2000) A network of protein–protein interactions in yeast. Nat. Biotechnol., 18, 1257–1261. [DOI] [PubMed] [Google Scholar]
- 12.Hishigaki H., Nakai,K., Ono,T., Tanigami,A. and Takagi,T. (2001) Assessment of prediction accuracy of protein function from protein–protein interaction data. Yeast, 18, 523–531. [DOI] [PubMed] [Google Scholar]
- 13.Clare A. and King,R.D. (2003) Predicting gene function in Saccharomyces cerevisiae. Bioinformatics, 19, II42–II49. [DOI] [PubMed] [Google Scholar]
- 14.Deng M.H., Zhang,K., Mehta,S., Chen,T. and Sun,F.Z. (2002) Prediction of protein function using protein–protein interaction data. In Proceedings of the first IEEE Computer Society bioinformatics conference (CSB2002), Stanford University, Palo Alto, CA, August 14–16, pp. 117–126. [PubMed]
- 15.Letovsky S. and Kasif,S. (2003) Predicting protein function from protein/protein interaction data: a probabilistic approach. Bioinformatics, 19, I197–I204. [DOI] [PubMed] [Google Scholar]
- 16.Troyanskaya O., Dolinski,K., Owen,A., Altman,R. and Botstein,D. (2003) A Bayesian framework for combining heterogeneous data sources for gene function prediction (in Saccharomyces cerevisiae). Proc. Natl Acad. Sci. USA, 100, 8348–8353. [DOI] [PMC free article] [PubMed] [Google Scholar]
- 17.Chen Y. and Xu,D. (2003) Computation analysis of high-throughput protein–protein interaction data. Curr. Protein Pept. Sci., 4, 159–181. [DOI] [PubMed] [Google Scholar]
- 18.Winkler R.L. (1972) An Introduction to Bayesian Inference and Decision. Holt, Rinehart and Winston Inc., Austin, TX. [Google Scholar]
- 19.Vazquez A., Flammini,A., Maritan,A. and Vespignani,A. (2003) Global protein function prediction from protein–protein interaction networks. Nat. Biotechnol., 21, 697–700. [DOI] [PubMed] [Google Scholar]
- 20.Karaoz U., Murali,T.M., Letovsky,S., Zheng,Y., Ding,C., Cantor,C.R. and Kasif,S. (2004) Whole-genome annotation by using evidence integration in functional-linkage networks. Proc. Natl Acad. Sci. USA, 101, 2888–2893. [DOI] [PMC free article] [PubMed] [Google Scholar]
- 21.The Gene Ontology Consortium (2000) Gene Ontology: tool for the unification of biology. Nature Genet., 25, 25–29. [DOI] [PMC free article] [PubMed] [Google Scholar]
- 22.Mewes H., Frishman,D., Guldener,U., Mannhaupt,G., Mayer,K., Mokrejs,M., Morgenstern,B., Munsterkotter,M., Rudd,S. and Weil,B. (2002) MIPS: a database for genomes and protein sequences. Nucleic Acids Res., 30, 31–34. [DOI] [PMC free article] [PubMed] [Google Scholar]
- 23.Uetz P., Giot,L., Cagney,G., Mansfield,T.A., Judson,R.S., Knight,J.R., Lockshon,D., Narayan,V., Srinivasan,M., Pochart,P. et al. (2000) A comprehensive analysis of protein–protein interactions in Saccharomyces cerevisiae. Nature, 403, 623–627. [DOI] [PubMed] [Google Scholar]
- 24.Ito T., Tashiro,K., Muta,S., Ozawa,R., Chiba,T., Nishizawa,M., Yamamoto,K., Kuhara,S. and Sakaki,Y. (2001) Toward a protein–protein interaction map of the budding yeast: a comprehensive system to examine two-hybrid interactions in all possible combinations between the yeast proteins. Proc. Natl Acad. Sci. USA, 98, 4569–4574. [DOI] [PMC free article] [PubMed] [Google Scholar]
- 25.Gasch A.P., Spellman,P.T., Kao,C.M., Carmel-Harel,O., Eisen,M.B., Storz,G., Botstein,D. and Brown,P.O. (2000) Genomic expression programs in the response of yeast cells to environmental changes. Mol. Cell. Biol., 11, 4241–4257. [DOI] [PMC free article] [PubMed] [Google Scholar]
- 26.Huh W.K., Falvo,J.V., Gerke,L.C., Carroll,A.S., Howson,R.W., Weissman,J.S., O'Shea,E.K. (2003) Global analysis of protein localization in budding yeast. Nature, 425, 686–691. [DOI] [PubMed] [Google Scholar]
- 27.Haerdle W. (1992) Applied Nonparametric Regression. Cambridge University Press, Cambridge, UK. [Google Scholar]
- 28.Teichmann S.A. (2002) The constraints of protein–protein interactions place on sequence divergence. J. Mol. Biol., 324, 399–407. [DOI] [PubMed] [Google Scholar]
- 29.Chen Y. and Xu,D. (2004) Genome-scale understanding protein dispensability through machine-learning analysis of high-throughput data. Bioinformatics, in press. [DOI] [PubMed] [Google Scholar]
- 30.Jansen R., Yu,H., Greenbaum,D., Kluger,Y., Krogan,N.J., Chung,S., Emili,A., Snyder,M., Greenblatt,J.F. and Gerstein,M. (2003) A Bayesian networks approach for predicting protein–protein interactions from genomic data. Science, 302, 449–453. [DOI] [PubMed] [Google Scholar]
- 31.Asthana S., King,O.D., Gibbons,F.D. and Roth,F.P. (2004) Predicting protein complex membership using probabilistic network. Genome Res., 14, 1170–1175. [DOI] [PMC free article] [PubMed] [Google Scholar]
- 32.Parisi G. (1988) Statistical Field Theory. Addison-Wesley, Reading, MA. [Google Scholar]
- 33.Joshi T., Chen,Y., Alexandrov,N. and Xu,D. (2004) Cellular function prediction and biological pathway discovery in Arabidopsis thaliana using microarray data. In Proceedings of the 26th Annual International Conference of the IEEE EMBS, San Francisco, CA, pp. 2881–2884. [DOI] [PubMed] [Google Scholar]
- 34.Gardy J.L., Spencer,C., Wang,K., Ester,M., Tusnady,G.E., Simon,I., Hua,S., deFays,K., Lambert,C., Nakai,K. and Brinkman,F.S. (2003) PSORT-B: improving protein subcellular localization prediction for gram-negative bacteria. Nucleic Acids Res., 31, 3613–3617. [DOI] [PMC free article] [PubMed] [Google Scholar]
- 35.Scott M.S., Thomas,D.Y. and Hallett,M.T. (2004) Predicting subcellular localization via protein motif co-occurrence. Genome Res., 14, 1957–1966. [DOI] [PMC free article] [PubMed] [Google Scholar]
- 36.Ackley D.H., Hinton,G.E. and Sejnowski,T.J. (1985) A learning algorithms for Boltzmann machines. Cognit. Sci., 9, 147–169. [Google Scholar]
- 37.Lafferty J., McCallum,A. and Pereira,F. (2001) Conditional random fields: probabilistic models for segmenting and labeling sequence data, In International Conference on Machine Learning (ICML), Williams College, MA, pp. 282–289. [Google Scholar]


