Abstract
Genomic instability is a hallmark of human cancer, and results in widespread somatic copy number alterations. We used a genome-scale shRNA viability screen in human cancer cell lines to systematically identify genes that are essential in the context of particular copy-number alterations (copy-number associated gene dependencies). The most enriched class of copy-number associated gene dependencies was CYCLOPS (Copy-number alterations Yielding Cancer Liabilities Owing to Partial losS) genes, and spliceosome components were the most prevalent. One of these, the pre-mRNA splicing factor SF3B1, is also frequently mutated in cancer. We validated SF3B1 as a CYCLOPS gene and found that human cancer cells harboring partial SF3B1 copy-loss lack a reservoir of SF3b complex that protects cells with normal SF3B1 copy number from cell death upon partial SF3B1 suppression. These data provide a catalog of copy-number associated gene dependencies and identify partial copy-loss of wild-type SF3B1 as a novel, non-driver cancer gene dependency.
DOI: http://dx.doi.org/10.7554/eLife.23268.001
Research Organism: Human, Mouse
Introduction
Despite recent advances in cancer therapeutics, there remains a dearth of effective treatments. Therefore, expanding the number of candidate therapeutic targets in cancer is crucial. Cancer ‘driver genes’, which undergo positive selection due to their effects on oncogenes or tumor suppressor genes, represent cancer vulnerabilities that are broadly considered as potential therapeutic targets (Cheung et al., 2011; Eifert and Powers, 2012; Wang et al., 2015). However, alterations of non-driver genes, which do not contribute to oncogenesis but are nevertheless observed, represent an emerging class of candidate therapeutic target that have yet to be fully explored.
During the course of tumorigenesis, most cancers undergo somatic copy number alterations (SCNAs) affecting large fractions of the genome (See Appendix Note) (Beroukhim et al., 2010). Yet most genes affected by SCNAs likely do not contribute to oncogenesis and are therefore overwhelmingly genetically altered non-driver genes. Recently, our laboratory and others have described potential new therapeutic targets that occur as a result of SCNAs affecting non-driver genes. For example, partial copy-loss of the proteasome subunit PSMC2, or RNA polymerase subunit POLR2A sensitized cancer cells to further suppression of those genes (Liu et al., 2015; Nijhawan et al., 2012). This ‘CYCLOPS’ (Copy-number alterations Yielding Cancer Liabilities Owing to Partial losS) phenotype suggests that many additional cancer vulnerabilities exist as a result of SCNAs that affect non-driver genes, although some CYCLOPS genes may function as driver genes when affected by other genetic alterations besides partial copy-loss. The frequency of these CYCLOPS gene dependencies and their general features are largely unknown.
These CYCLOPS genes tend also to be cell essential genes. While essential genes would be expected to be poor therapeutic targets because of their requirement for survival in all tissues, therapeutic windows can still exist (Muller et al., 2015). Identifying which essential genes may be considered CYCLOPS genes, and the mechanisms underlying how normal cells tolerate partial loss of function, is necessary for developing approaches to target those therapeutic windows.
The spliceosome is one such essential protein complex that can be therapeutically targeted in cancer. Previous work suggested spliceosome components were enriched as candidate CYCLOPS genes (Nijhawan et al., 2012). However, spliceosome CYCLOPS dependencies have yet to be validated and the molecular mechanisms for how spliceosome CYCLOPS dependencies arise remain unclear. Compounds have been discovered that inhibit pre-mRNA splicing, with reports of broad anti-neoplastic effects (Webb et al., 2013). Furthermore, cancers can harbor recurrent mutations in splicing factors (Dvinge et al., 2016), including gain-of-function mutations in SF3B1 (Ellis et al., 2012; Harbour et al., 2013; Imielinski et al., 2012; Papaemmanuil et al., 2011; Wang et al., 2011; Yoshida et al., 2011) that can sensitize cells to spliceosome modulatory drugs (Obeng et al., 2016). In addition to SF3B1 mutations, other genomic alterations in SF3B1, including copy number alterations, may also unveil novel cancer vulnerabilities. The extent to which SF3B1 and other splicing factors can be leveraged as therapeutic targets in cancer is not fully understood.
We therefore sought to systematically evaluate the prevalence of CYCLOPS dependencies relative to other SCNA-associated gene dependencies in cancer. Here, we report that CYCLOPS dependencies are the most enriched class of copy-number associated gene dependency, even more frequent than amplification of oncogene-addicted driver gene. We find that CYCLOPS genes tend to be a subset of essential genes for which there is little feedback regulation in their expression when altered by SCNAs. We also find that more CYCLOPS gene dependencies are associated with spliceosome components than with any other gene family.
We find that wild-type SF3B1 is a non-driver CYCLOPS gene dependency and describe the mechanism behind this dependency. Furthermore, the molecular mechanism of the SF3B1 CYCLOPS dependency is distinct from SF3B1 dependencies targeted by current spliceosome inhibitors. We also identify the deubiquitinase inhibitor (DUBi’s), b-AP15, can reduce SF3B1 protein levels and target the SF3B1 CYCLOPS dependency. Moreover, DUBi’s may represent a general therapeutic approach to target CYCLOPS gene vulnerabilities. The identification of SF3B1 as a CYCLOPS gene highlights a previously unrecognized cancer vulnerability and implicates non-driver alterations of wild-type SF3B1 as a potential therapeutic target present in 11% of all cancers.
Results
Most copy-number associated cancer dependencies result from genomic loss
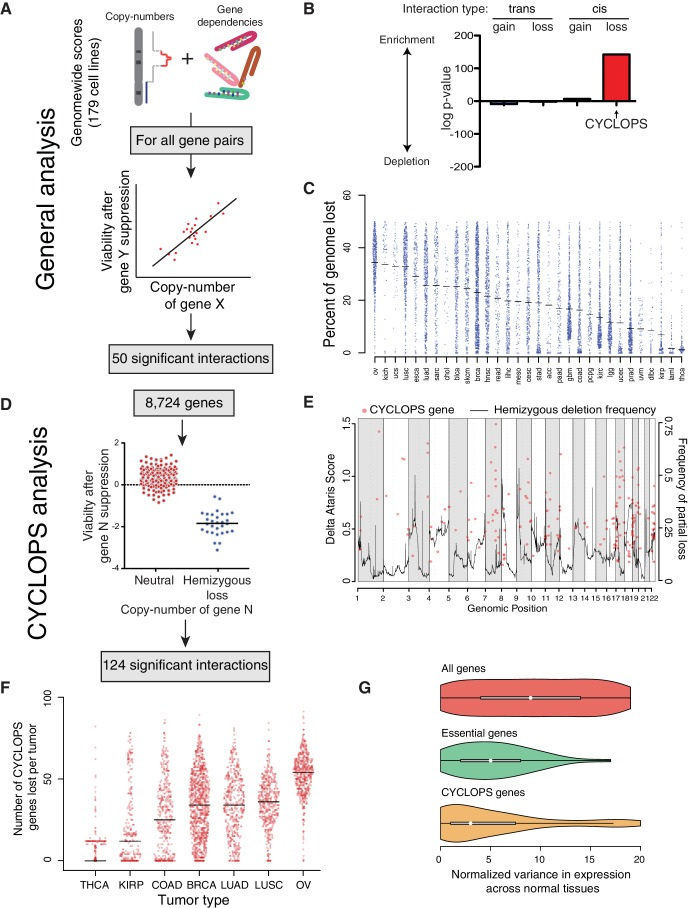
We interrogated copy-number associated vulnerabilities genome-wide across 179 cell lines by integrating gene dependency data from Project Achilles (Cowley et al., 2014) with copy-number calls for 23,124 genes (Barretina et al., 2012) (Figure 1A). The gene dependency data represented the effects on proliferation of 55,416 shRNAs targeting 11,589 unique genes, processed by the ATARiS method to estimate effects of ‘on-target’ shRNAs (Shao et al., 2013), which yielded 8724 unique gene-level dependency scores. For every pair of genes in the general analysis, we calculated Pearson correlations between the copy-number of the first gene and the dependency score of the second; yielding 201,733,776 parings in total (Figure 1A). We calculated p-values for each correlation and q-values to correct for multiple hypotheses (see Materials and methods). In many cases, a single gene dependency profile correlated with copy-number profiles of multiple genes from a single genomic region. We considered these to represent a single ‘independently significant’ interaction with the overall copy-number of that region.
Figure 1. Analysis of copy-number-associated gene dependencies.
(A) Schematic describing the general analysis of copy-number-associated gene dependencies. (B) Significance of enrichment for positive copy-number:gene dependency associations across trans and cis association classes, relative to the expected share assuming all possible interactions exhibited equal likelihood of positive association. (C) Percent of genome lost across 31 TCGA cancer types. Cancer types are indicated by TCGA abbreviations (see https://tcga-data.nci.nih.gov/datareports/codeTablesReport.htm, ‘Disease Study’ table). (D) Schematic describing the approach to identify CYCLOPS genes. (E) Relative strength (delta ATARiS score) of CYCLOPS genes (orange circles; left axis) and frequency of hemizygous deletion (solid black line; right axis) against genomic position (x-axis). (F) The number of CYCLOPS genes lost per tumor for various tumor types as in (C). Horizontal black lines represent medians per tumor type. (G) Distribution of variances in gene expression for different gene classes, normalized to expression level (see Materials and methods), in normal tissues. Whiskers represent min/max values and boxes represent upper and lower quartile ranges. Width of plots represents relative sample density.
Figure 1—figure supplement 1. Analysis of copy-number-associated gene dependencies.
In the general analysis, we identified 50 independently significant copy-number:gene-dependency interactions (q < 0.25; Supplementary file 1A). Approximately two-thirds (33/50) of these interactions involved genes on separate chromosomes (trans interactions). Among the 33 trans interactions, 21 reflected sensitization to suppression of a gene resulting from copy-loss of a different genomic region; the other 12 resulted from copy-gains. The trans gene dependencies identified were enriched for members of macromolecular complexes (q = 2.5×10⁻⁴). In three cases, copy-loss of a gene (PPP2CB, FUBP2, or MAGOH) was associated with increased sensitivity to suppression of its paralog (PPP2CA, FUBP1, and MAGOHB, respectively). In contrast, all but one interaction (16/17) between genes on the same chromosome (cis interactions) involved increases in sensitivity to suppression of a gene that had undergone copy-loss (CYCLOPS genes) (Nijhawan et al., 2012). As a result, 74% of all 50 significant copy-number:gene-dependency interactions were associated with copy-loss rather than gain (p=1.5×10⁻⁴).
Most cancers exhibit losses of candidate CYCLOPS genes
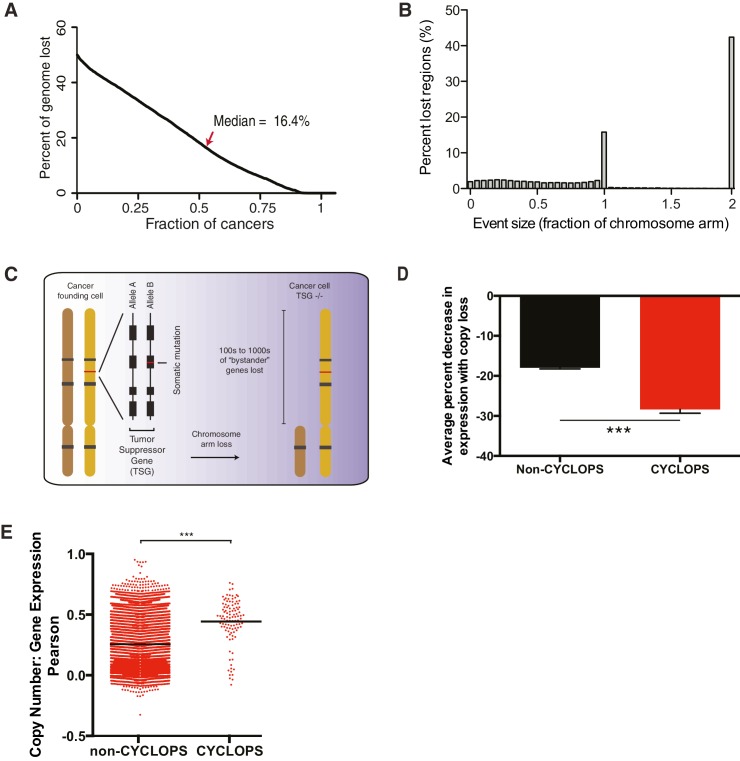
Although CYCLOPS interactions represent 0.004% (8,724/201,733,776) of all potential interactions in the general analysis, they constituted one-third of all significant interactions, making them the most enriched class of copy-number synthetic lethal interactions we identified (Figure 1B). Their prevalence is partly the result of frequent genomic loss in cancer genomes. Specifically, across 10,570 cancers spanning 31 cancer types profiled by The Cancer Genome Atlas (TCGA), 16% of the genome undergoes loss in the average cancer (Figure 1—figure supplement 1A), mainly due to losses encompassing chromosome arms or entire chromosome (Figure 1—figure supplement 1B). Indeed, loss of a tumor suppressor often involves such arm-level losses (Figure 1—figure supplement 1C). The fraction of the genome lost per tumor ranged from an average of 1.3% in thyroid cancer to 34.4% in ovarian cancer (Figure 1C).
To enhance the identification of CYCLOPS genes, we performed a genome-wide analysis focused on just CYCLOPS dependencies (Figure 1D; Materials and methods). The CYCLOPS analysis had greater power than the general analysis described above because it focused on fewer hypotheses. From the CYCLOPS analysis, we identified 124 candidate CYCLOPS genes (Supplementary file 1B), including 87% of the candidate CYCLOPS genes identified in the general analysis (Supplementary file 1A). Candidate CYCLOPS genes were distributed across all autosomes (Figure 1E) and were biased towards areas of frequent copy-loss (p<10−15). The bias toward more frequent copy-loss of candidate CYCLOPS genes may reflect greater statistical power in frequently deleted regions. We also examined the reproducibility of the CYCLOPS analysis using a separate shRNA viability screen across 77 cell lines with a separate analytical approach (Marcotte et al., 2016) and found 49% (49/103) of the CYCLOPS genes analyzed by both datasets validated in the Marcotte dataset (p<2×10⁻⁴, binomial proportion test).
Partial copy-loss of candidate CYCLOPS genes is frequent in cancer genomes. Among the 10,570 TCGA cancers with copy-number data, 71.6% harbored loss of at least one candidate CYCLOPS gene (Figure 1F). The average number of candidate CYCLOPS genes lost per tumor ranged from one in thyroid cancer to 47 in ovarian cancer.
Candidate CYCLOPS genes tend to be uniformly expressed members of essential complexes
Of the 124 candidate CYCLOPS genes, 20 were members of the spliceosome and 11 were members of the proteasome, making these the only significantly enriched KEGG pathways among candidate CYCLOPS genes (Supplementary file 1D). Candidate CYCLOPS genes are also enriched for essential genes. Genome-wide CRISPR viability data in human cancer cell lines identified 1580 core-essential genes (Hart et al., 2015), including 58% (72/124) of candidate CYCLOPS genes (p<2×10⁻⁴, binomial proportion test).
Expression of candidate CYCLOPS genes is markedly uniform across normal tissues. Across RNA-sequencing data from 2342 samples comprising 42 tissue types (Melé et al., 2015), expression of candidate CYCLOPS genes varied significantly less than that of the average gene (p=1.8×10⁻¹⁵) and trended towards greater uniformity than non-CYCLOPS essential genes (p=0.07; Figure 1G).
However, expression of candidate CYCLOPS genes is highly responsive to genomic loss in cancer. We integrated expression profiles for 16,867 genes with copy-number profiles across 1011 cell lines in the Cancer Cell Line Encyclopedia (CCLE) (Barretina et al., 2012) to determine the influence of copy-number on gene expression. Upon copy-loss, CYCLOPS gene expression decreased by 28% on average, relative to an 18% decrease among non-CYCLOPS genes (p<10−4, Figure 1—figure supplement 1D–E). These data suggest that cancers with copy-loss of CYCLOPS genes are likely to express them at lower levels than normal tissues.
SF3B1 is a CYCLOPS gene
SF3B1 was among the most significant candidate genes in our CYCLOPS analysis (Supplementary file 1B), although it was not detected in our general analysis (Supplementary file 1A). The SF3B1 protein is one of seven subunits (SF3B1–5, SF3B14 and PHF5A) of the SF3b complex, which is a constituent of the essential U2 snRNP splicing factor (Wahl et al., 2009). Cells with SF3B1 copy-loss exhibited significantly reduced viability upon partial SF3B1 suppression relative to cells without SF3B1 copy-loss (mean dependency scores of −1.14 and 0.01 respectively, p<10−5), which suggests that partial suppression of SF3B1 can be tolerated in certain contexts even though it is an essential gene.
SF3B1 is partially lost in 11% of the 10,570 cancers from the TCGA PanCan dataset (see Materials and methods for definitions of copy number states). Across all cancers SF3B1 copy-loss was 5.4 times more common than SF3B1 mutations, which occur in ~2% of all cancers (Supplementary file 1C), and mutations and copy-loss were mutually exclusive (p=0.007). Losses were more frequent in breast (20%), urothelial bladder (32%) and chromophobe kidney cancers (71%). Genomic deletions of SF3B1 typically affect most of the chromosome arm (81% of losses) and are never homozygous (0/10,570 cancers), consistent with characterization of SF3B1 as an essential gene (An and Henion, 2012; Isono et al., 2005). In contrast, 85% of genes are homozygously deleted at least once among the same 10,570 cancers. Similarly, analysis of copy number alterations from 1042 cancer cell lines in the CCLE indicated 24% of cell lines harbor partial SF3B1 deletion, including 16/61 (26%) of breast cancer cell lines, but never homozygous loss (0/1042 cell lines).
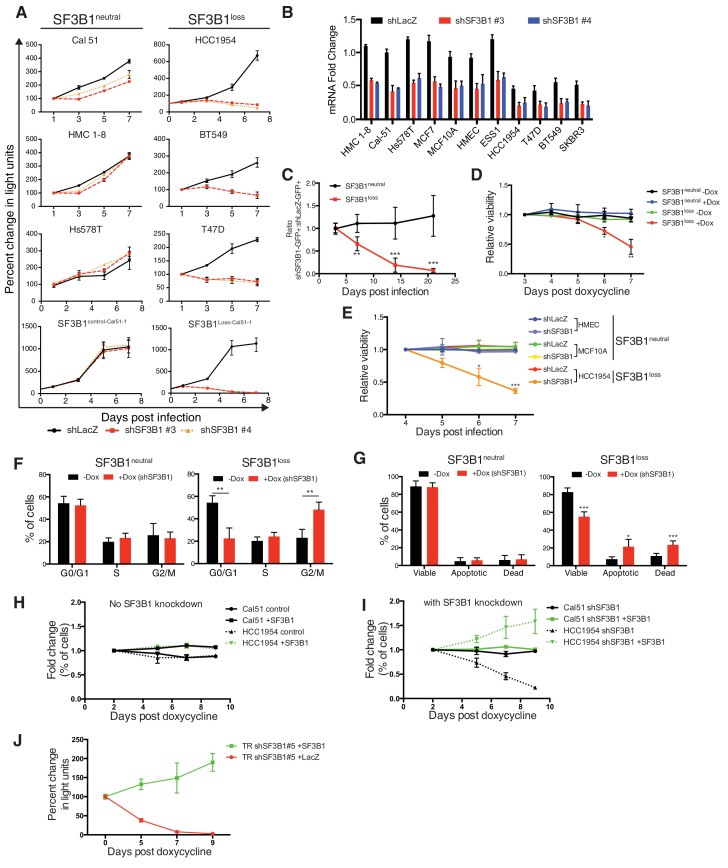
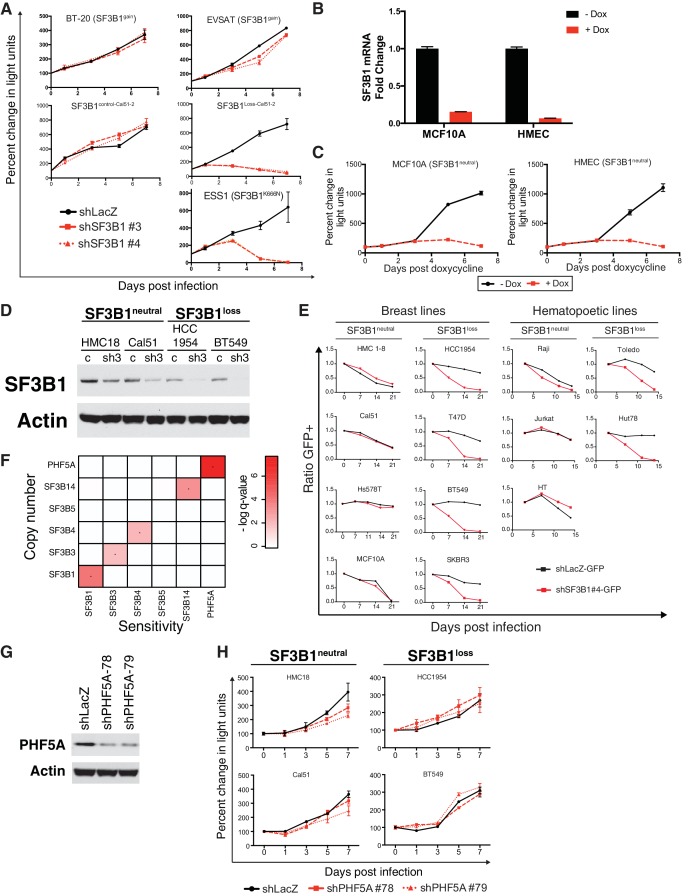
We established the vulnerability of SF3B1loss cells to SF3B1 suppression in both breast and hematopoietic lineages. We tested the proliferation of six breast lines after partial SF3B1 suppression, including three lines with SF3B1 copy-loss (SF3B1loss) and three without either loss or gain of the gene (SF3B1neutral). Upon partial SF3B1 suppression, SF3B1loss cells exhibited significant growth defects but SF3B1neutral cells or SF3B1gaincells did not (Figure 2A and Figure 2—figure supplement 1A). Growth defects observed in SF3B1loss cells included BT549, a near triploid cell line with two copies of SF3B1. Partial SF3B1 suppression also decreased the growth of ESS1, an endometrial cell line harboring an SF3B1K666N mutation (Figure 2A and Figure 2—figure supplement 1A). However, complete SF3B1 suppression resulted in growth defects even in SF3B1neutral cells (Figure 2—figure supplement 1B–C), consistent with previous work establishing SF3B1 as an essential gene.
Figure 2. Characterization of SF3B1 as a CYCLOPS gene.
(A) Growth of breast cancer cell lines expressing shLacZ (black) or shSF3B1 (red and orange), measured as changes in CellTiterGlo luminescence relative to one day post-infection. (B) Quantitative RT-PCR of SF3B1 expression from the indicated cell lines expressing shLacZ or shSF3B1 shRNAs normalized to the diploid SF3B1neutral cell line Cal51. (C) Ratio of cells expressing shSF3B1-GFP relative to uninfected controls, normalized to the ratio of cells expressing shLacZ-GFP relative to uninfected controls. Data represent averages from SF3B1neutral (n = 7) and SF3B1loss (n = 6) cell lines, using shSF3B1 #4 in Figure 2—figure supplement 2E. (D) Viability of cells expressing TR-shSF3B1#3 and TRshSF3B1#5, relative to viability three days post doxycycline administration. (E) Viability of cells expressing shLacZ or the average of shSF3B1#3 and shSF3B1#4, measured asthe fraction of propidium iodide negative cells, relative to the viability of these cells four days post infection. (F) Cell cycle distribution four days after SF3B1 suppression averaged from TR shSF3B1#3 and #5. (G) Fraction of apoptotic cells five days after SF3B1 suppression averaged from TR shSF3B1#3 and #5, as determined by AnnexinV/PI flow cytometry. (H) Change in ratio of cells expressing SF3B1-GFP relative to uninfected cells. (I) Ratio of cells expressing SF3B1-GFP to uninfected cells, in the context of endogenous SF3B1 suppression with TR-shSF3B1 #5. (J) Growth of LacZ and SF3B1 expressing SF3B1loss cells upon SF3B1 suppression (TR-shSF3B1#5), measured as changes in CellTiter-Glo luminescence. For all panels, *p<0.05 **p<0.01 ***p<0.001, and error bars represent ± SD from at least three (panels A–G) or two (H–J) replicates.
Figure 2—figure supplement 1. Characterization of SF3B1 as a CYCLOPS gene.
Figure 2—figure supplement 2. Further characterization of SF3B1 as a CYCLOPS gene.
The SF3B1 shRNAs used to unveil the CYCLOPS vulnerability targeted separate regions of the gene and resulted in partial SF3B1 knockdown across all eleven breast cell lines (Figure 2B). However, SF3B1loss cells had greater levels of knockdown due to lower SF3B1 expression at baseline, which was confirmed at the protein level in four of these lines by immunoblot (Figure 2—figure supplement 1D).
We also generated similar results in isogenic SF3B1loss cells derived from the SF3B1neutral cell line Cal51. We generated SF3B1loss cells using two independent CRISPR-Cas9 mediated methods of gene editing (see Materials and methods). The first line contained a frameshift mutation inactivating one SF3B1 allele (SF3B1Loss-Cal51-1). The second line had deletion of one copy of the SF3B1 locus, generated by co-expressing two sgRNAs: one upstream targeting a heterozygous SNP, and one downstream of SF3B1 (SF3B1Loss-Cal51-2). In both cases CRISPR-mediated SF3B1 loss resulted in decreased proliferation upon SF3B1 suppression relative to cells that were generated in parallel but did not produce inactivating alleles (SF3B1control-Cal51 cells; Figure 2A and Figure 2—figure supplement 1A).
We confirmed the vulnerability of the SF3B1loss cells to SF3B1 partial suppression using a GFP-competition assay in which we compared the proliferation rate of uninfected cells co-cultured with cells infected with a vector that co-expressed GFP and an shRNA targeting either LacZ or SF3B1. The expression of LacZ or SF3B1 shRNAs did not result in significant changes in proliferation of SF3B1neutral cells in seven cell lines, including the non-transformed mammary cell line, MCF10A (Figure 2C and Figure 2—figure supplement 1E). However, SF3B1loss cells expressing SF3B1 shRNAs were not compatible with long-term culture (Figure 2C and Figure 2—figure supplement 1E).
The SF3B1 CYCLOPS vulnerability is not recapitulated by suppression of other SF3b complex subunits, and copy number alterations of other SF3b complex genes do not confer susceptibility to SF3B1 suppression. We calculated the significance of associations between Achilles RNAi dependency data of six of the seven SF3b complex subunits (we lacked RNAi data for SF3B2) and copy numbers of the genes encoding them (Figure 2—figure supplement 1F). We identified associations between copy numbers of several SF3b subunits and sensitivity to suppressing that same subunit, consistent with our prior determination that multiple SF3b complex subunits are candidate CYCLOPS genes (Supplementary file 1B). However, we observed no associations between susceptibility to suppression of any of the SF3b complex genes and copy numbers of different SF3b subunits. Further, we confirmed one comparison where suppression of PHF5A, an SF3b complex gene, did not alter the growth of SF3B1loss cells (Figure 2—figure supplement 1G–H).
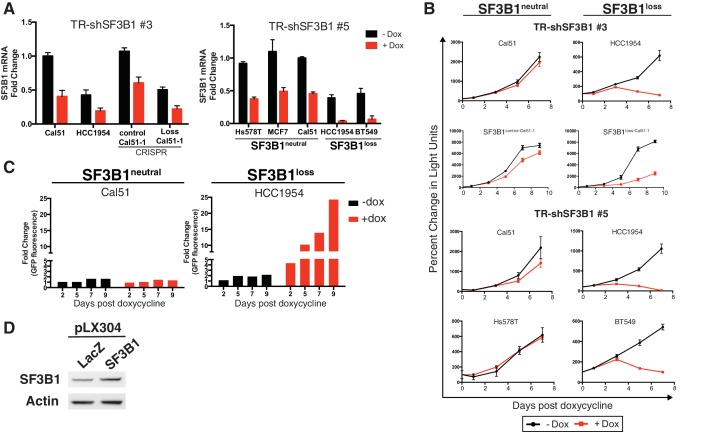
Partial suppression of SF3B1 leads to both cell cycle arrest and apoptosis in SF3B1loss but not SF3B1neutral lines. We generated cultures containing a tetracycline inducible system expressing hairpins targeting Luciferase or SF3B1 (TR-shSF3B1#3 and an additional hairpin, TR-shSF3B1#5, Figure 2—figure supplement 1A), enabling us to discriminate SF3B1 suppression from infection with shRNA vectors. Consistent with stable SF3B1 suppression, inducible SF3B1 suppression retards SF3B1loss cell growth and does not affect SF3B1neutral growth (Figure 2—figure supplement 1B) and reduces cell viability in SF3B1loss cells but not in SF3B1neutral cells (Figure 2D and E). SF3B1loss cells had significantly increased proportions of cells in G2/M phase after SF3B1 suppression, which did not occur in SF3B1neutral cells (Figure 2F). Subsequent to G2/M arrest, SF3B1loss cells further exhibited a significant induction in apoptosis as determined by increased number of AnnexinV/PI-positive cells that was not observed in SF3B1neutral cells (Figure 2G).
Expression of exogenous SF3B1 rescued the loss of viability in SF3B1loss cells, confirming the specificity of our shRNAs. We used a lentiviral construct encoding a codon-optimized SF3B1 ORF, which is resistant to shRNA suppression, fused to an IRES GFP sequence (SF3B1WT-IRES-GFP). When placed in competition, cells infected or not infected with SF3B1WT-IRES-GFP maintained constant ratios over 10 days (Figure 2H), suggesting that short-term expression of SF3B1 does not alter cellular fitness in either SF3B1neutral or SF3B1loss cells. Next, we concomitantly suppressed endogenous SF3B1 in all cells and expressed SF3B1WT-IRES-GFP in ~50% of cells. While SF3B1neutral cells were not affected by partial SF3B1 suppression, SF3B1loss cells expressing shSF3B1 were not compatible with long-term culture. However, SF3B1loss cells expressing both shSF3B1 and SF3B1WT-IRES-GFP persisted (Figure 2I), indicating that re-expression of SF3B1 is sufficient to prevent cell death. Furthermore, SF3B1loss cells expressing both shSF3B1 and SF3B1WT-IRES-GFP had a 20-fold increase in GFP fluorescence, suggesting that the exogenous SF3B1 construct was more highly expressed in SF3B1loss cells after suppression of endogenous SF3B1 (Figure 2—figure supplement 1C). Furthermore, stable exogenous SF3B1 expression is sufficient to restore the proliferation of SF3B1losscells expressing shRNAs targeting SF3B1 (Figure 2J and Figure 2—figure supplement 1D).
SF3B1neutral cells contain excess SF3B1 beyond the requirement for survival
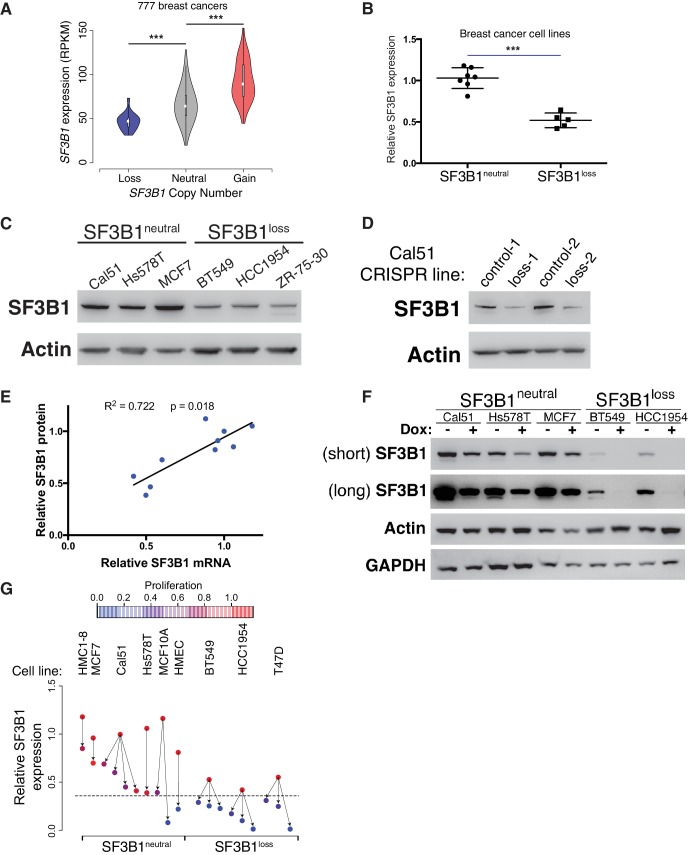
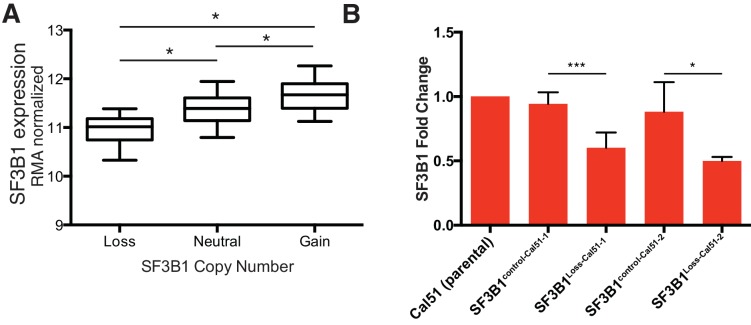
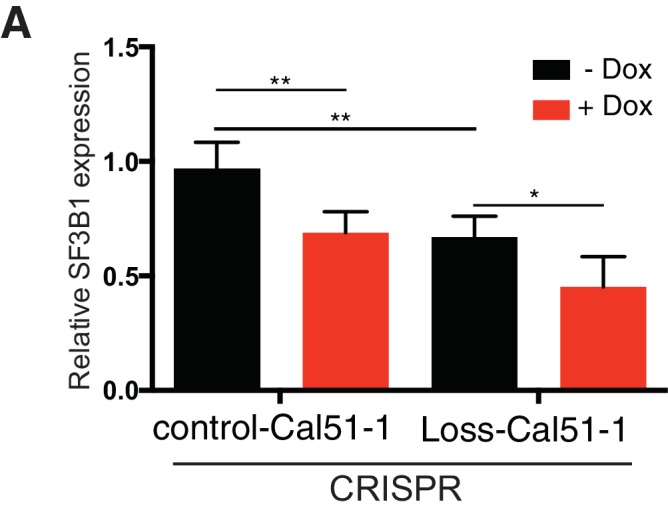
Analyses of SF3B1 mRNA indicate that SF3B1neutral cells tolerate partial SF3B1 suppression because they express more SF3B1 than the minimum amount needed for survival. In both TCGA breast adenocarcinoma data (Cancer Genome Atlas Network, 2012) and the Cancer Cell Line Encyclopedia, SF3B1neutral samples exhibited significantly higher expression of SF3B1 mRNA relative to SF3B1loss samples (Figure 3A and Figure 3—figure supplement 1A; Mann-Whitney p<10−4, for both datasets), suggesting excess mRNA over requirements for survival. We validated that SF3B1neutral breast cancer cell lines (n = 7) express approximately twice as much SF3B1 mRNA as SF3B1loss cells (n = 5) by quantitative PCR (Figure 3B; p<10−4). We also found similar SF3B1 expression changes between the SF3B1control-Cal51 and SF3B1Loss-Cal51 lines (Figure 3—figure supplement 1B).
Figure 3. SF3B1neutral cells contain excess SF3B1 beyond the requirement for survival.
(A) SF3B1 expression from 777 TCGA breast adenocarcinomas segregated by SF3B1 copy number. Whiskers represent min/max values and boxes represent upper and lower quartile ranges. Width of plots represents relative sample density. (B) Quantitative RT-PCR of SF3B1 expression in breast cancer cell lines. Data points represent individual cell lines, horizontal lines indicate means. (C) SF3B1 protein levels in breast cancer cell lines by immunoblot. (D) SF3B1 immunoblot from control cells and those with single-copy SF3B1 inactivation by CRISPR. (E) Scatterplot of SF3B1 mRNA and protein expression relative to diploid cell line Cal51 after normalization to actin in a panel of breast cancer cell lines (p=0.0018, R2 = 0.772, regression line slope = 0.789). (F) SF3B1 immunoblot from SF3B1neutral and SF3B1loss cells 4 days after TR-shSF3B1#5 induction by doxycycline. (G) Differences in proliferation 7 days after SF3B1 suppression (per CellTiter-Glo, see Appendix Methods; red=high, blue=low), against the relative level of SF3B1 expression (assessed by qPCR; y-axis) in SF3B1neutral (left) or SF3B1loss (right) cells expressing either shLacZ (origins of arrows) or shSF3B1 (ends of arrows). Origins with multiple arrows represent cell lines subject to more than one SF3B1 shRNA. Each data point represents the mean from at least two replicate experiments. The dashed line represents the estimated minimum threshold of SF3B1 expression required for survival. For all panels, *p<0.05 **p<0.01 ***p<0.001, and error bars represent ± SD.
Figure 3—figure supplement 1. Further characterization of SF3B1 as a CYCLOPS gene.
Reductions in SF3B1 mRNA expression were recapitulated at the protein level. Among breast cancer lines, we found increased SF3B1 protein expression in SF3B1neutral compared to SF3B1loss cells (Figure 3C) and SF3B1control-Cal51 vs. SF3B1Loss-Cal51 cells (Figure 3D). We also a found significant linear correlation between SF3B1 mRNA and protein expression (Figure 3E, p=0.0018, R2 = 0.772).
These observations suggest that SF3B1neutral cells tolerate partial SF3B1 suppression because moderate SF3B1 suppression leaves them with sufficient residual protein for survival. Indeed, we found detectable SF3B1 levels in SF3B1neutral cells after SF3B1 suppression, but failed to detect protein in SF3B1loss cells after SF3B1 suppression (Figure 3F and Figure 2—figure supplement 1D).
A systematic analysis of shRNA-induced mRNA suppression across SF3B1neutral and SF3B1loss lines indicated that SF3B1 mRNA levels can be reduced by ~60% from SF3B1neutral cell basal levels before proliferation and viability defects are apparent (Figure 3G). We suppressed SF3B1 using shRNAs with different potency to generate a range of SF3B1 suppression in SF3B1neutral and SF3B1loss cells, including shRNAs that suppress SF3B1 by >70% in SF3B1neutral cells, and determined the impact on cellular growth seven days after shRNA expression. Although similar reductions in SF3B1 expression were obtained in SF3B1neutral and SF3B1loss lines, the elevated basal levels of SF3B1 expression in SF3B1neutral lines enabled them to retain sufficient SF3B1 for proliferation despite shRNA expression, except in cases when SF3B1 suppression exceeded the 60% threshold of viability.
SF3B1 copy-loss selectively reduces the abundance of the SF3b complex
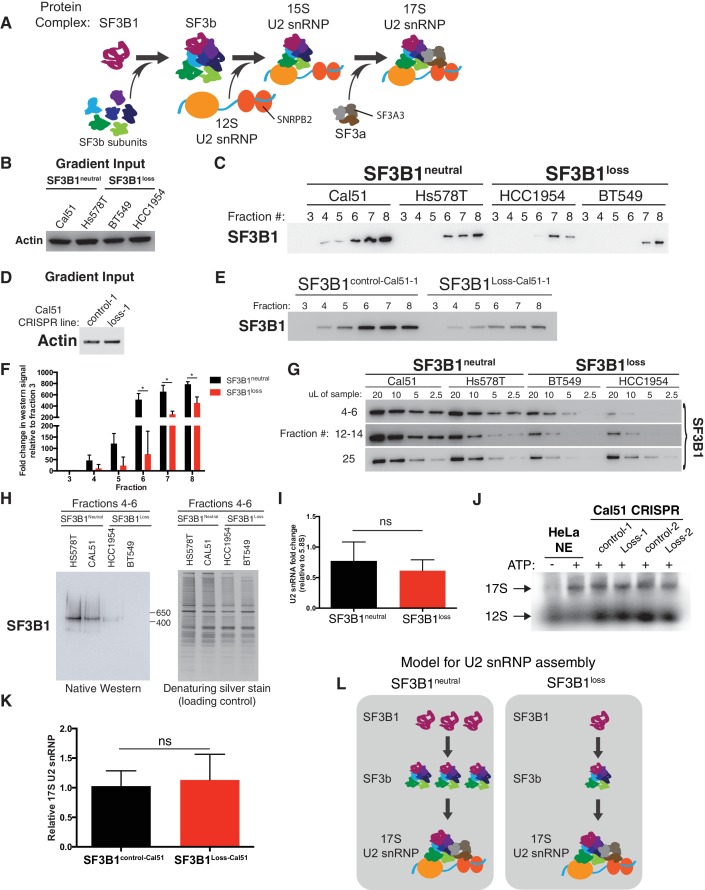
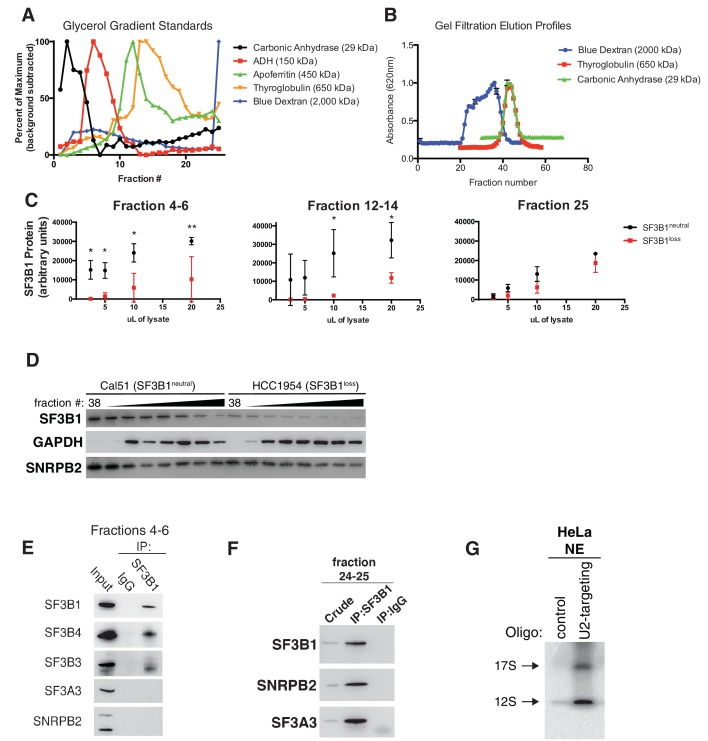
We next asked whether the reduction of SF3B1 protein expression in SF3B1loss cells preferentially altered specific SF3B1-containing complexes. SF3B1 is a component of the seven-member SF3b sub-complex of the U2 snRNP. Incorporation of SF3b into the U2 snRNP 12S ‘core’ forms the 15S U2 snRNP, which combines with SF3a to form the mature 17S U2 snRNP (Figure 4A) (Krämer et al., 1999; van der Feltz et al., 2012). We therefore interrogated expression levels of native SF3B1-containing complexes from whole-cell extracts by glycerol gradient sedimentation and gel filtration chromatography. We were able to resolve protein complexes from 29–650 kDa and 650–2,000 kDa using 10–30% glycerol gradients and Sephacryl S-500 gel filtration chromatography, respectively (Figure 4—figure supplement 1A–B). This enabled resolution of SF3B1-containing complexes ranging from monomers (155 kDa) to the SF3b sub-complex (450 kDa) to the 15S and 17S U2 snRNPs (790 and 987 kDa, respectively) (van der Feltz et al., 2012). We compared these elution profiles between patient-derived and isogenic SF3B1loss and SF3B1neutral cells.
Figure 4. SF3B1 copy-loss selectively reduces the abundance of the SF3b complex.
(A) Diagram of U2 snRNP assembly. (B–C) Glycerol gradient fractionation of native whole-cell lysates probed by western blot in breast cancer cell lines and (D–E) isogenic cells generated by CRISPR. (F) Quantification of SF3B1 immunoblots from glycerol gradient fractions 3–8, relative to fraction 3 (n = 3 for each group, see Appendix Methods). (G) Serial dilution of pooled glycerol gradient fractions probed for SF3B1 by immunoblot. (H) (left) SF3B1 Native PAGE immunoblot of pooled glycerol gradient fractions. (right) denaturing silver stain of total protein from the same pooled fractions as loading control. (I) Quantitative RT-PCR for U2 snRNA expression in three SF3B1neutral and three SF3B1loss breast cancer cell lines. (J) Native agarose gel of U2 snRNP complexes visualized with radiolabeled 2’ O-methyl oligonucleotides complementary to the U2 snRNA. Nuclear extracts were generated from SF3B1control-Cal51 and SF3B1Loss-Cal51 cells. HeLa cell nuclear extracts (NE) ± ATP were used as controls. Representative image from triplicate experiments. (K) Densitometric quantification of 17S U2 snRNP bands in (J) presented as fold change relative to SF3B1control-Cal51 cells. Data are from three replicate experiments. (L) Model for changes to U2 snRNP assembly associated with SF3B1 copy-loss. For all panels, *p<0.05, and error bars represent ± SD, ns = not significant.
Figure 4—figure supplement 1. SF3B1 copy-loss selectively reduces the abundance of the SF3b complex.
We observed significantly lower levels of SF3b in the SF3B1loss cells. The largest decreases in SF3B1-containing complexes in glycerol gradients were in fractions 4–8, corresponding to ~29–450 kDa (Figure 4B–F) and fractions 12–14, corresponding to ~450–650 kDa (Figure 4G and Figure 4—figure supplement 1C). We saw similar decreases in gel filtration chromatography fractions corresponding to complexes <650 kDa (Figure 4—figure supplement 1D). Native western blotting from the pooled glycerol gradient fractions 4–6 indicated the loss of a single SF3B1-containing complex of ~450 kDa (Figure 4H). SF3B1 immunoprecipitation from fractions 4–6 resulted in the co-precipitation of SF3b components SF3B3 and SF3B4 in SF3B1neutral cells, but not of U2 snRNP components SNRPB2 and SF3A3 (Figure 4—figure supplement 1E).
Conversely, it appears that U2 snRNP levels are only modestly decreased in SF3B1loss lines. Levels of SF3B1 in glycerol gradient fraction 25 (corresponding to >650 kDa) were not significantly decreased in SF3B1loss relative to SF3B1neutral lines (Figure 4G and Figure 4—figure supplement 1C). SF3B1 immunoprecipitation from fractions 24–25 resulted in co-precipitation of U2 snRNP components SNRPB2 and SF3A3 (Figure 4—figure supplement 1F). U2 snRNA levels are known to track with U2 snRNP levels, and we also did not observe a significant difference in U2 snRNA abundance between SF3B1neutral and SF3B1loss lines (Figure 4I p=0.35, two-tailed t-test). Similarly, visualization of U2 snRNP complexes using radiolabeled oligonucleotides complementary to the U2 snRNA did not demonstrate differences in 17S U2 snRNP abundance in SF3B1loss cells (Figure 4J–K and Figure 4—figure supplement 1G, p=0.68).
These observations suggest that copy-loss of SF3B1 only modestly affects U2 snRNP abundance but substantially decreases levels of U2 snRNP precursor complexes under steady-state conditions (Figure 4L).
SF3B1 suppression selectively reduces U2 snRNP abundance in SF3B1loss cells
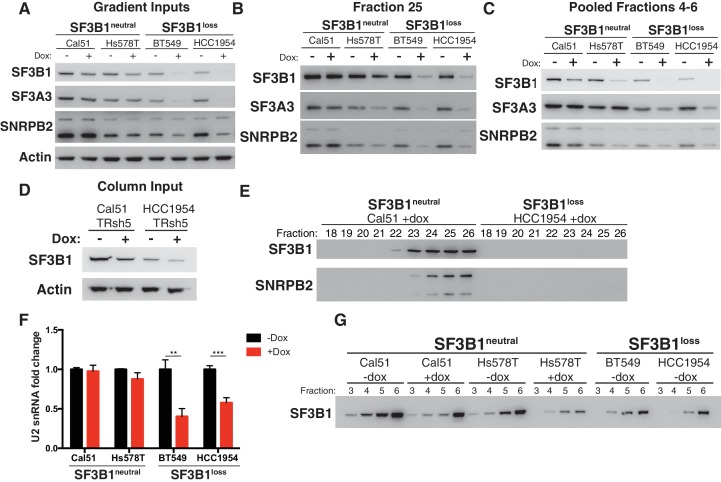
Partial suppression of SF3B1 leads to substantial reductions of U2 snRNP levels in SF3B1loss but not SF3B1neutral cells. Although such suppression results in reduced SF3B1 levels in both SF3B1loss and SF3B1neutral lines, only the SF3B1loss lines exhibit concomitant reductions in levels of U2 snRNP components SF3A3 and SNRPB2 (Figure 5A). Decreases in SF3A3 and SNRPB2 were observed in glycerol gradient fraction 25, corresponding to the U2 snRNP, most dramatically in SF3B1loss lines, and to a lesser extent in one of the SF3B1neutral lines (Hs578T; Figure 5B). Furthermore, after SF3B1 suppression, we detected both SF3B1 and SNRPB2 in Sephacryl-S500 fractions containing the >650 kDa protein complexes in SF3B1neutral cells but not in SF3B1loss cells (Figure 5D–E and Figure 5—figure supplement 1A). Quantitative PCR also indicated significantly reduced U2 snRNA expression after SF3B1 partial suppression in SF3B1loss cells but not in SF3B1neutral cells (Figure 5F).
Figure 5. Reduced spliceosome precursors and U2 snRNP abundance upon SF3B1 suppression in SF3B1loss cells.
(A) Western immunoblots without and with SF3B1 suppression prior to glycerol gradient fractionation. (B) Western immunoblots from glycerol gradient fraction 25 (protein complexes >650 kDa). (C) Western immunoblots from pooled glycerol gradient fractions 4–6 (protein complexes ~150–450 kDa). (D) Immunoblot from lysates prior to gel filtration chromatography. (E) Immunoblot of gel filtration fractions 18–26 (protein complexes >650 kDa) from lysates with SF3B1 suppression. (F) Quantitative RT-PCR for U2 snRNA expression without and with SF3B1 suppression. (G) Glycerol gradient fractions from SF3B1neutral cells without and with SF3B1 suppression compared to SF3B1loss without suppression. For all panels, TR-shSF3B1#5 was used. *p<0.05 **p<0.01 ***p<0.001.
Figure 5—figure supplement 1. Reduced spliceosome precursors and U2 snRNP abundance upon SF3B1 suppression in SF3B1loss cells.
In contrast, suppression of SF3B1 in SF3B1neutral cells appears to substantially decrease levels of SF3b, but not the U2 snRNP. SF3B1 suppression in SF3B1neutral cells only modestly reduced SF3B1 in fraction 25 (Figure 5B and Figure 5—figure supplement 1B) but instead preferentially reduced SF3B1 from fractions 4–6 (Figure 5C and Figure 5—figure supplement 1C). Further, no changes in SF3A3 or SNRPB2 expression were observed in total protein from glycerol gradient inputs (Figure 5A) or U2 snRNA expression (Figure 5F). Therefore, we determined if SF3B1 suppression in SF3B1neutral cells phenocopies the reduced SF3b observed in unperturbed SF3B1loss cells. Indeed, SF3B1neutral cells with SF3B1 suppression reduced SF3b levels in glycerol gradient fractions 3–6 approximately to the levels observed in SF3B1loss cells (Figure 5G). Taken together, these data suggest that the elevated levels of the SF3b sub-complex in SF3B1neutral cells relative to SF3B1loss cells appear to buffer SF3B1neutral cells from reductions in viability following partial SF3B1 suppression.
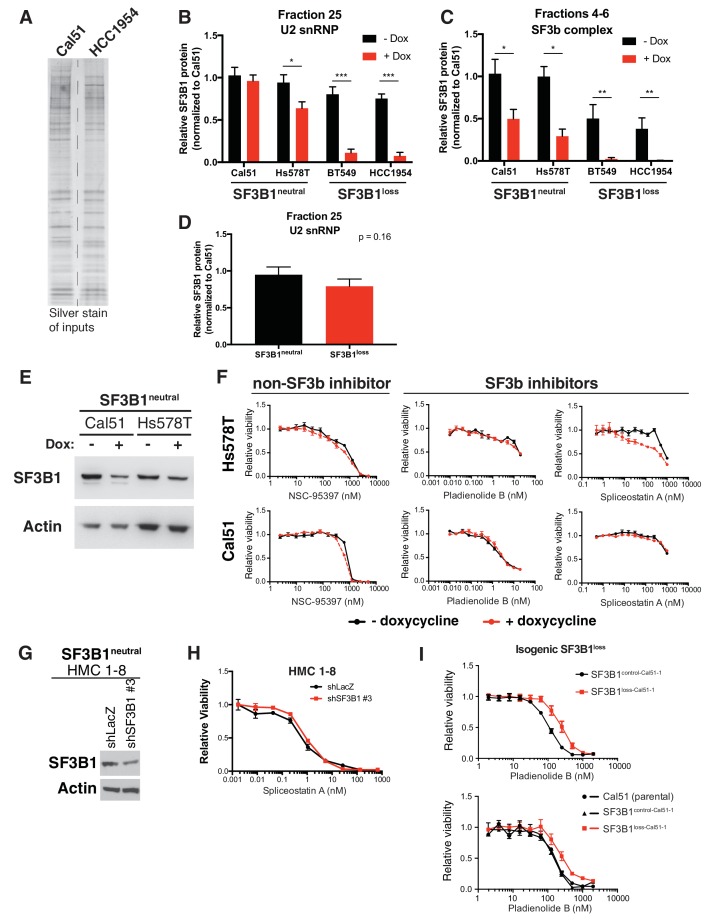
Consistent with Figure 4, SF3B1loss cells without SF3B1 suppression did not have significantly lower levels of U2 snRNP in fraction 25 than SF3B1neutral cells (p=0.16, Figure 5—figure supplement 1D), suggesting SF3B1 copy-loss only reduces levels of the U2 snRNP following further depletion of SF3B1.
The relative preservation of the U2 snRNP and larger complexes in SF3B1loss cells without SF3B1 suppression suggests existing SF3b inhibitors might not exploit the specific vulnerability exhibited by SF3B1loss cells. SF3b inhibitors modulate U2 snRNP function or subsequent steps during splicing catalysis (Corrionero et al., 2011; Folco et al., 2011; Roybal and Jurica, 2010), thereby altering splicing leading to cell death. With similar U2 snRNP levels in SF3B1loss and SF3B1neutral cells, the dose at which these effects would be expected to accrue might be similar.
We tested this hypothesis by exposing SF3B1neutral cell lines with partial SF3B1 suppression, and controls to treatment with two SF3b-targeting compounds (Spliceostatin A, and Pladienolide B) and with NSC95397, a compound reported to inhibit splicing activity by an SF3b-independent mechanism (Berg et al., 2012). None of these exhibited increased effects on cells with partial SF3B1 suppression. (Figure 5—figure supplement 1E–H). We also evaluated isogenic Cal51 cells with engineered SF3B1 copy-loss and did not observe enhanced sensitivity of SF3B1loss-Cal51 cell lines (Figure 5—figure supplement 1I).
Partial SF3B1 suppression results in splicing defects in SF3B1loss cells
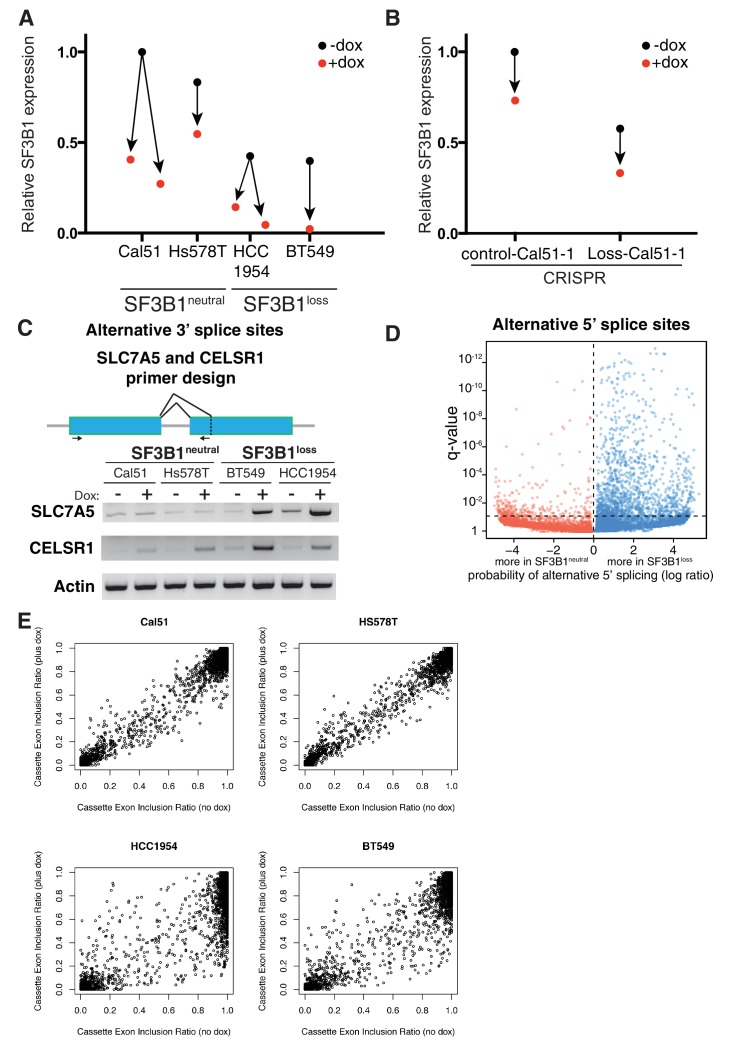
SF3B1 is well-established as a splicing factor (Gozani et al., 1998; Zhou et al., 2002), and intron retention has been reported upon treatment of cells with SF3B1 inhibitors (Kotake et al., 2007) while patients harboring SF3B1 mutations display alterations in alternative splicing (DeBoever et al., 2015; Wang et al., 2011). We therefore quantified the extent of splicing disruption upon SF3B1 suppression in SF3B1neutral and SF3B1loss cells by RNA sequencing. RNA was isolated 4 days after doxycycline treatment when SF3B1loss cells arrest in G2/M phase of the cell cycle (Figure 2F), but have not initiated apoptosis (Figure 2G). We suppressed SF3B1 in SF3B1neutral cells to similar or lower levels as seen at steady state in SF3B1loss cells, and suppressed SF3B1 in SF3B1loss cells to even lower levels (Figure 3F and Figure 6—figure supplement 1A–B). We used juncBase (Brooks et al., 2011) and a novel statistical framework to analyze 50,600 splice junctions for intron retention in SF3B1neutral and SF3B1loss cells upon SF3B1 suppression from our RNA sequencing data. Briefly, we calculated the ratio of percent spliced in (PSI) and spliced out read counts for each splicing junction, but accounted for the probability that any single splicing junction may not be accurately sampled in each cell line using a beta binomial distribution (see Appendix Methods).
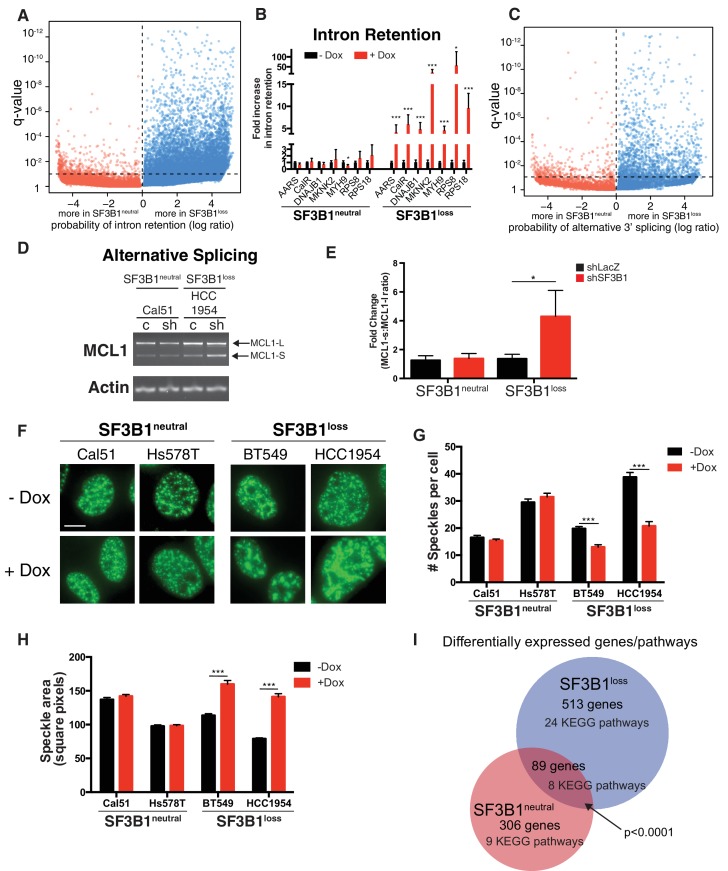
All cells showed evidence of increased intron retention following SF3B1 partial suppression (p<10−5), but splicing was significantly more affected in SF3B1loss cells. Upon SF3B1 suppression, 7353 transcripts in SF3B1loss cells showed evidence of significantly (q < 0.1) increased intron retention relative to SF3B1neutral cells, whereas only 454 transcripts showed evidence of increased intron retention in the reverse direction (Figure 6A, p<10−1110).
Figure 6. Partial SF3B1 suppression results in splicing defects in SF3B1loss cells.
(A) Statistical significance of intron retention (see Materials and methods) across all exon-intron junctions (dots) in SF3B1neutral (red) and SF3B1loss cells (blue) after SF3B1 suppression. The horizontal dashed line represents the significance threshold (q < 0.01) and the vertical dashed line segregates intron-exon junctions more likely to be altered in SF3B1neutral (left) or SF3B1loss cells (right). (B) qPCR for a single intron within the indicated gene without and with shSF3B1 induction by doxycycline (SF3B1neutral n = 3, SF3B1loss n = 3, averaged from TR-shSF3B1#3 and TRshSF3B1#5. SF3B1control-Cal51 and SF3B1Loss-Cal51 n = 2 each, averaged from TR-shSF3B1#3). (C) Statistical significance of alternative 3’ splice site selection (see Materials and methods) across 3’ splice junctions (dots) in SF3B1neutral (red) and SF3B1loss cells (blue) after SF3B1 suppression (as in panel A). (D) Representative RT-PCR from SF3B1neutral and SF3B1loss cells after SF3B1 knockdown. ‘c’ represents LacZ control hairpins, ‘sh’ represents shSF3B1#4. Arrows represent product sizes for MCL-L and MCL-S. (E) Densitometric quantification of the ratio of MCL1-S:MCL1-L, relative to shLacZ-expressing controls (mean ± SD, n = 3 per group averaged from shSF3B1#3, and #4). (F) Immunofluorescent images of nuclear speckles by anti-SC35 (SRSF2) staining. Scale bar = 5 uM. (G) Quantification of number of nuclear speckles and (H) speckle area per cell across at least 100 nuclei. For (F–H) TRshSF3B1#5 was used. (I) Number of differentially expressed genes upon SF3B1 suppression (q < 0.1) and the number of enriched KEGG pathways amongst indicated gene set (q < 0.05). For all panels, *p<0.05 **p<0.01 ***p<0.001.
Figure 6—figure supplement 1. Partial SF3B1 suppression results in splicing defects in SF3B1loss cells.
We confirmed increased intron retention in SF3B1loss cells upon SF3B1 suppression by qPCR amplifying selected introns of genes from the RNA sequencing analysis (Figure 6A). Introns were significantly retained in all seven genes analyzed (AARS, CALR, DNAJB1, MKNK2, MYH9, RPS8 and RPS18), which included DNAJB1, a gene previously known to be improperly spliced in cells treated with SF3B1 inhibitors (Kotake et al., 2007), and cell essential genes AARS, RPS8 and RPS18 (Figure 6B).
The SF3b complex is known to regulate 3’ splice site selection (DeBoever et al., 2015). We therefore analyzed 30,666 alternative 3’ splice sites from the RNAseq data in SF3B1neutral and SF3B1loss cells. Reduced SF3B1 expression resulted in significantly more alternative 3’ splice site selection in SF3B1loss cells (353 3’ splice junctions in SF3B1neutral vs. 1540 in SF3B1loss cells, p<10−121, Figure 6C and Figure 6—figure supplement 1C). We also observed other alterations in splicing. Alternative 5’ splice site selection occurred at a significantly higher rate upon SF3B1 suppression in SF3B1loss cells (1411 junctions vs 317, p=9×10−165, Figure 6—figure supplement 1D). We also observed increased dysregulation of cassette exon inclusion. The proportion of reads including the cassette exon at each junction changed substantially after SF3B1 suppression in SF3B1loss cells, but was less substantially altered in SF3B1neutral cells. (Figure 6—figure supplement 1E). We further validated these observations with independent assays for alternative splicing. Specifically, the ratio between alternative long and short isoforms of MCL1 (that respectively do or do not have anti-apoptotic functions) is known to be regulated by SF3B1 (Moore et al., 2010). After SF3B1 suppression, this ratio was significantly biased towards the short isoform in SF3B1loss cells relative to SF3B1neutral cells (Figure 6D–E). Together, these data indicate that SF3B1 suppression more substantially dysregulates splicing of the transcriptome of SF3B1loss cells.
Spliceosome components, including SF3B1, are thought to assemble and function in sub-nuclear compartments known as nuclear speckles (Spector and Lamond, 2011). Inhibition of splicing or transcription has been shown to induce formation of enlarged ‘mega-speckles’ (Kotake et al., 2007; Loyer et al., 1998). We therefore performed an unbiased quantification of the number and size of SC-35+ speckles per nucleus using a custom image analysis pipeline with CellProfiler software (Kamentsky et al., 2011).
SF3B1neutral cells did not display changes in SC-35+ speckles after SF3B1 partial suppression, but SF3B1loss nuclei contained significantly fewer speckles and increased speckle area (Figure 6F–H). The presence of defective alternative splicing, intron retention and formation of mega-speckles uniquely in SF3B1loss cells after partial SF3B1 suppression further supports the gross defects in splicing observed by RNA sequencing.
Moreover, upon SF3B1 suppression, 513 genes were differentially expressed at an FDR < 10% in SF3B1loss cells and only 306 genes were differentially expressed in SF3B1neutral cells (Supplementary file 1E, p<10−4, Fischer’s exact test). Gene set enrichment analysis revealed 24 KEGG pathways significantly enriched in SF3B1loss cells and only nine pathways altered in SF3B1neutral cells (Figure 6I and Supplementary file 1F). We also identified a statistically significant core set of 89 genes differentially expressed across all cell lines upon SF3B1 suppression regardless of SF3B1 copy number (p<10−4).
Upon SF3B1 expression, 348 genes were differentially expressed in SF3B1loss cells and 393 genes were differentially expressed in SF3B1neutral cells, an insignificant difference (p=0.07, Supplementary file 1G). We observed more differentially expressed genes in SF3B1loss cells from SF3B1 suppression than from SF3B1 expression (p<0.0001), however, there was no difference between the effects of SF3B1 suppression and expression in SF3B1neutral lines (p=0.7). Taken together, these data indicate that partial SF3B1 suppression more severely impacts the transcriptome of SF3B1loss cells.
Suppression of SF3B1 reduces tumor growth in SF3B1loss xenografts
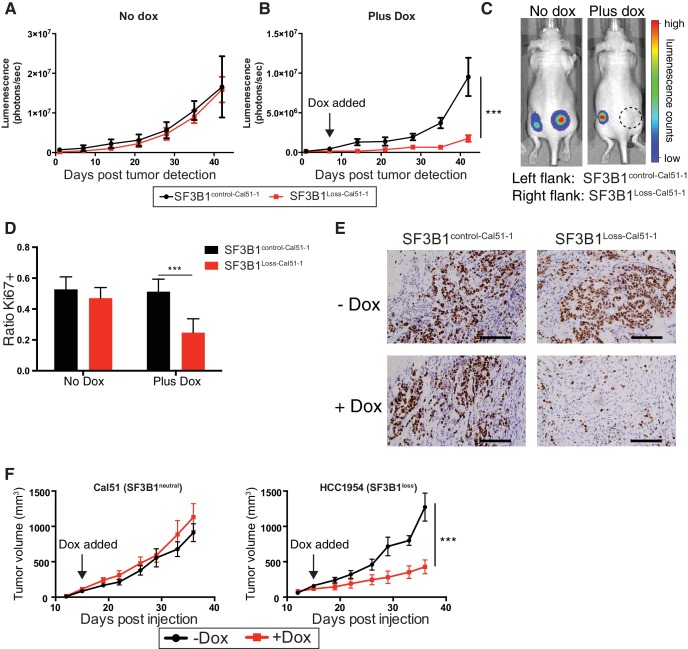
To test the effects of SF3B1 partial suppression in vivo, we generated xenografts from luciferase-labeled SF3B1Loss-Cal51-1, SF3B1control-Cal51-1 cells and naturally occurring SF3B1neutral and SF3B1loss cells (Cal51 and HCC1954, respectively) all containing TR-shSF3B1#3. Interventional studies were performed where animals were placed on doxycycline upon detection of palpable tumors and validated for SF3B1 suppression (Figure 7—figure supplement 1A). SF3B1Loss-Cal51-1 and SF3B1control-Cal51-1 cells generated tumors of similar volume in the absence of doxycycline (Figure 7A; p=0.7, repeated measures ANOVA). However, partial suppression of SF3B1 reduced the growth of (Figure 7B–C) and number of proliferative Ki67+ cells in (Figure 7D–E) xenografts from SF3B1Loss-Cal51-1 cells but not SF3B1control-Cal51-1 cells (p=0.001 for both assays). Similarly, reduced tumor growth was observed in naturally occurring SF3B1loss HCC1954 xenografts and not in SF3B1neutral Cal51 xenografts (Figure 7F).
Figure 7. SF3B1 suppression inhibits tumor growth in vivo.
Luminescent quantification of xenograft growth from SF3B1control-Cal51-1 (black) and SF3B1Loss-Cal51-1 (red) tumors (A) without doxycycline (n = 4) and (B) with doxycycline (n = 17) using TR-shSF3B1 #3. (C) Representative animal images overlaid with heat maps from bioluminescent tumor detection. Dashed circle represents region where established tumor was detected prior to doxycycline treatment. (D) Quantification of Ki67+ cells from xenografts 42 days post tumor detection using CellProfiler ≥ 2440 nuclei were scored for each tumor, ≥ 3 tumors per group (see Materials and methods). (E) Representative Ki67 immunohistochemistry images of xenografts quantified in panel (D). (F) Growth of established tumors for Cal51 and HCC1954 xenografts without doxycycline (black) or with doxycycline (red) using TR-shSF3B1 #3. For Cal51 and HCC1954 no doxycycline groups (n = 13); plus doxycycline groups (n = 12). For all panels, ***p≤0.001.
Figure 7—figure supplement 1. SF3B1 suppression inhibits tumor growth in vivo.
Compounds that induce degradation of SF3B1 selectively kill SF3B1loss cells
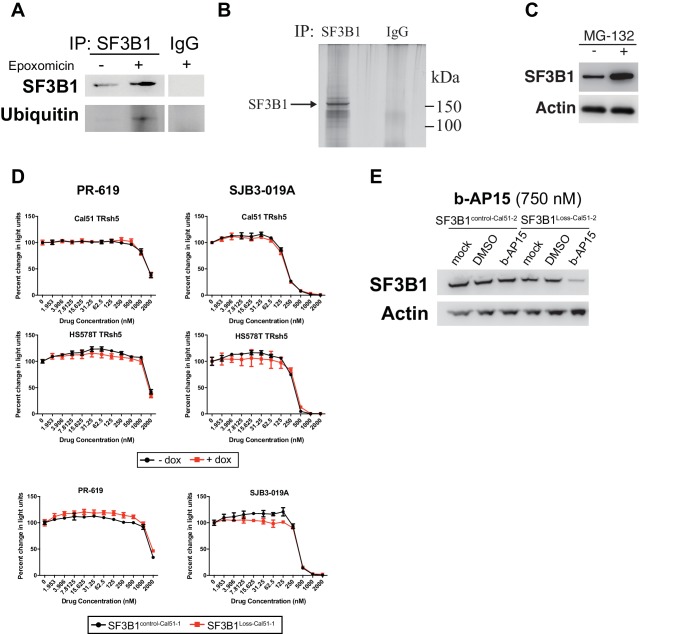
The lack of efficacy of small molecule splicing modulators targeting SF3B1 prompted us to evaluate other compounds that could pharmacologically target the SF3B1 CYCLOPS dependency. Deubiquitinase inhibitors (DUBi’s) are a class of compounds that increase protein degradation by preventing the removal of ubiquitin from substrates, thereby enhancing target protein degradation by the proteasome. We first sought evidence for SF3B1 ubiquitination by treating cells with the proteasome inhibitor, epoxomicin, to increase the accumulation of ubiquitinated proteins. Immunoprecipitation of SF3B1 in denaturing conditions after epoxomicin treatment resulted in the detection of ubiquitinated SF3B1 (Figure 8—figure supplement 1A–B). Furthermore, proteasome inhibition by MG-132 increased SF3B1 protein levels, suggesting SF3B1 is regulated by the proteasome (Figure 8—figure supplement 1C).
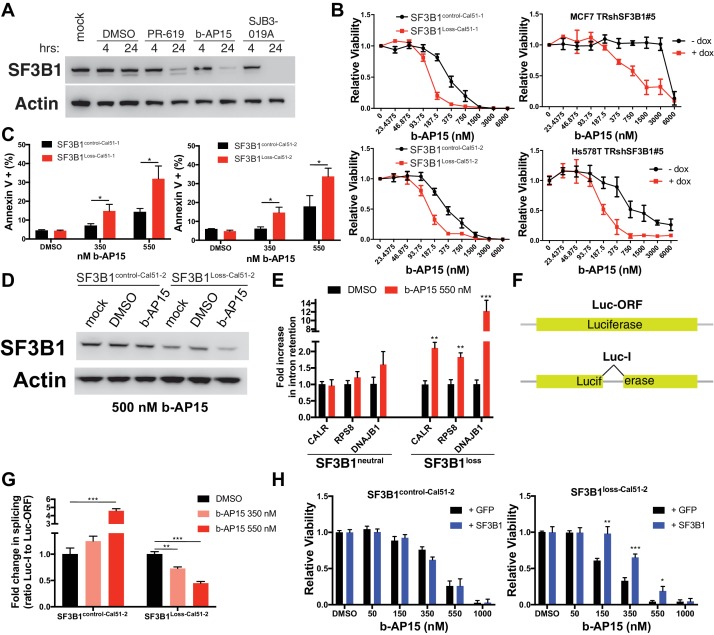
To determine if DUBi’s could decrease SF3B1 protein expression, we evaluated seven candidate DUBi’s for reduced SF3B1 expression by western blot (data not shown) and identified three DUBi’s with the ability to reduce SF3B1 protein levels within 24 hr (Figure 8A). Of the 3 DUBi’s that enhance SF3B1 degradation, one semi-selective DUBi b-AP15 (D'Arcy et al., 2015), demonstrated enhanced sensitivity in SF3B1loss cells, and also cells with reduced SF3B1 expression by RNAi (Figure 8B). The enhanced sensitivity in SF3B1loss cells or cells with reduced SF3B1 expression by RNAi was not observed upon treatment with SJB3-019A or the pan-DUBi, PR-619 (Figure 8—figure supplement 1D), suggesting inhibition of a specific DUB enzyme may mediate this effect. SF3B1Loss-Cal51 cells also had more Annexin V apoptotic cells than SF3B1control-Cal51 cells when treated with nanomolar concentrations of b-AP15 (Figure 8C). Immunoblots for SF3B1 after b-AP15 treatment revealed decreased SF3B1 only occurred in SF3B1Loss-Cal51-2 cells (Figure 8D and Figure 8—figure supplement 1E). These data suggest the enhanced sensitivity may be due, in part, to reduction of SF3B1 in SF3B1Loss-Cal51 cells.
Figure 8. Deubiquitinase inhibitor b-AP15 can induce SF3B1 degradation and selectively kill SF3B1loss cells.
(A) SF3B1 immunoblot after DUBi treatment of the SF3B1neutral cell line, Cal51, at the indicated time points. (B) b-AP15 dose response curves in isogenic cell contexts. SF3B1control-Cal51 and SF3B1Loss-Cal51 or SF3B1neutral cells with or without doxycycline expressing TR-shSF3B1 #5, to phenocopy the reduced SF3B1 expression observed in SF3B1loss cells, were assayed 48 hr after b-AP15 treatment. (C) Percent of Annexin V positive cells 24 hr after b-AP15 treatment in SF3B1control-Cal51 and SF3B1Loss-Cal51 cells. (D) SF3B1 immunoblot 48 hr after treatment with 500 nM b-AP15 in SF3B1control-Cal51-2 and SF3B1Loss-Cal51-2 cells. (E) qPCR for a single intron within the indicated gene with 550 nM b-AP15 or DMSO control (SF3B1neutral n = 2, SF3B1loss n = 2, averaged from SF3B1control-Cal51 and SF3B1Loss-Cal51 cells). (F) Schematic of luciferase reporter constructs used in (G). Yellow rectangles represent luciferase protein coding regions. Angled black line represents the location of the intron. (G) Fold change in luciferase splicing reporter signal after b-AP15 treatment. Data represented as the ratio of spliced luciferase signal (Luc-I) to luciferase ORF signal (Luc-ORF) relative to their respective DMSO luciferase signal. DMSO treatment (black), 350 nM b-AP15 (light red) and 550 nM b–AP15 (dark red). (H) b-AP15 dose response in SF3B1control-Cal51-2 and SF3B1Loss-Cal51-2 cells expressing GFP (black) or SF3B1 (blue). For all panels, *p<0.05 **p<0.01 ***p<0.001.
Figure 8—figure supplement 1. Deubiquitinase inhibitor b-AP15 can induce SF3B1 degradation and selectively kill SF3B1loss cells.
Treatment of cells with b-AP15 resulted in splicing alterations preferentially in SF3B1loss cells. We determined the effect of b-AP15 treatment on previously identified splicing alterations that result from SF3B1 suppression. SF3B1loss cells but not SF3B1neutral cells exhibited increased intron retention in CALR, RPS8 and DNAJB1 after treatment with 550 nM b-AP15 (Figure 8E). We also generated stable luciferase expressing cell lines with either a luciferase gene interrupted by a chimeric globin/immunoglobulin intron (Luc-I), or a luciferase open reading frame that does not require splicing as a control (Luc-ORF) (Figure 8F) (Younis et al., 2010). b-AP15 treatment resulted in a dose-dependent decrease in the ratio of Luc-I:Luc-ORF in SF3B1loss-Cal51-2 cells, but not SF3B1control-Cal51-2 cells, suggesting b-AP15 induced SF3B1 degradation may mediate splicing reporter loss of function (Figure 8G). In contrast, b-AP15 also enhanced SF3B1control-Cal51-2 splicing reporter signal. Lastly, rescue experiments in which we expressed exogenous SF3B1 increased the concentration of b-AP15 required to impact cell viability in SF3B1loss cells, but did not affect the sensitivity of SF3B1control-Cal51-2 cells (Figure 8H).
Taken together, these results suggest that the DUBi, b-AP15, can decrease SF3B1 stability with increased sensitivity in SF3B1loss cells. They also suggest DUBi’s as a potential class of small molecules to be used as a general approach to target candidate CYCLOPS gene dependencies identified here.
Discussion
Our analysis indicates that CYCLOPS vulnerabilities are the most enriched class of copy-number associated cancer vulnerabilities, and a focused analysis of this class of vulnerabilities identified 124 candidate CYCLOPS genes. In previous work involving 86 cell lines (Nijhawan et al., 2012), we had identified 55 candidate CYCLOPS genes at a q < 0.25 significance threshold. Here, we evaluated over twice as many cell lines (179), generating more than twice as many candidate CYCLOPS genes (124) at a more stringent significance threshold (q < 0.1). We also identified trans gene dependencies associated with copy gain, but the regions of copy gain are often large and contain many genes. As a result, it is difficult to assign a specific gene within the gained region as causing the dependency when gained. Nonetheless these classes of copy number associated gene dependencies warrant further investigation.
Our enhanced ability to detect candidate CYCLOPS genes with larger sample sizes suggests that analysis of additional lines is likely to reveal more candidates. For example, we were unable to identify tumor-type specific CYCLOPS genes due to the relatively small numbers of cell lines screened in each cell lineage. In addition, detection of CYCLOPS vulnerabilities requires partial gene suppression, in which the optimal level of suppression may vary by gene. Among SF3B1 shRNAs, ~50% suppression was achieved. We do not know the extent to which the shRNAs used in Project Achilles matched the required levels to expose CYCLOPS vulnerabilities across other genes. These limitations suggest expanding RNAi viability screens to include more cancer cell lines and shRNAs may yield further CYCLOPS dependencies.
The candidate CYCLOPS genes we identified shared the following features: (1) consistent expression across normal tissues, (2) altered expression when affected by copy-number alterations suggesting lack of feedback regulation, (3) location in genomic regions that frequently undergo copy-loss. These features may predispose genes towards meeting CYCLOPS criteria. However, we cannot exclude the possibility that CYCLOPS genes with different features exist but were not identified due to the limitations of the screening data or analyses.
Components of the spliceosome were the most frequently represented genes among CYCLOPS candidates, with 20 representatives, including SF3B1. The spliceosome, which is essential for cell survival, has previously been identified as a therapeutic target in cancer (Kaida et al., 2007; Kotake et al., 2007; Mizui et al., 2004; Webb et al., 2013). Also, the magnitude of SF3B1 copy-loss required to unveil the SF3B1 CYCLOPS dependency (e.g. single copy loss in a tetraploid cell) will require further study. Our work further substantiates the importance of the spliceosome as a therapeutic target in cancer, and suggests CYCLOPS vulnerabilities as a possible mechanism of dependency.
Mutation of the spliceosome components SF3B1 and U2AF1 are recurrent driver events in many cancer types including chronic lymphoblastic leukemia, myelodysplastic syndrome, uveal melanoma and breast cancer (Ellis et al., 2012; Harbour et al., 2013; Imielinski et al., 2012; Papaemmanuil et al., 2011; Wang et al., 2011; Yoshida et al., 2011). Recent evidence demonstrated that mutations in SF3B1 and SRSF2 can confer preferential sensitivity to chemical modulation of the spliceosome (Lee et al., 2016; Obeng et al., 2016). In contrast, we observed partial copy-loss of SF3B1 and U2AF1, likely the result of passenger copy-number alterations, resulted in CYCLOPS vulnerabilities. Consistent with our observations, recent studies of Sf3b1+/- mice suggest that partial SF3B1 loss does not generate haploinsufficient phenotypes (Matsunawa et al., 2014; Wang et al., 2014) in contrast to previous data (Visconte et al., 2012). Our observation that ESS1, a SF3B1K666N mutant cell line, was sensitive to partial SF3B1 suppression is consistent with a prior report that SF3B1-mutant cancer cells were found to depend on remaining wild-type copy (Zhou et al., 2015). Mutant SF3B1 is also associated with aberrant 3’ splice site selection and ~50% rate of nonsense mediated decay in processed transcripts, suggesting that those transcripts exhibit partial loss of function (Darman et al., 2015). Taken together, SF3B1 mutations may be associated with CYCLOPS dependencies, at least in some cases. Therefore, it is possible that similar approaches to targeting the spliceosome can be exploited in SF3B1-mutant and SF3B1loss cancers. However, it is also possible that alternative strategies will be required for SF3B1-mutant and SF3B1loss cancers, due to their different effects on spliceosome assembly and activity.
We found that partial SF3B1 suppression is tolerated in SF3B1neutral cells due to a stable pool of SF3b sub-complex outside of the U2 snRNP. To our knowledge, this is the first observation of such a pool of SF3b, and raises the possibility that SF3b has functions in addition to its role in the U2 snRNP. Precedence exists for such functions as SF3B1 is reported to be a component of the polycomb repressor complex and also directly associates with nucleosomes (Isono et al., 2005; Kfir et al., 2015). We also observed decreased protein levels of SNRPB2, SF3A3 and the U2 snRNA in SF3B1loss cells after SF3B1 suppression (Figure 5A and F). It is possible that due to the decreased amount of assembled 17S U2 snRNP, the U2 precursor complexes are less stable and degraded to maintain proper U2 snRNP stoichiometry in SF3B1loss cells. Although these experiments were performed prior to detection of apoptosis, we cannot exclude the possibility that decreased U2 precursor complexes are a result of decreased cell viability beyond the level of detection.
Small molecule inhibitors of SF3B1, and the spliceosome in general, are an emerging class of anti-neoplastic agents. The finding that many candidate CYCLOPS genes are splicing factors suggests further efforts should be paid to identifying CYCLOPS vulnerabilities that can be exploited by spliceosome inhibitors.
In the case of SF3B1, we find that SF3B1 copy-loss reduces the levels of the SF3b complex, but not assembled U2 snRNP, which suggests that inhibitors of the assembled U2 snRNP will not adequately distinguish between SF3B1loss and SF3B1neutral cells. This includes most current inhibitors of SF3B1 (Corrionero et al., 2011; Folco et al., 2011; Roybal and Jurica, 2010). Understanding which SF3B1 complexes are bound by these compounds, and how they affect the stability, assembly, or function of the U2 snRNP, will be important to glean mechanistic insight into the landscape of small molecule modulation of SF3B1.
More generally, many CYCLOPS vulnerabilities are unlikely to be exploited by compounds that directly inhibit CYCLOPS gene enzymatic activity. Most of the candidate CYCLOPS genes we identified are not enzymes. Many of them are components of multi-protein complexes. One approach to exploiting these vulnerabilities may be to disrupt the incorporation of the proteins encoded by such CYCLOPS genes into these larger complexes. Another approach may be to reduce levels of protein encoded by CYCLOPS genes, either by interfering with the transcription of these genes (Arrowsmith et al., 2012; Kwiatkowski et al., 2014) or by enhancing protein degradation (Bondeson et al., 2015; D'Arcy et al., 2015; Winter et al., 2015). An advantage to CYCLOPS targets such as SF3B1 is that only moderate (~50%) reductions in protein levels need to be achieved to take advantage of the vulnerability.
Finally, we evaluated DUBi’s as a potential small molecule to target the SF3B1 CYCLOPS vulnerability. We found that the DUBi b-AP15 could reduce SF3B1 protein levels and preferentially target SF3B1loss cells. A derivative of b-AP15, VLX1570, is already in use in humans (Trial ID: NCT02372240). Our results indicate SF3B1 copy number should be tested as a potential biomarker of response for patients treated with this compound.
Although b-AP15 specifically suppressed growth of cells with loss of SF3B1, it is possible other DUBi’s would be even more specific. There are approximately 90 DUBs in humans (Nijman et al., 2005), and the DUBi’s we tested are relatively non-selective. Further investigation of the specific DUBs that support SF3B1 protein expression would enable identification DUBi’s whose effects are more targeted to the SF3B1 dependency.
The finding that a DUBi specifically suppresses growth of cells with loss of SF3B1 also supports the use of DUBi’s to target any of the 124 candidate CYCLOPS genes we identified, representing a potential paradigm for treating cancers based upon non-oncogenic genetic events.
Materials and methods
Analysis of genome-wide copy-number associated cancer dependencies
Gene-level relative copy-numbers were downloaded from the CCLE portal (http://www.broadinstitute.org/ccle, data version 4/06/2012) totaling 23,124 genes. Gene-level dependencies were obtained for 214 cell lines from Project Achilles (version 2.4.3). Of the 214 cell lines, only 179 had corresponding copy-number data and were used for subsequent analyses. ATARiS gene dependency scores were used to estimate the effect of shRNA-induced gene suppression on cell viability (Shao et al., 2013) totaling 8724 gene dependencies. Pearson correlation coefficients and associated p-values were calculated for the association of viability after suppression of each gene with the copy number of all genes. P-values were corrected for multiple hypotheses using the Benjamini-Hochberg method (Benjamini and Hochberg, 1995). We considered associations between copy-numbers of every gene in the genome and dependencies of every gene with ATARiS scores. Large copy-number events affecting many neighboring genes often generated identical significant copy-number:gene dependency associations for copy-numbers associated with multiple genes. We considered these to reflect a single gene whose copy-number was responsible for the association. When the gene dependency was one of the genes contained within the copy-number altered region, we nominated that gene as the source of the association. Likewise, if a gene dependency reflected a paralog of a gene within the copy-number altered region, we nominated its paralog as the dependency-associated gene within the altered region.
CYCLOPS analysis
We determined the significance of differences in ATARiS scores between copy-neutral and –loss lines for every gene by comparing the observed data to data representing random permutations of copy-number class labels, each maintaining the number of cell lines and lineage distribution in each class. Copy-number classes were assigned as copy-loss for cells with log2 relative copy number ratios ≤ −0.35 and copy-neutral otherwise. Genes for which fewer than two cell lines exhibited copy loss were excluded from the analysis.
Generation of heterozygous SF3B1loss cells by CRISPR-Cas9
For SF3B1Loss-Cal51-1 cells, sgRNAs targeting the first constitutively expressed coding exon of SF3B1 (exon 2) were designed with the aid of a web-based application (http://crispr.mit.edu/). Sense and anti-sense oligonucelotides were annealed and cloned into BbsI site of pX458 (Addgene) and verified by Sanger sequencing. Single GFP+ cells were sorted by FACS and plated at low density for single cell cloning. SF3B1control-Cal51-1 cells were processed identically, but did not have inactivating SF3B1 mutations. (See supplementary information for further details.)
For SF3B1Loss-Cal51-2 cells, a Cas9 construct co-expressing two sgRNAs and GFP was used to delete a 57 kb region encoding SF3B1. The guide RNA targeting the 5’ upstream of SF3B1 used a mismatch from a heterozygous SNP (rs3849362) in Cal51 to bias towards mono-allelic deletion of SF3B1. Single GFP+ cells were plated as described above and expanded. One of these was validated by PCR to harbor a 57 kb deletion encoding SF3B1. This was designated ‘SF3B1Loss-Cal51-2’ for subsequent experiments. Another one of these was found by PCR not to harbor this deletion and was designated as the control cell line for subsequent experiments (‘SF3B1control-Cal51-2’).
Glycerol gradient sedimentation
Glycerol gradient sedimentation was performed as previously described (Hartmuth et al., 2012) with slight modifications for use with whole-cell lysates. Briefly, 10–30% glycerol gradients were formed by layering 10% glycerol gradient buffer (20 mM Hepes-KOH (pH 7.9), 150 mM NaCl, 1.5 mM MgCl210% glycerol) on top of a 30% glycerol buffer with identical salt concentrations. Gradients were formed using a Gradient Station (Biocomp Instruments). Cells were lysed in ‘IP lysis buffer’ (50 mM Tris, 150 mM NaCl and 1% Triton X-100). 400 uL containing 1–3 mg of crude lysate was loaded per gradient in SW55 centrifuge tubes and spun at 55,000 RPM for 3.5 hr at 4C. A total of 25 200 uL fractions were collected by manually pipetting from the top of the gradient. Recombinant proteins of known mass were run in parallel gradients as controls.
Gel filtration chromatography
Sephacryl S-500 (17-0613–05, GE Healthcare) columns were packed into a 50 × 1.5 cm column and equilibrated with column buffer (10 mM Tris, 60 mM KCl, 25 mM EDTA, 1% Triton X-100 and 0.1% sodium azide). Whole-cell lysates were collected in IP lysis buffer as described above and incubated with 0.5 mM ATP, 3.2 mM MgCl2 and 20 mM creatine phosphate (di-Tris salt) for 20 min at 30C to dissociate multi-snRNP spliceosomal complexes. 2 mL of lysate containing 5 mg of protein was loaded on columns and 90 1.5 mL fractions were collected overnight at 4C.
RNA sequencing analysis
Total RNA was extracted and treated by DNAse digestion. RNA quality was determined by bioanalyzer (Agilent) and samples with RIN values >7 were used for sequencing. mRNAs were enriched with the NEBNext Poly(A) mRNA Magnetic Isolation Module (New England BioLabs, #E7490S) and library preparations were performed with the NEBNext Ultra Directional RNA Library Prep Kit (New England BioLabs, #E7420S). 75 bp paired reads were generated using a NextSeq 500 sequencer (Illumina). Approximately 50 million reads per sample were generated. FASTQ files were aligned using TOPHAT v1.4 with parameters ‘--mate-inner- dist 300 --mate-std-dev 500 --no-sort-bam --no-convert-bam -p 4’. JuncBase was used to identify read counts at splice junctions (see Appendix Methods).
Generation of xenografts and growth assessment
All animal husbandry was done with the approval of the Dana-Farber Cancer Institute IACUC. 1 × 10⁶ SF3B1control-Cal51-1 or SF3B1Loss-Cal51-1 cells expressing TR-shSF3B1 #3 were subcutaneously injected into opposing flanks of nude mice (Foxn1 nu/nu, Harlan). Animals were randomized to control group or doxycycline treatment after detection of a palpable tumor on either flank. Mice in the doxycycline treatment arm were continuously fed a doxycycline diet (2000 ppm). Mice were sacrificed at the end of the experiment, or when endpoints were reached based on failure to thrive according to IACUC recommendation. Repeated measures two-way ANOVA was used to assess significance.
Acknowledgements
We would like to thank Dr. Minoru Yoshida for supplying Spliceostatin A, and Azin Sayad and Benjamin Neel for sharing extended data from their shRNA gene dependency screen (Marcotte et al., 2016). The RNA sequencing data have been deposited in NCBI's Gene Expression Omnibus (accession number GSE81978). This work was supported in part by NIH grants R01 CA188228 (RB), U01 CA176058 (WCH), F32 CA180653 (BRP), F30 CA192725 (WJG), and R01 GM043375 (RR), the Sontag, Gray Matters, and Pediatric Low-Grade Astrocytoma Foundations (RB), and the Friends for Life Fellowship (BRP).
Appendix
We use the following definitions:
Somatic copy-number alterations (SCNAs):
Somatic changes in the number of copies of a DNA sequence that are observed in cancer cells but not their paired germline DNA.
Gene dependency:
A gene whose suppression results in a loss of fitness for a particular cell context.
Copy-number associated gene dependency:
A gene dependency among cells that share a copy-number alteration at a given locus. In the case of cancer, most of these copy-number alterations will be somatic (SCNAs).
We also distinguish between the following classes of copy-number associated gene dependencies:
- Cis copy-number associated gene dependencies: Here, the dependency on a gene is associated with the copy number of that gene. This can take two forms:
- Cancer cells can be especially vulnerable to suppression of a gene when it is amplified. This class of dependencies comprises oncogene addiction-induced dependencies, which result from amplifications of a target gene whose increased expression is important in maintaining cancer cell survival. One example is EGFR amplifications in lung cancer.
- Cancer cells can depend on a gene within a region of partial copy loss. For this class, reduced copy-number of the gene imparts sensitivity to further suppression of that same gene. This is the CYCLOPS (Copy-number alterations Yielding Cancer Liabilities Owing to Partial losS) class.
- Trans copy-number associated gene dependencies: Here, the dependency on a gene is associated with the copy number of a different gene.
- Amplifications of a region can impart sensitivity to suppression of a gene outside the gained region. Currently, we know of no genes in this class.
- Copy loss of a gene can impart sensitivity to suppression of a different gene. Such dependencies can occur if deletion of one gene from a paralogous pair of genes renders cells sensitive to suppression of the remaining paralog.
Supplemental experimental procedures
Classification of length and amplitude for copy number alterations
For relative log2 normalized copy number data analyzed from 10,570 tumors from TCGA (Zack et al., 2013), the following thresholds were used for copy number classification: homozygous loss log2values <−1.2, hemizygous loss log2 ≤ −0.35. For cancer cell lines used in functional studies: copy-loss cells had log2 copy number ≤ −0.35, and copy neutral cells had log2 copy number >−0.2 and <0.2.
Analysis of the location of CYCLOPS genes on chromosome arms with known tumor suppressors
Deleted tumor suppressor genes were obtained from the combined lists from previous studies (Beroukhim et al., 2010; Zack et al., 2013). Among 8131 genes assessed by Achilles, 5546 were on chromosome arms with at least one deleted tumor suppressor gene, including 73 of the 124 candidate CYCLOPS genes. A two-sided Fisher’s exact test was used to determine the significance of enrichment of CYCLOPS genes on arms shared with tumor suppressors.
Analysis of candidate CYCLOPS gene and their overlap with Marcotte et al. (2016) shRNA viability screen
A complete list of genes analyzed for increased sensitivity upon partial copy loss was kindly shared by Azin Sayad and Benjamin Neel [see Table S6C in Marcotte et al. (2016). A total of 8008 genes were analyzed in both studies, including 103 of the 124 candidate CYCLOPS genes we identified. We used the authors’ determinations of which genes exhibited statistically significant associations between dependency and copy loss, taking p<0.05 as the significance threshold. The overall significance of overlap between candidate CYCLOPS genes in our study and (Marcotte et al., 2016) was determined using a Fisher’s Exact test with a two-sided p-value.
Analysis of gene expression across normal tissues
RNA sequencing data were downloaded from the GTEX database (http://www.gtexportal.org/home/). For every gene in the genome, we calculated the expression variance across all samples and ranked the variance against the 20 genes with the most similar average expression level. These ranks served as a nearest-neighbors normalized measure of expression variance.
Tissue culture
Human cancer cell lines were maintained in RPMI-1640 supplemented with 10% fetal bovine serum and 1% penicillin and streptomycin and were assayed to be free of mycoplasma. Non-transformed MCF10A and HMEC cells were cultured in Mammary Epithelial Growth Medium (CC-3150, Lonza). For cells expressing tetracycline-regulated shRNAs, tetracycline-approved fetal bovine serum (Clonetech) was used. Cell lines were original purchased from ATCC or DSMZ. All cell line identities were confirmed using genetic profiling using polymorphic short tandem repeat (STR) loci at the Dana-Farber molecular diagnostics laboratory. No commonly misidentified cell lines defined by the International Cell Line Authentication Committee have been used in these studies.
Correlation analysis of copy-loss of SF3b genes with cell dependencies upon suppression of other SF3b complex genes
We determined the relative copy number and ATARiS gene dependency scores after knockdown of each SF3b complex member across the same 179 cell lines used in the CYCLOPS analysis. We performed linear regression analysis for copy number of each SF3b complex gene with knockdown of every SF3b component. One-sided p-values were calculated for association of sensitivity to suppression with gene loss for all intra-SF3b complex comparisons. Samples were excluded if they harbored co-deletion of the two genes used to generate the correlation.
Quantitative and reverse transcription PCR
RNA was extracted using the RNeasy extraction kit (Qiagen) and subjected to on-column DNase treatment. cDNA was synthesized with the Superscript II Reverse Transcriptase kit (Life Technologies) with no reverse transcriptase samples serving as negative controls. Gene expression was quantified by Power Sybr Green Master Mix (Applied Biosystems). Primers for all genes were determined to be equally efficient over five serial two-fold dilutions. Gene expression values were normalized to ACTB and the fold change calculated by the ΔΔCt method. For quantification of the U2 snRNA, the above method was used except total cellular RNA was extracted with Trizol (Life Technologies). For primer sequence information see Supplementary file 1H.
shRNAs targeting SF3B1
Lentiviral expression constructs for shRNA-mediated suppression of SF3B1 were obtained through the RNAi-consortium (http://www.broadinstitute.org/rnai/public/). The clone ID’s and names used in our studies are as follows: shSF3B1 #2 (TRCN0000320576), shSF3B1 #3 (TRCN0000320566), shSF3B1 #4 (TRCN0000350273), shSF3B1 #5 (TRCN0000320636). For PHF5A, the clone ID’s and names used were: shPHF5A-78 (TRCN0000074878) and shPHF5A-79 (TRCN0000074879). For constitutive and inducible vectors, we respectively used the pre-existing control hairpins shLacZ and shLuciferase (Nijhawan et al., 2012).
Generation of Inducible SF3B1 shRNA expression system.
Sense and anti-sense oligonucleotides were annealed and cloned into the AgeI and EcoRI restriction sites of the pLKO-Tet-puro vector (Addgene, plasmid #21915). The oligonucleotide sequences were:
TR-shSF3B1#3 (sense) 5’- CCGGCAACTCCTTATGGTATCGAATCTCGAGATTCGATACCATAAGGAGTTGTTTTTG,
TR-shSF3B1#3 (anti-sense) 5’- AATTCAAAAACAACTCCTTATGGTATCGAATCTCGAGATTCGATACCATAAGGAGTTG,
TR-shSF3B1#5 (sense) 5’-CCGGCCTCGATTCTACAGGTTATTACTCGAGTAATAACCTGTAGAATCGAGGTTTTTG,
TR-shSF3B1#5 (anti-sense) 5’-AATTCAAAAACCTCGATTCTACAGGTTATTACTCGAGTAATAACCTGTAGAATCGAGG
Additional information for the generation of heterozygous SF3B1loss cells by CRISPR-Cas9
Oligonucleotide sequences for SF3B1Loss-Cal51-1 were as follows: 5’ CACCGCATAATAACCTGTAGAATCG (forward), 5’AAACCGATTCTACAGGTTATTATGC (reverse). pX458 was transfected with LipoD293 (SignaGen) into the diploid breast cancer cell line, Cal51.19 monoclonal cell lines were genotyped for Cas-9 induced mutations by Sanger sequencing cloned PCR products. All monoclonal lines had either no mutations or harbored biallelic mutations in SF3B1. The genotypes of the Cal51 CRISPR cell lines used from this method of generation were: SF3B1delT36/delT36 (SF3B1control-Cal51-1) and SF3B1delT36/A23fsX20 (SF3B1Loss-Cal51-2). Copy number profiles from the two lines were characterized by SNP array. No SCNAs were detected as a result of single cell cloning (data not shown).
Oligonucleotides for SF3B1Loss-Cal51-2 cells were cloned in a similar fashion as SF3B1Loss-Cal51-1 in pX458 (with BbsI overhangs). The sequences are as follows: For the 5’ guide targeting SNP, 5’ CACCGCGCATTATAGATTATGGCCC (forward) and 5’ AAACGGGCCATAATCTATAATGCGC (reverse). For the 3’ targeting guide: 5’CACCGCGGAGTTTCATCCGTTACAC (forward), AAACGTGTAACGGATGAAACTCCGC (reverse)
Cellular growth assays
Cells were plated in 96 well plates at 1000 cells per well. Cell number was inferred by ATP-dependent luminescence by Cell Titer Glo (Promega) and normalized to the relative luminescence on the day of plating. For short-term lentiviral infections, cells were infected 24 hr prior to plating. Relative proliferation was calculated as the fold change in ATP luciferase luminescence units from Cell Titer Glo assays relative to shLacZ expressing cells seven days after shRNA infection (Figure 3G).
GFP competition assays
Oligonucleotides encoding LacZ or SF3B1 shRNA#4 hairpin sequences were annealed and cloned into the pLKO.1 derivative vector TRC047 (pLKO.3pgw) and verified by Sanger sequencing. Cells were infected with serial dilutions of virus to achieve ~50% GFP-positive cells. Cells with approximately equivalent ratios of GFP-positive and negative cells were assayed by flow cytometry 3 days post infection and at subsequent time-points. The fold change in GFP+ cells was normalized to the percentage present 3 days after infection. For competition assays re-introducing exogenous SF3B1, we expressed a human codon-optimized SF3B1 by lentivirus. Cells were infected as described above and treated with doxycycline two days after infection.
Propidium iodide cell viability assays
Cells were treated with either short-term lentiviral infection or tetracycline-inducible SF3B1 shRNAs. After treatment, cells were trypsinized and pelleted including any cells in suspension. Cells were resuspended in propidium iodide viability staining solution (1x PBS, 1% BSA, 2.5 ug/mL propidium iodide) and quantified by live-cell flow cytometry. The change in viability was normalized to the percent of viable cells quantified on the first day of the assay.
Determination of cell cycle distribution by propidium iodide
Cells were trypsinized, washed, and fixed with ice-cold 70% ethanol for a minimum of 15 min at 4C. Cells were incubated in propidium iodide cell cycle staining solution (1x PBS, 1% BSA, 50 ug/mL propidium iodide, 100 ug/mL RNAse A) for 15 min and analyzed by flow cytometry. Debris and aggregates were gated out and cell cycle stage was quantified using Modfit (Varity Software House).
Annexin-V apoptosis assays
Cellular apoptosis was quantified by live-cell flow cytometry using Alexa-Fluor 488 conjugated Annexin-V (Life Technologies) and propidium iodide. Cells were incubated in Annexin binding buffer containing propidium iodide (10 mM Hepes, 140 mM NaCl, 2.5 mM CaCl2, 2.5 ug/mL propdium iodide) for 15 min, washed and resuspended in FACS buffer (1x PBS, 1% BSA and 50 mM EDTA). Determination of the stage of apoptosis by gating was as follows: viable cells (Annexin-V−/PI−), early apoptosis (Annexin-V+/PI−), late apoptosis (Annexin-V+/PI+), and dead cells (Annexin-V−/PI+).
Western blotting
For denaturing protein immunoblots, cells were washed in ice cold PBS and lysed in 1x RIPA buffer (10 mM Tris-Cl Ph 8.0, 1 mM EDTA, 1% Triton X-100, 0.1% SDS and 140 mM NaCl) supplemented with 1x protease and phosphatase inhibitor cocktail (PI-290, Boston Bioproducts). Lysates were sonicated in a bioruptor (Diagenode) for 5 min (medium intensity) and cleared by centrifugation at 15000 x g for 15 min at 4C. Proteins were electrophoresed on polyacrylamide gradient gels (Life Technologies) and detected by chemiluminescence. For native western blotting, cells were washed in ice cold PBS and lysed in 1x sonication buffer (10% Glycerol, 25 mM HEPES pH 7.4, 10 mM MgCl2) supplemented with protease and phosphatase inhibitors. Coomassie blue native PAGE western blots were run according the manufacturer’s instructions (Life Technologies).
Quantification of western blots by densitometry
Immunoblot exposures were quantified using ImageJ (Schneider et al., 2012) as previously described (http://lukemiller.org/index.php/2010/11/analyzing-gels-and-western-blots-with-image-j/). For early glycerol gradient fractions, pixel density histograms and an area under the curve (AUC) were calculated for each western blot band. Each western band AUC was normalized relative to loading control AUCs and then expressed as the fold change relative to glycerol fraction #3 (for Figure 4F). A minimum of 2 technical replicates per cell line (range 2–5) were performed for each of three SF3B1neutral and SF3B1loss cell lines. For Figure 3E and S6B-D, loading control normalized AUCs were expressed as the fold change relative to the diploid Cal51 cell line.
SF3B1 gene expression analysis from TCGA and CCLE datasets
Relative copy number and Affymetrix expression data for SF3B1 were downloaded from the CCLE portal (http://www.broadinstitute.org/ccle/home). TCGA breast adenocarcinoma data were downloaded from the cBioPortal (http://www.cbioportal.org/public-portal/index.do) (Cerami et al., 2012; Gao et al., 2013). For both datasets, samples lacking either gene expression or copy-number were removed. As described above, copy-loss was defined as samples with log2 normalized relative copy number of <−0.35, copy gain was defined as ≥ 0.3.
Spliceosome and DUBi drug viability assays
Cells were plated in 96 well plates at 10,000 cells per well. Relative viability was calculated as the fold change in ATP luciferase luminescence units from Cell Titer Glo assays relative to DMSO treated cells 48 hr after drug treatment (Figure 5—figure supplement 1F, Figure 6H–I, Figure 8B,H and Figure 8—figure supplement 1D).
Immunoprecipitation
Immunoprecipitations were performed with pooled glycerol gradient fractions. The Fc region of mouse anti-SF3B1 (Medical and Biological Laboratories, D221–3) was directionally cross-linked to protein G Dynabeads (Life Technologies) using 20 mM dimethyl pimelimidate (DMP). IgG isotype controls were cross-linked and processed identically. Proteins were eluted with elution buffer (15% glycerol, 1% SDS, 50 mM tris-HCl, 150 mM NaCl pH 8.8) at 80C and subjected to western blot analysis.
U2 snRNA 2’ O-methyl oligonucleotide assays
2’ O-methyl oligonucleotides complementary to the branchpoint binding region of the U2 snRNA were synthesized by Integrative DNA Technologies with the following sequences:
(Branchpoint oligo) 5’mCmAmG mAmUmAmCmUmAmCmAmCmUmUmGmA,
(control oligo) 5’mAmCmUmGmUmAmCmUmAmAmCmUmGmAmCmUmG.
Experiments were performed as described in (Folco et al., 2012). Briefly, mini nuclear extracts from SF3B1control-Cal51 and SF3B1Loss-Cal51 cells were generated using standard protocols (Folco et al., 2012). U2 snRNA-targeting and control oligos were radiolabeled with 32P-gamma ATP with T4 polynucleotide kinase. ATP was depleted from all extracts by incubation at RT for 20 min. 300 ug of total protein from nuclear extracts were added to 25 uL reaction mixtures with or without 0.5 mM ATP, 3.2 mM MgCl2, and 20 mM creatine phosphate (di-Tris salt). Reactions were incubated at 30C of 5 min before adding 34 ng of either branchpoint-targeting or control oligo and subsequent incubation for another 5 min at 30C. For reactions without ATP, water was used to raise the volume to 25 uL. Samples were purified on microspin G-50 columns (GE) and loaded in a 1.2% low-melting agarose gel.
Nuclear speckle quantification by SC-35 immunofluorescence with CellProfiler image analysis
Cells were plated on 35 mm glass bottom dishes with #1.5 cover glass (D35-14–1.5 N, In Vitro Scientific). Cells were fixed and stained with anti-SC-35 antibody (S4045, Sigma-Aldrich) at 1:1000 dilution and detected with Alexafluor488 secondary antibody at 1:1000 (Life Technologies). Nuclei were counterstained with Hoescht dye. Monochromatic images were captured under identical conditions and pseudo-colored using Photoshop. A custom image analysis pipeline was empirically adapted from a pre-existing pipeline designed for detecting H2AX foci using CellProfiler (Kamentsky et al., 2011). Measurements of nuclear speckles were generated from at least 15 random microscopic fields. A minimum of 100 nuclei identified by CellProfiler were used for quantitation per treatment.
Ki67 quantification from tumor xenografts
A custom image analysis pipeline was used to systematically quantify Ki67+ cells from tumor xenografts using CellProfilier. A minimum of 3 tumors per group, totaling at least 2440 nuclei per tumor, was used to quantify the ratio of Ki67+ cells. At least five individual and random microscopic images from each tumor were analyzed.
Luciferase splicing reporters
CMV-LUC2CP/intron/ARE (Luc-I in this manuscript, Addgene plasmid # 62858) and CMV-LUC2CP/ARE (Luc-ORF in this manuscript, Addgene plasmid # 62857) were gifts from Gideon Dreyfuss (Younis et al., 2010). Cells were transfected and hygromycin selected to generate stable cell lines. Cells were then treated with b-AP15 and assayed for luciferase luminescence 24 hr after treatment with the Luciferase Assay System kit (Promega). The fold change in splicing was calculated as the ratio of Luc-I to Luc-ORF after normalizing to DMSO treatment.
RNAseq analysis of splicing by juncBase and beta binomial distribution
To identify common splicing alterations across cancer cell lines, we conducted the RNAseq splicing analyses (Figure 6A and C and Figure 6—figure supplement 1D. only in the patient derived cells lines. This was done to avoid overweighting the Cal 51 cell line from which the isogenic system was generated. We then validated samples for intron retention in both isogenic cells and those with naturally occurring copy number alterations in SF3B1 (Figure 6B).
JuncBASE was used to determine the spliced in/spliced out counts at each splice junction. In the following section we will use intron retention as the example for the way our beta binomial statistic works. The spliced in/spliced out counts at each junction were used to create an estimate of the percent of transcripts with the intron retained (Percent Spliced In, where the intron refers to the inclusion isoform; PSI) for each cell line. We estimated the distribution of this statistic for each cell line in each condition (with and without SF3B1 suppression) using a beta binomial distribution in which spliced in and spliced out read counts were the α and β terms, respectively. Because we only observe a finite number of reads across the junction, the PSI obtained by simple division may not be accurate. We capture the extent of this inaccuracy by calculating an estimate of the probability distribution of the true PSI, given the read counts observed. The beta binomial distribution is used in cases like this where one is attempting to obtain an estimate of the distribution of a Bernoulli random variable (true PSI) from a set of observations of trials and successes. The PSI (IR) for cell line i at intron j, is therefore estimated as:
Where and
We then sought to quantify the probability distribution of the ratio of PSI’s (PSIR) in the same cell line upon SF3B1 suppression. This ratio corresponds to the relative probability of retaining intron j in cell line i, upon SF3B1 suppression. We base this calculation on the two distributions:
We extend the following intuition concerning ratio distributions:
where Z=X/Y and X and Y are independent and distributed between 0 and 1.
In this case, the relative risk of including an intron for cell line i and intron j is:
where and
This integral can be calculated exactly (Pham-Gia, 2000), by bootstrapping, or by approximation with a discrete distribution. We used the latter approach due to issues with numeric overflow in calculating the exact distribution and the computational inability to perform fine enough sampling to obtain very small p-values (ie <10−9) using bootstrapping. To compute the discrete approximation, we iterated through a discrete set of PSI ratios spaced between 0.01 and 100. During each iteration, we calculated the joint distribution of =x/y as above (where = We sampled x () at 1000 intervals between 0 to 1 and calculated the set of y’s () such that y=x/z. We then calculated the joint probability of x and y for all x,y combinations and summed these values to calculate the probability of observing a given relative risk . The discrete probability distribution of was then normalized to 1 to achieve the final probability distribution on the PSI ratio for intron j in cell line i upon SF3B1 suppression.
A posterior estimate of the probability distribution of the PSI ratio in SF3B1loss cell lines was then obtained by a point-wise multiplication of the distributions
for all cell lines with the genotype SF3B1loss. The same procedure was used to calculate the posterior estimate of the PSI ratio for intron retention in SF3B1neutral cell lines .
Finally, we calculated the p-values for the difference between the distributions and . This p-value represents the area of overlap of the two distributions and can be obtained by integrating proportion of the convolution of the and that is greater than 0.
Where is the probability of the null hypothesis that the true values of and are equal. Multiple hypothesis correction was performed using the Benjamini-Hochberg method (Benjamini and Hochberg, 1995).
Funding Statement
The funders had no role in study design, data collection and interpretation, or the decision to submit the work for publication.
Funding Information
This paper was supported by the following grants:
National Cancer Institute F32 CA180653 to Brenton R Paolella.
Sontag Foundation to Rameen Beroukhim.
The Grey Matters Foundation to Rameen Beroukhim.
The Pediatric Low Grade Astrocytoma Foundation to Pratiti Bandopadhayay, Charles D Stiles, Rameen Beroukhim.
Friends for Life Fellowship to Brenton R Paolella.
National Cancer Institute R01 CA188228 to Rameen Beroukhim.
National Cancer Institute U01 CA176058 to William C Hahn.
National Cancer Institute F30 CA192725 to William J Gibson.
National Institute of General Medical Sciences R01 GM043375 to Robin Reed.
National Cancer Institute P50 CA165962 to Charles D Stiles.
Additional information
Competing interests
The authors declare that no competing interests exist.
Author contributions
BRP, Conceptualization, Formal analysis, Funding acquisition, Validation, Investigation, Visualization, Methodology, Writing—original draft, Writing—review and editing.
WJG, Conceptualization, Formal analysis, Funding acquisition, Validation, Investigation, Visualization, Methodology, Writing—original draft, Writing—review and editing.
LMU, Formal analysis, Validation, Investigation, Methodology.
JAA, Resources, Methodology.
TIZ, Data curation, Software, Formal analysis.
PB, Investigation, Methodology.
CAN, Formal analysis, Investigation, Methodology.
PKA, Investigation, Methodology.
MSB, Formal analysis, Investigation, Methodology.
RL, Investigation, Methodology.
YY, Resources, Methodology.
PSC, Resources, Methodology.
EAO, Resources, Methodology.
DH, Resources, Methodology.
GW, Resources, Methodology.
BW, Resources, Methodology.
AT, Resources, Data curation, Software.
FV, Resources, Software, Methodology.
BAW, Resources, Software, Methodology.
DER, Resources, Software, Methodology.
GSC, Resources, Software, Methodology.
SJB, Resources, Investigation, Methodology.
CDS, Resources, Funding acquisition, Methodology.
BLE, Resources, Methodology.
WCH, Resources, Funding acquisition, Methodology.
RR, Resources, Supervision, Funding acquisition, Methodology, Writing—original draft, Writing—review and editing.
RB, Conceptualization, Resources, Formal analysis, Supervision, Funding acquisition, Investigation, Methodology, Writing—original draft, Writing—review and editing.
Ethics
Animal experimentation: This work was conducted in accordance with and approved by the institutional animal care and use committee (IACUC) protocols (#15-014) of the Dana-Farber Cancer Institute.
Additional files
(A) Results of copy-number associated dependencies. (B) Results of CYCLOPS gene analysis. (C) Frequency of genetic SF3B1 alterations in cancer. (D) KEGG Pathways Enriched from significant candidate CYCLOPS genes. (E) Significantly differentially expressed genes after SF3B1 suppression in SF3B1neutral and SF3B1loss cells. (F) Summary of KEGG pathway enrichment from differentially expressed genes in each class (SF3B1loss or SF3B1neutral) from genes in Supplementary file E. (G) Significantly differentially expressed genes after enhanced SF3B1 expression. (H) PCR primer sequences used in this study.
Major datasets
The following dataset was generated:
Paolella B,Gibson W,2016,Effect of SF3B1 suppression in cancer cells with different SF3B1 copy-number levels,https://www.ncbi.nlm.nih.gov/geo/query/acc.cgi?acc=GSE81978,Publicly available at the NCBI Gene Expression Omnibus (accession no: GSE81978)
The following previously published dataset was used:
Cowley GS,Weir BA,Vazquez F,Tamayo P,Scott JA,Rusin S,East-Seletsky A,Ali LD,Gerath WFJ,Pantel SE,Lizotte ph,Jiang G,Hsiao J,Tsherniak A,Dwinell E,Aoyama S,Okamoto M,Harrington W,Gelfand E,Green TM,Tomko MJ,Gopal S,Wong TC,Li H,Howell S,Stransky N,Liefeld T,Jang D,Bistline J,Meyers BH,Armstrong SA,Anderson KC,Stegmaier K,Reich M,Pellman D,Boehm JS,Mesirov JP,Golub TR,RootDE,Hahn WC,2014,Project Achilles,https://portals.broadinstitute.org/achilles/datasets/5/download,Publicly available at the Broad Institute Project Achilles Data Portal, version 2.4.3 (https://portals.broadinstitute.org/achilles)
References
- An M, Henion PD. The zebrafish sf3b1b460 mutant reveals differential requirements for the sf3b1 pre-mRNA processing gene during neural crest development. The International Journal of Developmental Biology. 2012;56:223–237. doi: 10.1387/ijdb.113383ma. [DOI] [PMC free article] [PubMed] [Google Scholar]
- Arrowsmith CH, Bountra C, Fish PV, Lee K, Schapira M. Epigenetic protein families: a new frontier for drug discovery. Nature Reviews Drug Discovery. 2012;11:384–400. doi: 10.1038/nrd3674. [DOI] [PubMed] [Google Scholar]
- Barretina J, Caponigro G, Stransky N, Venkatesan K, Margolin AA, Kim S, Wilson CJ, Lehár J, Kryukov GV, Sonkin D, Reddy A, Liu M, Murray L, Berger MF, Monahan JE, Morais P, Meltzer J, Korejwa A, Jané-Valbuena J, Mapa FA, Thibault J, Bric-Furlong E, Raman P, Shipway A, Engels IH, Cheng J, Yu GK, Yu J, Aspesi P, de Silva M, Jagtap K, Jones MD, Wang L, Hatton C, Palescandolo E, Gupta S, Mahan S, Sougnez C, Onofrio RC, Liefeld T, MacConaill L, Winckler W, Reich M, Li N, Mesirov JP, Gabriel SB, Getz G, Ardlie K, Chan V, Myer VE, Weber BL, Porter J, Warmuth M, Finan P, Harris JL, Meyerson M, Golub TR, Morrissey MP, Sellers WR, Schlegel R, Garraway LA. The Cancer cell line encyclopedia enables predictive modelling of anticancer drug sensitivity. Nature. 2012;483:603–307. doi: 10.1038/nature11003. [DOI] [PMC free article] [PubMed] [Google Scholar]
- Benjamini Y, Hochberg Y. Controlling the false discovery rate: a practical and powerful approach to multiple testing. Journal of the Royal Statistical Society. Series B. 1995;57:289–300. [Google Scholar]
- Berg MG, Wan L, Younis I, Diem MD, Soo M, Wang C, Dreyfuss G. A quantitative high-throughput in vitro splicing assay identifies inhibitors of spliceosome catalysis. Molecular and Cellular Biology. 2012;32:1271–1283. doi: 10.1128/MCB.05788-11. [DOI] [PMC free article] [PubMed] [Google Scholar]
- Beroukhim R, Mermel CH, Porter D, Wei G, Raychaudhuri S, Donovan J, Barretina J, Boehm JS, Dobson J, Urashima M, Mc Henry KT, Pinchback RM, Ligon AH, Cho YJ, Haery L, Greulich H, Reich M, Winckler W, Lawrence MS, Weir BA, Tanaka KE, Chiang DY, Bass AJ, Loo A, Hoffman C, Prensner J, Liefeld T, Gao Q, Yecies D, Signoretti S, Maher E, Kaye FJ, Sasaki H, Tepper JE, Fletcher JA, Tabernero J, Baselga J, Tsao MS, Demichelis F, Rubin MA, Janne PA, Daly MJ, Nucera C, Levine RL, Ebert BL, Gabriel S, Rustgi AK, Antonescu CR, Ladanyi M, Letai A, Garraway LA, Loda M, Beer DG, True LD, Okamoto A, Pomeroy SL, Singer S, Golub TR, Lander ES, Getz G, Sellers WR, Meyerson M. The landscape of somatic copy-number alteration across human cancers. Nature. 2010;463:899–905. doi: 10.1038/nature08822. [DOI] [PMC free article] [PubMed] [Google Scholar]
- Bondeson DP, Mares A, Smith IE, Ko E, Campos S, Miah AH, Mulholland KE, Routly N, Buckley DL, Gustafson JL, Zinn N, Grandi P, Shimamura S, Bergamini G, Faelth-Savitski M, Bantscheff M, Cox C, Gordon DA, Willard RR, Flanagan JJ, Casillas LN, Votta BJ, den Besten W, Famm K, Kruidenier L, Carter PS, Harling JD, Churcher I, Crews CM. Catalytic in vivo protein knockdown by small-molecule PROTACs. Nature Chemical Biology. 2015;11:611–617. doi: 10.1038/nchembio.1858. [DOI] [PMC free article] [PubMed] [Google Scholar]
- Brooks AN, Yang L, Duff MO, Hansen KD, Park JW, Dudoit S, Brenner SE, Graveley BR. Conservation of an RNA regulatory map between Drosophila and mammals. Genome Research. 2011;21:193–202. doi: 10.1101/gr.108662.110. [DOI] [PMC free article] [PubMed] [Google Scholar]
- Cancer Genome Atlas Network Comprehensive molecular portraits of human breast tumours. Nature. 2012;490:61–70. doi: 10.1038/nature11412. [DOI] [PMC free article] [PubMed] [Google Scholar]
- Cerami E, Gao J, Dogrusoz U, Gross BE, Sumer SO, Aksoy BA, Jacobsen A, Byrne CJ, Heuer ML, Larsson E, Antipin Y, Reva B, Goldberg AP, Sander C, Schultz N. The cBio Cancer genomics portal: an open platform for exploring multidimensional Cancer genomics data. Cancer Discovery. 2012;2:401–404. doi: 10.1158/2159-8290.CD-12-0095. [DOI] [PMC free article] [PubMed] [Google Scholar]
- Cheung HW, Cowley GS, Weir BA, Boehm JS, Rusin S, Scott JA, East A, Ali LD, Lizotte PH, Wong TC, Jiang G, Hsiao J, Mermel CH, Getz G, Barretina J, Gopal S, Tamayo P, Gould J, Tsherniak A, Stransky N, Luo B, Ren Y, Drapkin R, Bhatia SN, Mesirov JP, Garraway LA, Meyerson M, Lander ES, Root DE, Hahn WC. Systematic investigation of genetic vulnerabilities across Cancer cell lines reveals lineage-specific dependencies in ovarian Cancer. PNAS. 2011;108:12372–12377. doi: 10.1073/pnas.1109363108. [DOI] [PMC free article] [PubMed] [Google Scholar]
- Corrionero A, Miñana B, Valcárcel J. Reduced fidelity of branch point recognition and alternative splicing induced by the anti-tumor drug spliceostatin A. Genes & Development. 2011;25:445–459. doi: 10.1101/gad.2014311. [DOI] [PMC free article] [PubMed] [Google Scholar]
- Cowley GS, Weir BA, Vazquez F, Tamayo P, Scott JA, Rusin S, East-Seletsky A, Ali LD, Gerath WF, Pantel SE, Lizotte PH, Jiang G, Hsiao J, Tsherniak A, Dwinell E, Aoyama S, Okamoto M, Harrington W, Gelfand E, Green TM, Tomko MJ, Gopal S, Wong TC, Wong TC, Li H, Howell S, Stransky N, Liefeld T, Jang D, Bistline J, Hill Meyers B, Armstrong SA, Anderson KC, Stegmaier K, Reich M, Pellman D, Boehm JS, Mesirov JP, Golub TR, Root DE, Hahn WC. Parallel genome-scale loss of function screens in 216 Cancer cell lines for the identification of context-specific genetic dependencies. Scientific Data. 2014;1:140035. doi: 10.1038/sdata.2014.35. [DOI] [PMC free article] [PubMed] [Google Scholar]
- D'Arcy P, Wang X, Linder S. Deubiquitinase inhibition as a Cancer therapeutic strategy. Pharmacology & Therapeutics. 2015;147:32–54. doi: 10.1016/j.pharmthera.2014.11.002. [DOI] [PubMed] [Google Scholar]
- Darman RB, Seiler M, Agrawal AA, Lim KH, Peng S, Aird D, Bailey SL, Bhavsar EB, Chan B, Colla S, Corson L, Feala J, Fekkes P, Ichikawa K, Keaney GF, Lee L, Kumar P, Kunii K, MacKenzie C, Matijevic M, Mizui Y, Myint K, Park ES, Puyang X, Selvaraj A, Thomas MP, Tsai J, Wang JY, Warmuth M, Yang H, Zhu P, Garcia-Manero G, Furman RR, Yu L, Smith PG, Buonamici S. Cancer-Associated SF3B1 hotspot mutations induce cryptic 3' Splice site selection through use of a different branch point. Cell Reports. 2015;13:1033–1045. doi: 10.1016/j.celrep.2015.09.053. [DOI] [PubMed] [Google Scholar]
- DeBoever C, Ghia EM, Shepard PJ, Rassenti L, Barrett CL, Jepsen K, Jamieson CH, Carson D, Kipps TJ, Frazer KA. Transcriptome sequencing reveals potential mechanism of cryptic 3' splice site selection in SF3B1-mutated cancers. PLOS Computational Biology. 2015;11:e1004105. doi: 10.1371/journal.pcbi.1004105. [DOI] [PMC free article] [PubMed] [Google Scholar]
- Dvinge H, Kim E, Abdel-Wahab O, Bradley RK. RNA splicing factors as oncoproteins and tumour suppressors. Nature Reviews Cancer. 2016;16:413–430. doi: 10.1038/nrc.2016.51. [DOI] [PMC free article] [PubMed] [Google Scholar]
- Eifert C, Powers RS. From Cancer genomes to oncogenic drivers, tumour dependencies and therapeutic targets. Nature Reviews Cancer. 2012;12:572–578. doi: 10.1038/nrc3299. [DOI] [PubMed] [Google Scholar]
- Ellis MJ, Ding L, Shen D, Luo J, Suman VJ, Wallis JW, Van Tine BA, Hoog J, Goiffon RJ, Goldstein TC, Ng S, Lin L, Crowder R, Snider J, Ballman K, Weber J, Chen K, Koboldt DC, Kandoth C, Schierding WS, McMichael JF, Miller CA, Lu C, Harris CC, McLellan MD, Wendl MC, DeSchryver K, Allred DC, Esserman L, Unzeitig G, Margenthaler J, Babiera GV, Marcom PK, Guenther JM, Leitch M, Hunt K, Olson J, Tao Y, Maher CA, Fulton LL, Fulton RS, Harrison M, Oberkfell B, Du F, Demeter R, Vickery TL, Elhammali A, Piwnica-Worms H, McDonald S, Watson M, Dooling DJ, Ota D, Chang LW, Bose R, Ley TJ, Piwnica-Worms D, Stuart JM, Wilson RK, Mardis ER. Whole-genome analysis informs breast Cancer response to aromatase inhibition. Nature. 2012;486:353–360. doi: 10.1038/nature11143. [DOI] [PMC free article] [PubMed] [Google Scholar]
- Folco EG, Coil KE, Reed R. The anti-tumor drug E7107 reveals an essential role for SF3b in remodeling U2 snRNP to expose the branch point-binding region. Genes & Development. 2011;25:440–444. doi: 10.1101/gad.2009411. [DOI] [PMC free article] [PubMed] [Google Scholar]
- Folco EG, Lei H, Hsu JL, Reed R. Small-scale nuclear extracts for functional assays of gene-expression machineries. Journal of Visualized Experiments. 2012 doi: 10.3791/4140. [DOI] [PMC free article] [PubMed] [Google Scholar]
- Gao J, Aksoy BA, Dogrusoz U, Dresdner G, Gross B, Sumer SO, Sun Y, Jacobsen A, Sinha R, Larsson E, Cerami E, Sander C, Schultz N. Integrative analysis of complex Cancer genomics and clinical profiles using the cBioPortal. Science Signaling. 2013;6:pl1. doi: 10.1126/scisignal.2004088. [DOI] [PMC free article] [PubMed] [Google Scholar]
- Gozani O, Potashkin J, Reed R. A potential role for U2AF-SAP 155 interactions in recruiting U2 snRNP to the branch site. Molecular and Cellular Biology. 1998;18:4752–4760. doi: 10.1128/MCB.18.8.4752. [DOI] [PMC free article] [PubMed] [Google Scholar]
- Harbour JW, Roberson ED, Anbunathan H, Onken MD, Worley LA, Bowcock AM. Recurrent mutations at Codon 625 of the splicing factor SF3B1 in uveal melanoma. Nature Genetics. 2013;45:133–135. doi: 10.1038/ng.2523. [DOI] [PMC free article] [PubMed] [Google Scholar]
- Hart T, Chandrashekhar M, Aregger M, Steinhart Z, Brown KR, MacLeod G, Mis M, Zimmermann M, Fradet-Turcotte A, Sun S, Mero P, Dirks P, Sidhu S, Roth FP, Rissland OS, Durocher D, Angers S, Moffat J. High-Resolution CRISPR screens reveal fitness genes and Genotype-Specific Cancer liabilities. Cell. 2015;163:1515–1526. doi: 10.1016/j.cell.2015.11.015. [DOI] [PubMed] [Google Scholar]
- Hartmuth K, van Santen MA, Lührmann R. Ultracentrifugation in the Analysis and Purification of Spliceosomes Assembled in Vitro. New Jersey, United States: John Wiley and Sons; 2012. [Google Scholar]
- Imielinski M, Berger AH, Hammerman PS, Hernandez B, Pugh TJ, Hodis E, Cho J, Suh J, Capelletti M, Sivachenko A, Sougnez C, Auclair D, Lawrence MS, Stojanov P, Cibulskis K, Choi K, de Waal L, Sharifnia T, Brooks A, Greulich H, Banerji S, Zander T, Seidel D, Leenders F, Ansén S, Ludwig C, Engel-Riedel W, Stoelben E, Wolf J, Goparju C, Thompson K, Winckler W, Kwiatkowski D, Johnson BE, Jänne PA, Miller VA, Pao W, Travis WD, Pass HI, Gabriel SB, Lander ES, Thomas RK, Garraway LA, Getz G, Meyerson M. Mapping the hallmarks of lung adenocarcinoma with massively parallel sequencing. Cell. 2012;150:1107–1120. doi: 10.1016/j.cell.2012.08.029. [DOI] [PMC free article] [PubMed] [Google Scholar]
- Isono K, Mizutani-Koseki Y, Komori T, Schmidt-Zachmann MS, Koseki H. Mammalian polycomb-mediated repression of hox genes requires the essential spliceosomal protein Sf3b1. Genes & Development. 2005;19:536–541. doi: 10.1101/gad.1284605. [DOI] [PMC free article] [PubMed] [Google Scholar]
- Kaida D, Motoyoshi H, Tashiro E, Nojima T, Hagiwara M, Ishigami K, Watanabe H, Kitahara T, Yoshida T, Nakajima H, Tani T, Horinouchi S, Yoshida M. Spliceostatin A targets SF3b and inhibits both splicing and nuclear retention of pre-mRNA. Nature Chemical Biology. 2007;3:576–583. doi: 10.1038/nchembio.2007.18. [DOI] [PubMed] [Google Scholar]
- Kamentsky L, Jones TR, Fraser A, Bray MA, Logan DJ, Madden KL, Ljosa V, Rueden C, Eliceiri KW, Carpenter AE. Improved structure, function and compatibility for CellProfiler: modular high-throughput image analysis software. Bioinformatics. 2011;27:1179–1180. doi: 10.1093/bioinformatics/btr095. [DOI] [PMC free article] [PubMed] [Google Scholar]
- Kfir N, Lev-Maor G, Glaich O, Alajem A, Datta A, Sze SK, Meshorer E, Ast G. SF3B1 association with chromatin determines splicing outcomes. Cell Reports. 2015;11:618–629. doi: 10.1016/j.celrep.2015.03.048. [DOI] [PubMed] [Google Scholar]
- Kotake Y, Sagane K, Owa T, Mimori-Kiyosue Y, Shimizu H, Uesugi M, Ishihama Y, Iwata M, Mizui Y. Splicing factor SF3b as a target of the antitumor natural product pladienolide. Nature Chemical Biology. 2007;3:570–575. doi: 10.1038/nchembio.2007.16. [DOI] [PubMed] [Google Scholar]
- Krämer A, Grüter P, Gröning K, Kastner B. Combined biochemical and Electron microscopic analyses reveal the architecture of the mammalian U2 snRNP. The Journal of Cell Biology. 1999;145:1355–1368. doi: 10.1083/jcb.145.7.1355. [DOI] [PMC free article] [PubMed] [Google Scholar]
- Kwiatkowski N, Zhang T, Rahl PB, Abraham BJ, Reddy J, Ficarro SB, Dastur A, Amzallag A, Ramaswamy S, Tesar B, Jenkins CE, Hannett NM, McMillin D, Sanda T, Sim T, Kim ND, Look T, Mitsiades CS, Weng AP, Brown JR, Benes CH, Marto JA, Young RA, Gray NS. Targeting transcription regulation in Cancer with a covalent CDK7 inhibitor. Nature. 2014;511:616–620. doi: 10.1038/nature13393. [DOI] [PMC free article] [PubMed] [Google Scholar]
- Lee SC, Dvinge H, Kim E, Cho H, Micol JB, Chung YR, Durham BH, Yoshimi A, Kim YJ, Thomas M, Lobry C, Chen CW, Pastore A, Taylor J, Wang X, Krivtsov A, Armstrong SA, Palacino J, Buonamici S, Smith PG, Bradley RK, Abdel-Wahab O. Modulation of splicing catalysis for therapeutic targeting of leukemia with mutations in genes encoding spliceosomal proteins. Nature Medicine. 2016;22:672–678. doi: 10.1038/nm.4097. [DOI] [PMC free article] [PubMed] [Google Scholar]
- Liu Y, Zhang X, Han C, Wan G, Huang X, Ivan C, Jiang D, Rodriguez-Aguayo C, Lopez-Berestein G, Rao PH, Maru DM, Pahl A, He X, Sood AK, Ellis LM, Anderl J, Lu X. TP53 loss creates therapeutic vulnerability in colorectal cancer. Nature. 2015;520:697–701. doi: 10.1038/nature14418. [DOI] [PMC free article] [PubMed] [Google Scholar]
- Loyer P, Trembley JH, Lahti JM, Kidd VJ. The RNP protein, RNPS1, associates with specific isoforms of the p34cdc2-related PITSLRE protein kinase in vivo. Journal of Cell Science. 1998;111 (Pt 11):1495–1506. doi: 10.1242/jcs.111.11.1495. [DOI] [PubMed] [Google Scholar]
- Marcotte R, Sayad A, Brown KR, Sanchez-Garcia F, Reimand J, Haider M, Virtanen C, Bradner JE, Bader GD, Mills GB, Pe'er D, Moffat J, Neel BG. Functional genomic landscape of human breast Cancer drivers, vulnerabilities, and resistance. Cell. 2016;164:293–309. doi: 10.1016/j.cell.2015.11.062. [DOI] [PMC free article] [PubMed] [Google Scholar]
- Matsunawa M, Yamamoto R, Sanada M, Sato-Otsubo A, Shiozawa Y, Yoshida K, Otsu M, Shiraishi Y, Miyano S, Isono K, Koseki H, Nakauchi H, Ogawa S. Haploinsufficiency of Sf3b1 leads to compromised stem cell function but not to myelodysplasia. Leukemia. 2014;28:1844–1850. doi: 10.1038/leu.2014.73. [DOI] [PubMed] [Google Scholar]
- Melé M, Ferreira PG, Reverter F, DeLuca DS, Monlong J, Sammeth M, Young TR, Goldmann JM, Pervouchine DD, Sullivan TJ, Johnson R, Segrè AV, Djebali S, Niarchou A, Wright FA, Lappalainen T, Calvo M, Getz G, Dermitzakis ET, Ardlie KG, Guigó R, GTEx Consortium Human genomics. the human transcriptome across tissues and individuals. Science. 2015;348:660–665. doi: 10.1126/science.aaa0355. [DOI] [PMC free article] [PubMed] [Google Scholar]
- Mizui Y, Sakai T, Iwata M, Uenaka T, Okamoto K, Shimizu H, Yamori T, Yoshimatsu K, Asada M. Pladienolides, new substances from culture of Streptomyces platensis Mer-11107. III. in vitro and in vivo antitumor activities. The Journal of Antibiotics. 2004;57:188–196. doi: 10.7164/antibiotics.57.188. [DOI] [PubMed] [Google Scholar]
- Moore MJ, Wang Q, Kennedy CJ, Silver PA. An alternative splicing network links cell-cycle control to apoptosis. Cell. 2010;142:625–636. doi: 10.1016/j.cell.2010.07.019. [DOI] [PMC free article] [PubMed] [Google Scholar]
- Muller FL, Aquilanti EA, DePinho RA. Collateral lethality: a new therapeutic strategy in oncology. Trends in Cancer. 2015;1:161–173. doi: 10.1016/j.trecan.2015.10.002. [DOI] [PMC free article] [PubMed] [Google Scholar]
- Nijhawan D, Zack TI, Ren Y, Strickland MR, Lamothe R, Schumacher SE, Tsherniak A, Besche HC, Rosenbluh J, Shehata S, Cowley GS, Weir BA, Goldberg AL, Mesirov JP, Root DE, Bhatia SN, Beroukhim R, Hahn WC. Cancer vulnerabilities unveiled by genomic loss. Cell. 2012;150:842–854. doi: 10.1016/j.cell.2012.07.023. [DOI] [PMC free article] [PubMed] [Google Scholar]
- Nijman SM, Luna-Vargas MP, Velds A, Brummelkamp TR, Dirac AM, Sixma TK, Bernards R. A genomic and functional inventory of deubiquitinating enzymes. Cell. 2005;123:773–786. doi: 10.1016/j.cell.2005.11.007. [DOI] [PubMed] [Google Scholar]
- Obeng EA, Chappell RJ, Seiler M, Chen MC, Campagna DR, Schmidt PJ, Schneider RK, Lord AM, Wang L, Gambe RG, McConkey ME, Ali AM, Raza A, Yu L, Buonamici S, Smith PG, Mullally A, Wu CJ, Fleming MD, Ebert BL. Physiologic expression of Sf3b1(K700E) Causes impaired erythropoiesis, aberrant splicing, and sensitivity to therapeutic spliceosome modulation. Cancer Cell. 2016;30:404–417. doi: 10.1016/j.ccell.2016.08.006. [DOI] [PMC free article] [PubMed] [Google Scholar]
- Papaemmanuil E, Cazzola M, Boultwood J, Malcovati L, Vyas P, Bowen D, Pellagatti A, Wainscoat JS, Hellstrom-Lindberg E, Gambacorti-Passerini C, Godfrey AL, Rapado I, Cvejic A, Rance R, McGee C, Ellis P, Mudie LJ, Stephens PJ, McLaren S, Massie CE, Tarpey PS, Varela I, Nik-Zainal S, Davies HR, Shlien A, Jones D, Raine K, Hinton J, Butler AP, Teague JW, Baxter EJ, Score J, Galli A, Della Porta MG, Travaglino E, Groves M, Tauro S, Munshi NC, Anderson KC, El-Naggar A, Fischer A, Mustonen V, Warren AJ, Cross NC, Green AR, Futreal PA, Stratton MR, Campbell PJ, Chronic Myeloid Disorders Working Group of the International Cancer Genome Consortium Somatic SF3B1 mutation in myelodysplasia with ring sideroblasts. The New England Journal of Medicine. 2011;365:1384–1395. doi: 10.1056/NEJMoa1103283. [DOI] [PMC free article] [PubMed] [Google Scholar]
- Pham-Gia T. Distributions of the ratios of independent beta variables and applications. Communications in Statistics - Theory and Methods. 2000;29:2693–2715. doi: 10.1080/03610920008832632. [DOI] [Google Scholar]
- Roybal GA, Jurica MS. Spliceostatin A inhibits spliceosome assembly subsequent to prespliceosome formation. Nucleic Acids Research. 2010;38:6664–6672. doi: 10.1093/nar/gkq494. [DOI] [PMC free article] [PubMed] [Google Scholar]
- Schneider CA, Rasband WS, Eliceiri KW. NIH image to ImageJ: 25 years of image analysis. Nature Methods. 2012;9:671–675. doi: 10.1038/nmeth.2089. [DOI] [PMC free article] [PubMed] [Google Scholar]
- Shao DD, Tsherniak A, Gopal S, Weir BA, Tamayo P, Stransky N, Schumacher SE, Zack TI, Beroukhim R, Garraway LA, Margolin AA, Root DE, Hahn WC, Mesirov JP. ATARiS: computational quantification of gene suppression phenotypes from multisample RNAi screens. Genome Research. 2013;23:665–678. doi: 10.1101/gr.143586.112. [DOI] [PMC free article] [PubMed] [Google Scholar]
- Spector DL, Lamond AI. Nuclear speckles. Cold Spring Harbor Perspectives in Biology. 2011;3:a000646. doi: 10.1101/cshperspect.a000646. [DOI] [PMC free article] [PubMed] [Google Scholar]
- van der Feltz C, Anthony K, Brilot A, Pomeranz Krummel DA. Architecture of the spliceosome. Biochemistry. 2012;51:3321–3333. doi: 10.1021/bi201215r. [DOI] [PubMed] [Google Scholar]
- Visconte V, Rogers HJ, Singh J, Barnard J, Bupathi M, Traina F, McMahon J, Makishima H, Szpurka H, Jankowska A, Jerez A, Sekeres MA, Saunthararajah Y, Advani AS, Copelan E, Koseki H, Isono K, Padgett RA, Osman S, Koide K, O'Keefe C, Maciejewski JP, Tiu RV. SF3B1 haploinsufficiency leads to formation of ring sideroblasts in myelodysplastic syndromes. Blood. 2012;120:3173–3186. doi: 10.1182/blood-2012-05-430876. [DOI] [PMC free article] [PubMed] [Google Scholar]
- Wahl MC, Will CL, Lührmann R. The spliceosome: design principles of a dynamic RNP machine. Cell. 2009;136:701–718. doi: 10.1016/j.cell.2009.02.009. [DOI] [PubMed] [Google Scholar]
- Wang C, Sashida G, Saraya A, Ishiga R, Koide S, Oshima M, Isono K, Koseki H, Iwama A. Depletion of Sf3b1 impairs proliferative capacity of hematopoietic stem cells but is not sufficient to induce myelodysplasia. Blood. 2014;123:3336–3343. doi: 10.1182/blood-2013-12-544544. [DOI] [PubMed] [Google Scholar]
- Wang H, Liang L, Fang JY, Xu J. Somatic gene copy number alterations in colorectal Cancer: new quest for Cancer drivers and biomarkers. Oncogene. 2015;35:2011–2019. doi: 10.1038/onc.2015.304. [DOI] [PubMed] [Google Scholar]
- Wang L, Lawrence MS, Wan Y, Stojanov P, Sougnez C, Stevenson K, Werner L, Sivachenko A, DeLuca DS, Zhang L, Zhang W, Vartanov AR, Fernandes SM, Goldstein NR, Folco EG, Cibulskis K, Tesar B, Sievers QL, Shefler E, Gabriel S, Hacohen N, Reed R, Meyerson M, Golub TR, Lander ES, Neuberg D, Brown JR, Getz G, Wu CJ. SF3B1 and other novel Cancer genes in chronic lymphocytic leukemia. New England Journal of Medicine. 2011;365:2497–2506. doi: 10.1056/NEJMoa1109016. [DOI] [PMC free article] [PubMed] [Google Scholar]
- Webb TR, Joyner AS, Potter PM. The development and application of small molecule modulators of SF3b as therapeutic agents for Cancer. Drug Discovery Today. 2013;18:43–49. doi: 10.1016/j.drudis.2012.07.013. [DOI] [PMC free article] [PubMed] [Google Scholar]
- Winter GE, Buckley DL, Paulk J, Roberts JM, Souza A, Dhe-Paganon S, Bradner JE. Phthalimide conjugation as a strategy for in vivo target protein degradation. Science. 2015;348:1376–1381. doi: 10.1126/science.aab1433. [DOI] [PMC free article] [PubMed] [Google Scholar]
- Yoshida K, Sanada M, Shiraishi Y, Nowak D, Nagata Y, Yamamoto R, Sato Y, Sato-Otsubo A, Kon A, Nagasaki M, Chalkidis G, Suzuki Y, Shiosaka M, Kawahata R, Yamaguchi T, Otsu M, Obara N, Sakata-Yanagimoto M, Ishiyama K, Mori H, Nolte F, Hofmann WK, Miyawaki S, Sugano S, Haferlach C, Koeffler HP, Shih LY, Haferlach T, Chiba S, Nakauchi H, Miyano S, Ogawa S. Frequent pathway mutations of splicing machinery in myelodysplasia. Nature. 2011;478:64–69. doi: 10.1038/nature10496. [DOI] [PubMed] [Google Scholar]
- Younis I, Berg M, Kaida D, Dittmar K, Wang C, Dreyfuss G. Rapid-response splicing reporter screens identify differential regulators of constitutive and alternative splicing. Molecular and Cellular Biology. 2010;30:1718–1728. doi: 10.1128/MCB.01301-09. [DOI] [PMC free article] [PubMed] [Google Scholar]
- Zack TI, Schumacher SE, Carter SL, Cherniack AD, Saksena G, Tabak B, Lawrence MS, Zhsng CZ, Wala J, Mermel CH, Sougnez C, Gabriel SB, Hernandez B, Shen H, Laird PW, Getz G, Meyerson M, Beroukhim R. Pan-cancer patterns of somatic copy number alteration. Nature Genetics. 2013;45:1134–1140. doi: 10.1038/ng.2760. [DOI] [PMC free article] [PubMed] [Google Scholar]
- Zhou Q, Derti A, Ruddy D, Rakiec D, Kao I, Lira M, Gibaja V, Chan H, Yang Y, Min J, Schlabach MR, Stegmeier F. A chemical genetics approach for the functional assessment of novel Cancer genes. Cancer Research. 2015;75:1949–1958. doi: 10.1158/0008-5472.CAN-14-2930. [DOI] [PubMed] [Google Scholar]
- Zhou Z, Licklider LJ, Gygi SP, Reed R. Comprehensive proteomic analysis of the human spliceosome. Nature. 2002;419:182–185. doi: 10.1038/nature01031. [DOI] [PubMed] [Google Scholar]


