

Abstract
Purpose
The purpose of this study was to examine whether a supramaximal constant load verification test at 105% of the highest work rate would yield a higher V̇O2max when compared with an incremental test in 10 – 12 year old nonobese and obese children.
Methods
Nine non-obese (BMI percentile: 57.5 ± 23.2) and nine obese (BMI percentile: 97.9 ± 1.4) children completed a two-test protocol that included an incremental test followed 15 minutes later by a supramaximal constant-load verification test.
Results
The V̇O2max achieved in verification testing (Nonobese: 1.71 ± 0.31 and Obese: 1.94 ± 0.47 L/min) was significantly higher than that achieved during the incremental test (Nonobese: 1.57 ± 0.27 and Obese: 1.84 ± 0.48 L/min; P < 0.001). There was no significant interaction (group (i.e., nonobese versus obese) × test (i.e., incremental versus verification)), suggesting that there was no effect of obesity on the difference between verification and incremental V̇O2max (P = 0.747).
Conclusion
A verification test yielded significantly higher values of V̇O2max when compared with the incremental test in obese children. Similar results were observed in nonobese children. Supramaximal constant-load verification is a time-efficient and well-tolerated method for identifying the highest V̇O2 in nonobese and obese children.
Keywords: fitness, validation test, pediatric, obesity, cardiorespiratory, aerobic capacity
Introduction
Maximal oxygen uptake (V̇O2max) represents the maximal ability of the body for O2 delivery and utilization. V̇O2max is an important health marker for establishing levels of cardiorespiratory fitness (5) and for assessing the effects of exercise training (27, 28, 35). Low levels of V̇O2max are associated with a poor cardiovascular disease risk profile (14) and higher levels of V̇O2max are associated with a reduced risk of myocardial infarction later in life (17). In children, determination of V̇O2max provides information regarding cardiopulmonary and muscular growth and development (37). Therefore, obtaining accurate values of V̇O2max is important in a pediatric population.
V̇O2 has been traditionally measured using a ramp or incremental test protocol, and attainment of V̇O2max has been validated when V̇O2 displayed a plateau with an increase in work rate in adults (40). However, it has been difficult to validate V̇O2max using the plateau criterion in children because few children typically exhibit a plateau (6, 12, 36). In the absence of a plateau, secondary criteria such as respiratory exchange ratio (RER) ≥ 1.00, maximal heart rate ≥ 90% of age predicted maximal heart rate, and signs of intense effort such as hyperpnea, facial flushing and grimacing, unsteady gait, and sweating have been suggested (5). However, the use of secondary criteria for validating V̇O2max significantly underestimate V̇O2 max in children, which has led researchers to suggest that even these criteria should be abandoned (7, 34). The recommended approach for validating V̇O2max is to conduct a verification test at a workload that is higher than the highest incremental workload (29).
Supramaximal verification testing has typically been conducted at 105% of the maximal power achieved during the incremental test, 10 – 15 minutes after the maximal incremental test in nonobese children (7, 34, 36). There are no data comparing incremental and supramaximal verification tests in obese children. It is unclear whether the use of a verification test in obese children could yield a higher V̇O2max than the incremental test. This is important to ascertain because obesity affects 17.4% of 6 – 11 year (yr) old children in the United States (31). Hulens et al previously reported that obese adults achieved lower values of minute ventilation (V̇E), RER, heart rate and perceived exertion at peak exercise when compared with lean adults, which could make it difficult to determine whether they attained V̇O2max (19), although similar findings have not been observed in obese children (26). Moreover, as noted above, there are obvious problems associated with the validity of primary and secondary criteria in determining attainment of V̇O2max during an incremental test, which could lead to incorrectly accepting submaximal V̇O2 values as V̇O2max (32, 34). Inaccurate measurement of V̇O2max could lead to obese children being wrongly labeled as “deconditioned” and they could be offered an exercise prescription of a lower intensity than suitable. Since, accurate determination of V̇O2max is important for the diagnosis and treatment of obese children (11), it is imperative that uniform testing procedures and standard criteria validating V̇O2max be established in lieu of accepting the highest values from an incremental test and reporting them as V̇O2peak, while lacking confidence in their validity.
The purpose of this study was to examine whether a supramaximal constant load verification test at 105% of the highest work rate would yield a higher V̇O2max when compared with an incremental test in 10 – 12 yr nonobese and obese children. We hypothesized that obese children would achieve higher levels V̇O2 during verification testing when compared with incremental testing because the increased energetic costs of physical activity in obesity could potentially affect performance during an incremental test, with exhaustion occurring prior to attainment of V̇O2max (19). We also hypothesized that nonobese children would achieve similar levels of V̇O2 during verification testing when compared with incremental testing based on previous reports (4, 7, 34, 36).
Methods
All study procedures were explained in detail, the child’s parent or guardian provided written, informed consent and all children provided written assent. The UT Southwestern Institutional Review Board approved this study (approval number 052012-076).
Twelve children with obesity (9 boys, body mass index (BMI) > 95th percentile for age and sex) and 11 children without obesity (5 boys, BMI between 16th and 84th percentile for age and sex) qualified for this cross-sectional study. All participants were 10 – 12 yr when they were recruited for the study and were considered otherwise healthy. Any participant with a history of smoking exposure, or a diagnosis of heart disease, hypertension, sleep disorders, or diabetes was excluded. Girls who had started their menses were also excluded. Subjects that showed evidence of bronchodilator response (improvement in FEV1 of ≥12% with a minimum volume improvement of 200mL) were excluded from the study (1).
Screening Procedures
Height was recorded using a calibrated eye-level physical scale and weight was recorded using a calibrated weighing scale. BMI percentile was calculated for each child using age and specific BMI tables from the Centers of Disease and Control and Prevention (23). Participants completed a Tanner pubertal stage assessment for assessment of pubertal status. Participants also completed a physical activity readiness questionnaire (10). On a different day, participants completed a dual energy x-ray absorptiometry (DXA) scan for assessment of body composition, a maximal incremental exercise test, and a supramaximal verification test.
Dual-energy X-ray Absorptiometry
All participants underwent a DXA scan for assessment of body composition (Lunar Prodigy Advance, GE healthcare Lunar, Madison, WI). Whole body fat mass and fat-free mass were estimated using Prodigy enCore software (GE healthcare Lunar, Madison, WI).
Maximal Incremental Exercise Test
Participants were asked not to consume a heavy meal at least 3 hours prior to the test. The maximal incremental exercise test was performed on a cycle ergometer (Lode Corival, The Netherlands). Prior to the incremental exercise test, participants performed a 6-minute constant load exercise test at 40Watts on a cycle ergometer, which served as a warm-up for the incremental test and was consistent with our protocol in adults (8). The initial work rate was 20W, and the work rate was increased by 10W or 15W every minute until volitional exhaustion. These data were part of a larger study designed to examine the respiratory effects of obesity in children.
When the study was designed, a 15W increment protocol was established. After a few participants were tested, there was uncertainty regarding attainment of V̇O2max during the incremental test based on secondary criteria (i.e., at least two of the following: respiratory exchange ratio (RER) ≥ 1.00, maximal heart rate ≥ 90% of age predicted maximal heart rate, signs of intense efforts) (5). To eliminate the need for secondary criteria, a supramaximal verification test was added to the study protocol. The next few tests showed that verification V̇O2max was substantially higher than the incremental V̇O2max and that the duration of the incremental test tended to be below 8 minutes. Therefore, the increment of the incremental test was reduced from 15W to 10W, and this was maintained for the remainder of the study. As part of a larger study, all children were invited to return for repeat testing 1 yr later, and all repeat incremental tests had 10W increments (Figure 1).
Figure 1.
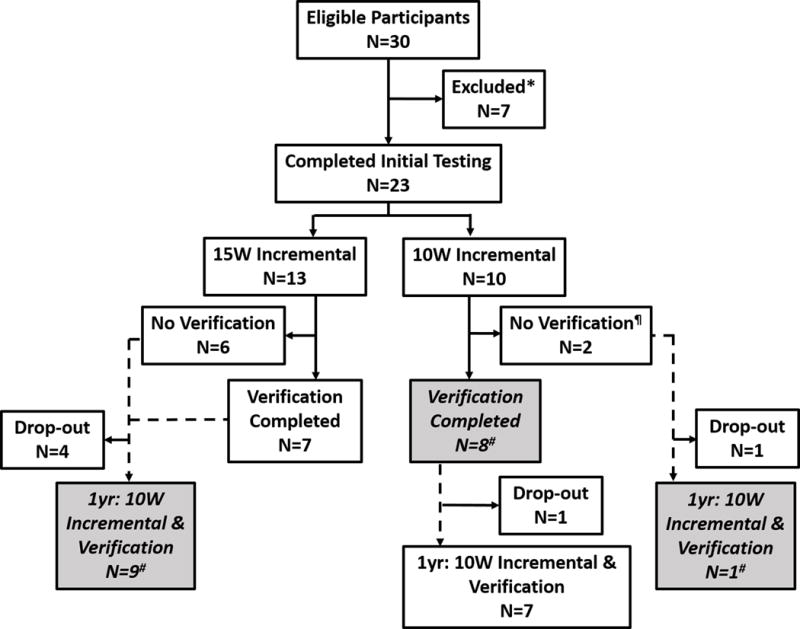
Study flowchart. Dotted lines show participant follow-up after 1 year of initial testing. # Indicates participants included in the final analyses comparing incremental and verification tests (N=18); *Positive for bronchodilator reversibility (N=5), Did not meet BMI percentile criteria for nonobese or obese (N=1), Could not tolerate mouthpiece (N=1); ¶Time constraints for parent (N=1), Nose clip fell off during test and child did not agree to repeat testing (N=1)
Participants were asked to maintain a cadence of 60 – 70 revolutions per minute (rpm) and were allowed to increase cadence towards the end of the test. The test was stopped when participants were unable to maintain a cadence of 50 rpm for five consecutive seconds despite gentle but firm encouragement. Heart rate, ratings of perceived breathlessness (RPB; Borg 0–10 scale), and ratings of perceived exertion (RPE; Borg 6–20 scale) were monitored and recorded during the test. The Borg scales for exertion and breathlessness have been previously validated in a pediatric population (18, 42). V̇E, V̇O2 and expired carbon dioxide (V̇CO2) were measured using the Douglas bag technique where expired gases were collected for 60 seconds in each stage in a polyurethane bags. Gas fractions were measured using a mass spectrometer (Marquette Electronics, model 1100, Milwaukee, WI) and expired volume was measured using a 200 L Tissot spirometer. The highest V̇O2 from a stage that lasted at least 20 seconds was recorded as maximal V̇O2 from the incremental test.
Verification Test
After at least 15 minutes of seated rest, participants performed a constant-load supramaximal verification test at 105% of the maximal work rate achieved during the incremental test. The participants warmed up by cycling for 2 minutes at 20W. Work rate was increased to 105% maximal work rate within 30 seconds and participants were encouraged to pedal at a cadence of their choice for as long as possible. The test was stopped when participants were unable to maintain a cadence of 50 rpm for five seconds despite encouragement. The procedure for the verification test was consistent with previous studies (7, 34). After the first minute, expired air was collected for 30 seconds in polyurethane bags and analyzed as described above. The highest V̇O2 from a bag that collected air for at least 20 seconds was recorded as maximal V̇O2 from the verification test.
Data analyses
Data were expressed as mean and standard deviations (S.D.), unless otherwise specified. P < 0.05 was considered statistically significant using a two-tailed distribution. Using data from Poole et al (32), we estimated that a sample size of 16 participants would detect differences between incremental and verification tests at 80% power (α = 0.05; effect size = 0.759; two tailed hypothesis; based on a t test analysis) (15). The sample size of this study is comparable to other studies that have examined differences in V̇O2 between incremental and verification tests (7, 22, 38) and to studies had have examined the validity of secondary criteria for establishing V̇O2max (7, 32). All data were checked to ensure normal distribution.
V̇O2 plateau calculations were performed for each participant. A linear regression was fit to the linear portion of the V̇O2–Work rate relationship after excluding the last minute of the incremental test. Regression equations for each participant were used to calculate predicted V̇O2 at maximal work rate. V̇O2 plateau attainment was accepted when the difference in measured V̇O2 from the penultimate stage and measured V̇O2 from the maximal stage was less than half of the difference between measured V̇O2 from the penultimate stage and the predicted V̇O2 for the maximal stage (13). Similarly, regression equations for each participant were also used to calculate predicted verification V̇O2max at the verification work rate (i.e., 105% of maximal work rate). Measured verification V̇O2max was considered higher than measured incremental V̇O2max when difference between measured verification V̇O2max and incremental V̇O2max was greater than the difference between predicted verification V̇O2max and incremental V̇O2max. This approach was considered because using an absolute cut off value for the difference between incremental and verification V̇O2max (i.e., 150 mL·min−1) may not be appropriate for obese and nonobese children who may have different energy costs of cycling.
Sensitivity and specificity analyses as well as calculations regarding positive predictive value and negative predictive value were conducted to evaluate whether primary and secondary criteria can correctly identify attainment of V̇O2max from the incremental test. Attainment of V̇O2max during the incremental test was confirmed when difference between measured verification V̇O2max and incremental V̇O2max was less than the difference between predicted verification V̇O2max and incremental V̇O2max. True positive, false positive, true negative, and false negative rates were determined for each of the primary and secondary criteria. The following calculations were performed for each of the primary and secondary criteria (24).
Sensitivity = True positives/(True positives + False negatives)
Specificity = True negatives/(True negatives + False positives)
Positive predictive value = True positives/(True positives + False positives)
Negative predictive value = True negatives/(True negatives + False negatives)
Independent t-tests were used to compare differences between nonobese and obese children. A two- way repeated measures ANOVA was used to examine group (obese vs. nonobese) × test (incremental vs. verification) differences on outcome variables. Bland-Altman plots were used to examine agreement between V̇O2max measured by incremental versus verification tests.
Results
As explained in the methods, there were differences in the incremental test protocol at the start of the study, with some children undergoing tests with 15W increments (N=7), while others undergoing tests with 10W increments (N=8; Figure 1). Verification V̇O2max was higher than incremental V̇O2max (P=0.001) independent of the increment used (i.e., 10W or 15W; test × increment interaction P = 0.528). However, for consistency, the following analyses only include data from children that underwent 10W (N=18) increment tests followed by supramaximal verification tests, either before or after 1 yr of starting the study (see shaded boxes in Figure 1). Participant characteristics are presented in Table 1.
Table 1.
Characteristics for participants that underwent a maximal exercise test with 10W increments followed by a verification test.
| Nonobese (N = 9) |
Obese (N = 9) |
P value | |
|---|---|---|---|
|
|
|||
| Sex (N) | 5 M/4 F | 6 M/3 F | 0.500 |
| Tanner Stage (1 to 5, N) | 3,4,1,0,1 | 1,1,4,3,0 | 0.072 |
| Age (year) | 11.3 ± 0.6 | 11.7 ± 0.7 | 0.130 |
| Height (cm) | 146.9 ± 5.7 | 151.9 ± 8.8 | 0.167 |
| Weight (kg) | 39.3 ± 5.4 | 69.1 ± 17.4 | 0.001 |
| BMI (kg·m−2) | 18.2 ± 1.8 | 29.5 ± 4.6 | <0.001 |
| BMI percentile (CDC) | 57.5 ± 23.2 | 97.9 ± 1.4 | 0.001 |
| BMI z-score | 0.21 ± 0.67 | 2.13 ± 0.33 | <0.001 |
| Body Fat (%) | 28.2 ± 6.0 | 45.9 ± 3.3 | <0.001 |
| Fat free mass (kg) | 28.2 ± 4.1 | 37.2 ± 8.7 | 0.017 |
CDC: Centers for Disease Control
Performance in the Verification Tests
Time to exhaustion during the verification test ranged from 90 – 210 seconds for all children. Time to exhaustion was 135 ± 34 seconds for nonobese children and 125 ± 33 seconds for obese children, with no differences between groups (P = 0.549).
Comparing responses between incremental and verification tests
V̇O2 (L/min) was significantly higher during the verification test when compared with the incremental test in both nonobese and obese children (P=0.001; Table 2). There was no significant group × test interaction (P=0.747). Since there were no differences between nonobese and obese children, pooled data showed that verification test elicited higher V̇O2max to a similar extent for both boys and girls (ΔV̇O2 Verification – Incremental: 0.10 ± 0.12 and 0.14 ± 0.09 L/min respectively, P=0.466). The verification test resulted in higher V̇O2 when expressed relative to body mass, fat free mass, and as a percent of predicted V̇O2max based on ideal body weight (P<0.001 for all comparisons), with no significant group × test interactions (P=0.170, P=0.534, and P=0.686, respectively). Bland-Altman analysis showed wide limits of agreement (– 92 to 329 mL·min−1) but there was no proportional bias and no obvious obesity status difference (Figure 2).
Table 2.
Physiological parameters obtained at maximal exercise during the incremental and verification exercise tests for nonobese and obese children.
| Nonobese | Obese | |||
|---|---|---|---|---|
| Incremental | Verification | Incremental | Verification | |
|
|
||||
| V̇O2 | ||||
| L·min−1 | 1.57 ± 0.27 | 1.71 ± 0.31* | 1.84 ± 0.48 | 1.94 ± 0.47* |
| % Predicted V̇O2max # | 103 ± 6 | 113 ± 11* | 107 ± 16 | 113 ± 16* |
| mL·min−1·kg body mass−1 | 39.9 ± 4.6 | 43.4 ± 4.6* | 26.8 ± 4.3 | 28.2 ± 3.5* |
| mL·min−1·kg fat free mass−1 | 55.5 ± 3.8 | 60.4 ± 4.0* | 49.4 ± 5.7 | 52.2 ± 5.3* |
| Heart Rate | ||||
| beats per minute | 189 ± 6 | 184 ± 8 | 190 ± 13 | 188 ± 12 |
| % Age Predicted HRmax | 88 ± 3 | 86 ± 4 | 88 ± 6 | 88 ± 6 |
| RER | 1.12 ± 0.05 | 1.10 ± 0.09 | 1.07 ± 0.07 | 1.03 ± 0.12 |
| V̇E (L·min−1) | 65.4 ± 9.7 | 69.1 ± 12.7 | 67.2 ± 12.3 | 68.1 ± 19.4 |
| V̇E/V̇CO2 | 37.7 ± 3.8 | 35.1 ± 5.2 | 37.0 ± 3.2 | 34.2 ± 4.2 |
| Work Rate (W) | 109 ± 24 | 114 ± 25* | 113 ± 23 | 119 ± 24* |
| Time to Exhaustion (s) | 575 ± 145 | 135 ± 34 | 606 ± 149 | 125 ± 33 |
| V̇O2/Work Rate (mL·min−1·W−1) | 12.5 ± 1.1 | – | 11.6 ± 2.2 | – |
RER: Respiratory exchange ratio; V̇O2: oxygen uptake; V̇E: minute ventilation; V̇CO2: expired carbon dioxide; W: Watts; s: seconds;
Indicates a significant main effect of Incremental vs Verification test P < 0.05;
Predicted using equations from Krahenbuhl et al (13)
Figure 2.
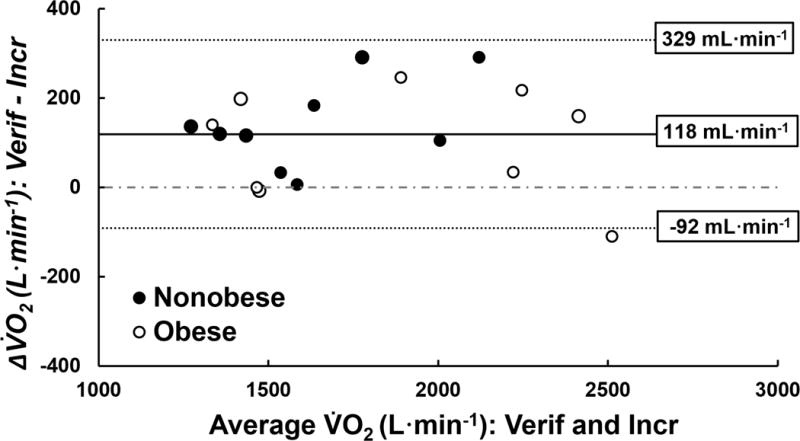
Bland-Altman plot showing difference in oxygen uptake (V̇O2) between the highest V̇O2 achieved during the verification tests (Verif) and the incremental test (Incr) for each participant. Mean bias is showed by the solid line and ± 1.96 S.D is showed by dotted lines; numbers at the end of each line represent the values for mean bias and ± 1.96 S.D.
There were no significant differences in maximal heart rate (beats per minute or expressed as a percent of age predicted maximal heart rate) between incremental and verification tests for both nonobese and obese children (P=0.071 and P=0.070, respectively), with no significant test × obesity status interactions (P=0.332 and P=0.335, respectively; Table 2). Respiratory exchange ratio and V̇E were also similar between incremental and verification tests for both nonobese and obese children (P=0.363 and P=0.430, respectively), with no significant group × test interactions (P=0.750 and P=0.743, respectively; Table 2).
Primary and secondary criteria for validity of an incremental exercise test
Table 3 shows individual subject data from the maximal exercise test, demonstrating attainment of primary and secondary validity criteria as well as individual differences between the incremental and verification tests. Seven out of 9 nonobese children and 5 out of 9 obese children achieved a verification V̇O2max that was higher than predicted verification V̇O2max (Table 3).
Table 3.
Attainment of primary and secondary validity criteria from the maximal exercise test and measured vs. predicted difference in V̇O2 at maximum levels between incremental and verification tests for individual participants. Sensitivity, specificity, positive predictive value, and negative predictive value analyses are shown for primary and secondary criteria.
|
Primary Criterion |
Secondary Criteria | |||||||||
|---|---|---|---|---|---|---|---|---|---|---|
| Participants | V̇O2 Plateau |
HR ≥ 90% APHRmax |
RER ≥ 1.00 |
RER ≥ 1.10 |
Signs of intense effort |
INCR V̇O2max (L·min−1) |
VERIF V̇O2max (L·min−1) |
Measured ΔV̇O2 ¶ (mL·min−1) |
Predicted ΔV̇O2 * (mL·min−1) |
Measured> Predicted? |
| Nonobese | ||||||||||
| 1 | x | x | x | 1.378 | 1.493 | 115 | 58 | Yes | ||
| 2 | x | x | x | 1.298 | 1.417 | 119 | 52 | Yes | ||
| 3 | x | x | x | x | 1.206 | 1.341 | 135 | 41 | Yes | |
| 4 | x | x | x | x | 1.632 | 1.922 | 290 | 76 | Yes | |
| 5 | x | x | x | 1.583 | 1.588 | 5 | 67 | No | ||
| 6 | x | x | x | x | 1.522 | 1.554 | 32 | 75 | No | |
| 7 | x | x | x | x | 1.955 | 2.059 | 104 | 90 | Yes | |
| 8 | x | x | x | x | 1.545 | 1.727 | 182 | 61 | Yes | |
| 9 | x | x | x | 1.977 | 2.267 | 290 | 92 | Yes | ||
| Obese | ||||||||||
| 10 | x | x | x | x | 1.479 | 1.470 | −9 | 61 | No | |
| 11 | x | x | x | x | 2.336 | 2.494 | 158 | 94 | Yes | |
| 12 | x | x | 1.322 | 1.519 | 197 | 49 | Yes | |||
| 13 | x | x | x | 2.568 | 2.457 | −111 | 119 | No | ||
| 14 | x | x | x | 1.468 | 1.467 | −1 | 44 | No | ||
| 15 | x | x | 2.206 | 2.239 | 33 | 66 | No | |||
| 16 | x | x | x | x | 1.267 | 1.406 | 139 | 37 | Yes | |
| 17 | x | x | x | 2.14 | 2.356 | 216 | 74 | Yes | ||
| 18 | x | x | x | 1.769 | 2.014 | 245 | 64 | Yes | ||
| Sensitivity: TP/(TP+FN) | 22% | 27% | 100% | 43% | 100% | |||||
| Specificity: TN/(TN+FP) | 44% | 43% | 8% | 27% | 0% | |||||
| PPV: TP/(TP+FP) | 29% | 43% | 29% | 27% | 33% | |||||
| NPV: TN/(TN+FN) | 36% | 27% | 100% | 43% | – | |||||
V̇O2: oxygen uptake; HR: heart rate; APHRmax: age predicted maximal heart rate; RER: respiratory exchange ratio; INCR: incremental test; VERIF: verification test; x= criterion achieved; TP: true positive; TN: true negative; FP: false positive; FN: false negative; PPV: Positive predictive value; NPV: Negative predictive value;
Measured Δ V̇O2 = Measured Verification V̇O2 – Measured Incremental V̇O2;
Predicted Δ V̇O2 = Predicted Verification V̇O2 – Predicted Incremental V̇O2
Using pooled data for nonobese and obese children, 7 out of 18 children achieved a V̇O2 plateau as defined by <50% increase in V̇O2 with an increase in work rate based on the V̇O2 – Work rate regression from the incremental exercise test (13). Five out of 7 children that achieved a plateau during the incremental test had verification test V̇O2max values that were higher than predicted verification V̇O2max and none of these 7 children attained a maximal heart rate during the incremental test that was ≥ 90% of age predicted maximal heart rate. 44% of children attained a maximal heart rate that was ≥ 90% of age predicted maximal heart rate, 94% of children attained an RER ≥ 1.00, and 61% of children attained an RER ≥ 1.10 during the incremental test.
None of the primary or secondary criteria for validating an incremental test achieved high levels of both sensitivity and specificity, limiting their usefulness in validating an incremental test. Similarly, none of the primary or secondary criteria for validating an incremental test achieved high positive and negative predictive values. If participants achieved either a maximal heart rate that was ≥ 90% of age predicted maximal heart rate or an RER ≥ 1.10, the sensitivity of detecting a valid V̇O2max was estimated at 56%, specificity was 11%, while requiring both criteria to be present in the same test reduced the sensitivity to 11% and increase the specificity to 56%.
Discussion
Comparing responses between incremental and verification tests
This is the first study to show that verification V̇O2max was significantly higher than incremental V̇O2max in obese children as well as in nonobese children. In contrast, four previous studies (4, 7, 34, 36) have not shown a higher verification V̇O2max when compared with the incremental V̇O2max in nonobese children. Three (4, 7, 36) of these studies included a very active population of children, with average V̇O2max ranging from 50 – 62 mL·min−1·kg−1, which was substantially higher that the average V̇O2max in the current study for nonobese children (see Table 2). It is possible that the higher fitness levels and increased motivation for performance (36) during the incremental and supramaximal tests allowed participants to achieve V̇O2max during the incremental and supramaximal tests. The study by Robben et al (34) was conducted in children with a broad range of fitness levels (i.e. 17 – 47 mL·min−1·kg−1), which was similar to the current study. Robben et al showed that verification testing yielded V̇O2max values that were significantly (i.e., 150 mL/min) higher than values obtained using incremental testing in some nonobese prepubescent children (20). However, Robben et al repeated the incremental test in this study until the final difference in V̇O2max between incremental and verification tests was below 150 mL·min−1 (20), and consequently, there were no significant differences between incremental and verification V̇O2max. Therefore, the current study is the first to show that supramaximal verification testing yielded higher levels of V̇O2 when compared with incremental testing for obese and nonobese children that represented a broad range of fitness levels (i.e. 24 – 52 mL·min−1·kg−1).
In obese adults, a study by Sawyer et al (38) did not find significantly higher verification V̇O2 when compared with incremental V̇O2, even though they did show substantial individual variability in the results with 13 out of 19 subjects achieving a V̇O2 during verification testing that was 2 to 21% higher than the incremental test. The authors did not observe any relationship between BMI and performance on the verification test, which is consistent with the lack of differences between obese and nonobese groups in the present study. The authors also reported significantly higher maximal heart rate during the verification test compared with the incremental test, which is not consistent with other studies comparing the two tests in adults (22, 43) or the present data that do not show significant differences in maximal heart rate between the two test protocols.
Average verification V̇O2 was significantly higher than incremental V̇O2, which could be because the incremental test did not yield V̇O2max, while slow component of V̇O2 during the supramaximal verification test yielded “true” V̇O2max (20). The difference in measured V̇O2 between the incremental and verification tests exceeded the difference in predicted V̇O2 between the incremental and verification tests, suggesting that the end-exercise gain in V̇O2 may have exceeded 9 – 16 mL·min−1·Watt−1 for obese and nonobese children (16, 20). It is also possible that the incremental test produced a “priming” effect, which resulted in faster V̇O2 kinetics and increased time to exhaustion leading to attainment of V̇O2max during the verification test (21).
Performance in the Verification Tests
Cardiorespiratory fitness is not affected by obesity as evidenced by similar levels of V̇O2max expressed relative to fat free weight in obese and nonobese individuals (9). Nevertheless, obese children have lower physical fitness than their nonobese counterparts (41), which could raise questions regarding the feasibility of supramaximal verification testing for obese children. The average time to exhaustion during the verification tests in the present study (i.e., 130 ± 63 seconds) was longer than other studies that have reported average times of 66 and 91 seconds in children (7, 34). There were no differences in the time to exhaustion during the verification test between obese and nonobese children, suggesting that obesity may not adversely affect performance at supramaximal work rates for cycle ergometer exercise. Moreover, studies have reported that there are no differences in V̇O2 kinetics or oxygen deficit during exercise between obese and nonobese children (25, 33), suggesting that obese children may not need to exercise for a longer duration at supramaximal workloads to attain V̇O2max when compared with nonobese children.
Mortensen et al previously reported achievement of peak cardiac output, leg blood flow and oxygen delivery within 60–90 seconds of supramaximal cycling in adults, suggesting that verification tests may need to last at least 60 seconds in order to yield V̇O2max (30). Phase II V̇O2 kinetics, which represents the phase of rapid increase in V̇O2 during moderate to very heavy intensity exercise, may be faster in children when compared with adults (2, 3). Therefore, it is possible that the minimum time needed for attainment of V̇O2 max during a verification test is could be lower than 60 seconds in children (34), including obese children that have similar kinetics as nonobese children (25, 33). Finally, all the children in this study were able to complete incremental and verification tests without any adverse events. In fact, most children expressed that they found the verification testing both challenging and enjoyable, although it should be noted that this was a subjective assessment by the investigator rather than a formal validated assessment.
Primary and secondary criteria for validity of an incremental exercise test
The current study showed that achievement of a V̇O2 plateau in an incremental test did not confirm attainment of V̇O2max in 5 out of 7 participants. These data agree with Scharhag-Rosenberger et al who demonstrated higher verification V̇O2max values were possible in untrained adults despite achieving a plateau during the incremental test (39). Furthermore, 7 out of 11 participants in the current study did not achieve a V̇O2 plateau but still had a verification test V̇O2 that was higher than predicted verification V̇O2max, suggesting that absence of the plateau does not imply that V̇O2 max was not achieved during the incremental test. These data are consistent with Armstrong et al who showed that children (9.9 ± 0.4 yr) achieved V̇O2max during an incremental test as confirmed by two verification tests even in the absence of a plateau (4). Similarly in adults, Wood et al showed that 39% of overweight and obese participants did not attain a V̇O2 plateau during the incremental test and were not able to achieve higher V̇O2 during a verification protocol, confirming that absence of a V̇O2 plateau during the incremental test did not indicate failure to reach V̇O2max (43).
Previously, Robben et al showed that using a two-step protocol that included an incremental and supramaximal constant load verification test in prepubertal children with and without expiratory flow limitation allowed for unambiguous determination of V̇O2max (34). They also reported that the RER criterion on 1.00 was erroneous for confirming attainment of V̇O2max, which we confirm because 17 out of 18 of the children in this study were able to achieve an RER over 1.00, even though ≈70% of these children still achieved a verification V̇O2max that was higher than predicted verification V̇O2max. Robben et al also showed that many of their prepubertal children were not able to achieve the heart rate criterion of ≥90% age predicted maximal heart rate, which is consistent with the present data where less than half of our participants were able to reach this heart rate criterion. Based on the present data, none of the primary or secondary criteria meet an acceptable combination of sensitivity and specificity for predicting a valid incremental test in 10 – 12 yr old children and therefore, using a two-step approach (incremental and verification testing) may be the best approach for determining V̇O2max.
Limitations
This study has a relatively small sample size (n=18) and narrow age range (i.e., 10 – 12 yr). Future studies should include children of different fitness and obesity levels and a larger sample size to further support and encourage the use of verification testing in assessment of V̇O2max. There could be an effect of pubertal status on the results, but the small sample size and varied pubertal stages in our participant population precluded any statistical comparisons based on pubertal status. Some studies have either repeated the supramaximal test (4, 39) or repeated the incremental test (34) on a different day to confirm attainment of V̇O2max. However, like Barker et al (7), the present study only conducted one incremental test followed by a verification test on the same day. The verification test could be repeated on a different day to confirm V̇O2max, although a study that used a similar approach did not find significant differences in V̇O2max between verification tests performed on two separate days in adults (39).
Since there was a change in the work rate increment from 15W to 10W after the study had already commenced, almost half of the participant population included children that returned for testing 1 yr later. Thus, the final sample reported in this paper included only children that had undergone an incremental test with 10W work rate increments, including two children that were 12.5 and 12.8 yr. We believe that comparing children that underwent the same incremental test protocol followed by the verification test was the best methodological approach. Our analyses demonstrated that the difference between incremental and verification test V̇O2 values were similar for tests that used 15W and 10W increments, which supports our results. It is also difficult to ascertain whether the children who returned after 1 yr performed better during the incremental test due to habituation with the protocol. However, the difference between incremental and verification V̇O2 was similar for children that were tested either before or after 1 yr using a 10W increment protocol (data not reported), suggesting that any effects of habituation may have been minimal.
Conclusion
We showed that the highest verification V̇O2 values were significantly higher than incremental values for 10 – 12 yr obese and nonobese children. We also showed that a two-step protocol that includes both incremental and verification testing should be utilized instead of primary or secondary criteria, which lack adequate sensitivity and specificity for validating an incremental test. Since cardiorespiratory fitness is an important marker for health and there are inherent difficulties in validating an incremental exercise test in children, researchers should utilize a two-step protocol that includes both incremental and verification testing for measuring V̇O2max.
Acknowledgments
This research was supported by National Institutes of Health Grant (HL096782), Dr. Pepper Snapple, King Charitable Foundation Trust, and Texas Health Presbyterian Hospital Dallas. We would like to thank J. Todd Bassett, Rubria Marines-Price, Maria C. Roman, Andreas Kreutzer, Joseph Genovese, Jessica Pineda, and Raksa B. Moran who have helped with data collection on this project. We would also like to thank our participants and their parents for their enthusiastic participation in the project.
Footnotes
Conflict of Interest
All authors declare that they have no competing financial interests related to this publication. All authors declare that the results of the study are presented clearly, honestly, and without fabrication, falsification, or inappropriate data manipulation. The results of the present study do not constitute endorsement by ACSM.
References
- 1.American Thoracic S. Standardization of spirometry (1994 update) Am J Respir Crit Care Med. 1995;152:1107–36. doi: 10.1164/ajrccm.152.3.7663792. [DOI] [PubMed] [Google Scholar]
- 2.Armon Y, Cooper DM, Flores R, Zanconato S, Barstow TJ. Oxygen uptake dynamics during high-intensity exercise in children and adults. J Appl Physiol. 1991;70(2):841–8. doi: 10.1152/jappl.1991.70.2.841. [DOI] [PubMed] [Google Scholar]
- 3.Armstrong N, Barker AR. Oxygen uptake kinetics in children and adolescents: a review. Pediatr Exerc Sci. 2009;21(2):130–47. doi: 10.1123/pes.21.2.130. [DOI] [PubMed] [Google Scholar]
- 4.Armstrong N, Welsman J, Winsley R. Is peak VO2 a maximal index of children’s aerobic fitness? Int J Sports Med. 1996;17(5):356–9. doi: 10.1055/s-2007-972860. [DOI] [PubMed] [Google Scholar]
- 5.Armstrong N, Welsman JR. Assessment and interpretation of aerobic fitness in children and adolescents. Exerc Sport Sci Rev. 1994;22:435–76. [PubMed] [Google Scholar]
- 6.Armstrong N, Williams J, Balding J, Gentle P, Kirby B. The peak oxygen uptake of British children with reference to age, sex and sexual maturity. Eur J Appl Physiol Occup Physiol. 1991;62:369–75. doi: 10.1007/BF00634975. [DOI] [PubMed] [Google Scholar]
- 7.Barker AR, Williams CA, Jones AM, Armstrong N. Establishing maximal oxygen uptake in young people during a ramp cycle test to exhaustion. Br J Sports Med. 2011;45(6):498–503. doi: 10.1136/bjsm.2009.063180. [DOI] [PubMed] [Google Scholar]
- 8.Bhammar DM, Stickford JL, Bernhardt V, Babb TG. Effect of weight loss on operational lung volumes and oxygen cost of breathing in obese women. Int J Obes (Lond) 2016;40(6):998–1004. doi: 10.1038/ijo.2016.21. [DOI] [PMC free article] [PubMed] [Google Scholar]
- 9.Buskirk ER, Taylor HL. Maximal oxygen intake and its relation to body composition, with special reference to chronic physical activity and obesity. J Appl Physiol. 1957;11(1):72–8. doi: 10.1152/jappl.1957.11.1.72. [DOI] [PubMed] [Google Scholar]
- 10.Chisholm D, Collis M, Kulak L, Davenport W, Gruber N. Physical Activity Readiness. B C Med J. 1975;17:375–8. [Google Scholar]
- 11.Cooper DM, Leu SY, Taylor-Lucas C, Lu K, Galassetti P, Radom-Aizik S. Cardiopulmonary Exercise Testing in Children and Adolescents with High Body Mass Index. Pediatr Exerc Sci. 2016;28(1):98–108. doi: 10.1123/pes.2015-0107. [DOI] [PMC free article] [PubMed] [Google Scholar]
- 12.Cooper DM, Weiler-Ravell D, Whipp BJ, Wasserman K. Aerobic parameters of exercise as a function of body size during growth in children. J Appl Physiol. 1984;56:628–34. doi: 10.1152/jappl.1984.56.3.628. [DOI] [PubMed] [Google Scholar]
- 13.Day JR, Rossiter HB, Coats EM, Skasick A, Whipp BJ. The maximally attainable VO2 during exercise in humans: the peak vs. maximum issue. J Appl Physiol (1985) 2003;95(5):1901–7. doi: 10.1152/japplphysiol.00024.2003. [DOI] [PubMed] [Google Scholar]
- 14.Eisenmann JC, Katzmarzyk PT, Perusse L, Tremblay A, Despres JP, Bouchard C. Aerobic fitness, body mass index, and CVD risk factors among adolescents: the Quebec family study. Int J Obes (Lond) 2005;29(9):1077–83. doi: 10.1038/sj.ijo.0802995. [DOI] [PubMed] [Google Scholar]
- 15.Faul F, Erdfelder E, Lang AG, Buchner A. G* Power 3: A flexible statistical power analysis program for the social, behavioral, and biomedical sciences. Behav Res Methods. 2007;39(2):175–91. doi: 10.3758/bf03193146. [DOI] [PubMed] [Google Scholar]
- 16.Henson LC, Poole DC, Whipp BJ. Fitness as a determinant of oxygen uptake response to constant-load exercise. Eur J Appl Physiol Occup Physiol. 1989;59(1–2):21–8. doi: 10.1007/BF02396575. [DOI] [PubMed] [Google Scholar]
- 17.Hogstrom G, Nordstrom A, Nordstrom P. High aerobic fitness in late adolescence is associated with a reduced risk of myocardial infarction later in life: a nationwide cohort study in men. Eur Heart J. 2014;35(44):3133–40. doi: 10.1093/eurheartj/eht527. [DOI] [PubMed] [Google Scholar]
- 18.Hommerding PX, Donadio MV, Paim TF, Marostica PJ. The Borg scale is accurate in children and adolescents older than 9 years with cystic fibrosis. Respiratory Care. 2010;55(6):729–33. [PubMed] [Google Scholar]
- 19.Hulens M, Vansant G, Lysens R, Claessens AL, Muls E. Exercise capacity in lean versus obese women. Scand J Med Sci Sports. 2001;11:305–9. doi: 10.1034/j.1600-0838.2001.110509.x. [DOI] [PubMed] [Google Scholar]
- 20.Jones AM, Grassi B, Christensen PM, Krustrup P, Bangsbo J, Poole DC. Slow component of VO2 kinetics: mechanistic bases and practical applications. Med Sci Sports Exerc. 2011;43(11):2046–62. doi: 10.1249/MSS.0b013e31821fcfc1. [DOI] [PubMed] [Google Scholar]
- 21.Jones AM, Wilkerson DP, Burnley M, Koppo K. Prior heavy exercise enhances performance during subsequent perimaximal exercise. Med Sci Sports Exerc. 2003;35(12):2085–92. doi: 10.1249/01.MSS.0000099108.55944.C4. [DOI] [PubMed] [Google Scholar]
- 22.Kirkeberg JM, Dalleck LC, Kamphoff CS, Pettitt RW. Validity of 3 protocols for verifying VO2 max. Int J Sports Med. 2011;32(4):266–70. doi: 10.1055/s-0030-1269914. [DOI] [PubMed] [Google Scholar]
- 23.Kuczmarski RJ, Ogden CL, Grummer-Strawn LM, et al. CDC growth charts: United States. Adv Data. 2000;(314):1–27. [PubMed] [Google Scholar]
- 24.Lalkhen AG, McCluskey A. Clinical tests: sensitivity and specificity. Contin Educ Anaesth Crit Care Pain. 2008;8(6):221–3. [Google Scholar]
- 25.Loftin M, Heusel L, Bonis M, Carlisle L, Sothern M. Comparison of oxygen uptake kinetics and oxygen deficit in severely overweight and normal weight adolescent females. J Sports Sci Med. 2005;4(4):430–6. [PMC free article] [PubMed] [Google Scholar]
- 26.Maffeis C, Schena F, Zaffanello M, Zoccante L, Schutz Y, Pinelli L. Maximal aerobic power during running and cycling in obese and non-obese children. Acta Paediatr. 1994;83(1):113–6. doi: 10.1111/j.1651-2227.1994.tb12965.x. [DOI] [PubMed] [Google Scholar]
- 27.McManus AM, Armstrong N, Williams CA. Effect of training on the aerobic power and anaerobic performance of prepubertal girls. Acta Paediatr. 1997;86(5):456–9. doi: 10.1111/j.1651-2227.1997.tb08912.x. [DOI] [PubMed] [Google Scholar]
- 28.McManus AM, Cheng CH, Leung MP, Yung TC, Macfarlane DJ. Improving aerobic power in primary school boys: a comparison of continuous and interval training. Int J Sports Med. 2005;26(9):781–6. doi: 10.1055/s-2005-837438. [DOI] [PubMed] [Google Scholar]
- 29.Midgley AW, Carroll S. Emergence of the verification phase procedure for confirming ‘true’ VO(2max) Scand J Med Sci Sports. 2009;19(3):313–22. doi: 10.1111/j.1600-0838.2009.00898.x. [DOI] [PubMed] [Google Scholar]
- 30.Mortensen SP, Damsgaard R, Dawson EA, Secher NH, González-Alonso J. Restrictions in systemic and locomotor skeletal muscle perfusion, oxygen supply and during high-intensity whole-body exercise in humans. J Physiol. 2008;586(Pt 10):2621–35. doi: 10.1113/jphysiol.2007.149401. [DOI] [PMC free article] [PubMed] [Google Scholar]
- 31.Ogden CL, Carroll MD, Lawman HG, et al. Trends in Obesity Prevalence Among Children and Adolescents in the United States, 1988–1994 Through 2013–2014. J Am Med Assoc. 2016;315(21):2292–9. doi: 10.1001/jama.2016.6361. [DOI] [PMC free article] [PubMed] [Google Scholar]
- 32.Poole DC, Wilkerson DP, Jones AM. Validity of criteria for establishing maximal O2 uptake during ramp exercise tests. Eur J Appl Physiol. 2008;102:403–10. doi: 10.1007/s00421-007-0596-3. [DOI] [PubMed] [Google Scholar]
- 33.Reybrouck T, Vinckx J, Gewillig M. Assessment of Oxygen Deficit during Exercise in Obese Children and Adolescents. Pediatr Exerc Sci. 2005;17(3):291–300. [Google Scholar]
- 34.Robben KE, Poole DC, Harms CA. Maximal oxygen uptake validation in children with expiratory flow limitation. Pediatr Exerc Sci. 2013;25(1):84–100. doi: 10.1123/pes.25.1.84. [DOI] [PubMed] [Google Scholar]
- 35.Rowland TW. Aerobic response to endurance training in prepubescent children: a critical analysis. Med Sci Sports Exerc. 1985;17(5):493–7. [PubMed] [Google Scholar]
- 36.Rowland TW. Does peak VO2 reflect VO2max in children?: evidence from supramaximal testing. Med Sci Sports Exerc. 1993;25(6):689–93. [PubMed] [Google Scholar]
- 37.Rowland TW. Evolution of maximal oxygen uptake in children. Med Sport Sci. 2007;50:200–9. doi: 10.1159/000101392. [DOI] [PubMed] [Google Scholar]
- 38.Sawyer BJ, Tucker WJ, Bhammar DM, Gaesser GA. Using a Verification Test for Determination of VO2max in Sedentary Adults With Obesity. J Strength Cond Res. 2015;29(12):3432–8. doi: 10.1519/JSC.0000000000001199. [DOI] [PubMed] [Google Scholar]
- 39.Scharhag-Rosenberger F, Carlsohn A, Cassel M, Mayer F, Scharhag J. How to test maximal oxygen uptake: a study on timing and testing procedure of a supramaximal verification test. Appl Physiol Nutr Metab. 2011;36(1):153–60. doi: 10.1139/H10-099. [DOI] [PubMed] [Google Scholar]
- 40.Taylor HL, Buskirk ER, Henschel A. Maximal oxygen intake as an objective measure of cardio-respiratory performance. J Appl Physiol Respir Environ Exerc Physiol. 1955;8:73–80. doi: 10.1152/jappl.1955.8.1.73. [DOI] [PubMed] [Google Scholar]
- 41.Tsiros MD, Coates AM, Howe PR, Grimshaw PN, Buckley JD. Obesity: the new childhood disability? Obes Rev. 2011;12(1):26–36. doi: 10.1111/j.1467-789X.2009.00706.x. [DOI] [PubMed] [Google Scholar]
- 42.Ward DS, Bar-Or O. Use of the Borg scale in exercise prescription for overweight youth. Can J Sport Sci. 1990;15(2):120–5. [PubMed] [Google Scholar]
- 43.Wood RE, Hills AP, Hunter GR, King NA, Byrne NM. VO2max in overweight and obese adults: do they meet the threshold criteria? Med Sci Sports Exerc. 2010;42:470–7. doi: 10.1249/MSS.0b013e3181b666ad. [DOI] [PubMed] [Google Scholar]