Abstract
Optical coherence tomography (OCT) and optical coherence microscopy (OCM) have demonstrated the ability to investigate cyto- and myelo-architecture in the brain. Polarization-sensitive OCT provides sensitivity to additional contrast mechanisms, specifically the birefringence of myelination, and therefore is advantageous for investigating white matter fiber tracts. In this study, we developed a polarization-sensitive optical coherence microscope (PS-OCM) with 3.5 μm axial and 1.3 μm transverse resolution to investigate fiber organization and orientation at a finer scale than previously demonstrated with PS-OCT. In a fully reconstructed mouse brain section, we showed that at the focal depths of 20 – 70 μm, the PS-OCM reliably identifies the neuronal fibers and quantifies the in-plane orientation.
Growing interests in three-dimensional (3D) reconstruction of the whole brain has imposed tremendous challenges for traditional histology techniques, which are laborious, time consuming and associated with tissue distortions and damages. Optical coherence tomography (OCT) offers a viable solution for high-resolution brain imaging and mapping of large volumes of tissue [1, 2]. OCT is an interferometric technique that resolves the 3D microstructures in biological tissues. As the signal comes from back scattering, an intrinsic optical property of the sample, there’s no need for complicated tissue preparation and exogenous contrast agents, hence preserving the tissue integrity. Recent studies have shown the potential of OCT in studying the laminar structure of the cortex in a postmortem human brain [3]. At a higher resolution of about 1 μm, optical coherence microscopy (OCM) has demonstrated the promise in neuronal cell body identification and fiber tract visualization [4 – 8].
PS-OCT, in addition to conventional OCT, offers sensitivity to tissue birefringence, which is useful in characterizing anisotropic biological structures [9]. A polarization maintaining fiber (PMF) based PS-OCT system in the spectral domain has been developed for brain imaging [10]. The PMF based PS-OCT offers the simplicity and flexibility of fiber optics. In the meantime, it provides the efficiency to generate multiple polarization and non-polarization imaging contrasts in a single measurement, hence facilitating acquisition of large brain samples. Within a few hundred micrometer thick optical sections, the identification of white matter tracts and their associated orientations was achieved due to the birefringence of myelination [11]. However, as we push both axial and lateral resolution to the cellular level, PS-OCM confronts several challenges. The axial resolution improvement sets a high demand for broadband performance of the optical polarization components. The improved lateral resolution from a high NA microscope objective introduces questions about the effects of increased chromatic aberrations and the short depth of focus. Sensitivity and accuracy of polarization measurements have to be guaranteed in the highly scattering medium. Previous reports on PS-OCM succeeded to visualize muscle structures [12] and chiral nanoparticles in scattering medium [13]. Quantitative analysis of birefringence and the axis of anisotropy have yet to be investigated.
In this study, we developed a PMF-based spectral-domain PS-OCM at 1300 nm to image ex-vivo brain. A coronal section of a mouse brain was scanned. Cyto-architecture, myelo-architecture and fiber orientation maps were created. The apparent attenuation coefficient, birefringence and in-plane fiber orientation were quantitatively analyzed with polarization and non-polarization contrasts.
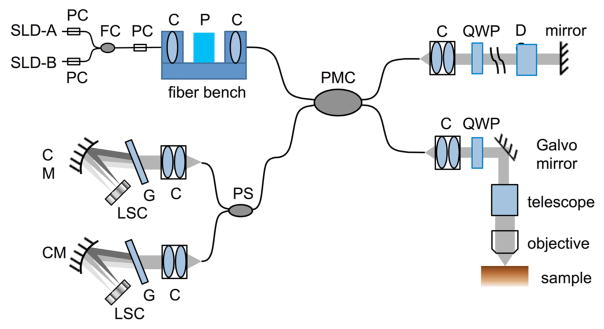
Fig. 1 shows the schematic of the PS-OCM system. The extended broadband light source (Thorlabs Inc., LSC2000C), composed of dual superluminescent diodes (SLD), has a center wavelength of 1300 nm and a bandwidth of 170 nm. The axial resolution was estimated 3.7 μm in tissue (with a refractive index of 1.4). Two polarization controllers manipulated the light polarization for each source separately, and ensured the same linear polarization from the two SLDs. The light is then combined by a fiber coupler, passes through another polarization controller and is directed into a fiber bench. A polarizer in the fiber bench ensures linearly polarized light launched into one of the polarization channels of the interferometer. The interferometer contains polarization-maintaining fibers and a 50:50 coupler (Evanescent Optics Inc., 954P) that preserve the linear polarization states. The reference arm includes a collimator, an achromatic quarter wave plate at 22.5° with respect to the input polarization state, a dispersion compensation block and a mirror. After double-passing the quarter wave plate, the light was directed into both polarization channels of the PMF with equal power. The sample arm contains a collimator, a superachromatic quarter wave plate at 45°, a xy galvo mirror scanner, a 4x telescope to expand the beam, and a 40x water immersion microscope objective (Olympus, LUMPLFLN NA 0.8) to focus the beam onto the sample. The transverse resolution was measured as 1.3 μm. The quarter wave plate ensured that circularly polarized light was incident on the sample. When birefringence is present in the tissue, the back-scattered light becomes elliptically polarized and is launched into both polarization channels of the PMF.
Fig. 1.
System schematic of the PS-OCM. C, collimator; D, dispersion compensation block; CM, concave mirror; FC, fiber coupler; G, grating; LSC, line scan camera; P, polarizer; PC, polarization controller; PMC, polarization-maintaining fiber coupler; PS, polarization splitter; QWP, quarter-wave plate; SLD, superluminescent diode.
After combining light from the sample and reference arms in the fiber coupler, the interferences on the two orthogonal polarization states within the PMF were split by a fiber-based polarization splitter (Evanescent Optics Inc., 968P), and then directed to two identical spectrometers, respectively. Each spectrometer contains a collimator (effective focal length of 65 mm), a customized 600 lines/mm grating (Wasatch Photonics), a concave mirror (f = 100 mm) and a 2048-pixel line scan camera with 10 μm pitch (Sensors Unlimited Inc., 2048L and 2048R). The spectrometer was calibrated with a series of narrowband filters with central wavelength from 1200 nm to 1400 nm, and then the wavelength-pixel correspondence was obtained by a first-degree polynomial fit. The spectral signal was mapped into k-space, compensated for residual dispersion [14], and processed by a fast Fourier transform to create a depth profile (A-line).
The 3D images of reflectivity, retardance, and optic axis orientation are simultaneously extracted from each acquired volume [10]. Due to an arbitrary phase offset between the two channels of PMF, the optic axis orientation measure has a DC offset that was subtracted during post-processing. The sensitivity was measured 97 dB, with a dynamic range of 57 dB obtained from a mirror and a 20 dB attenuator (40 dB in double-pass) in the sample arm.
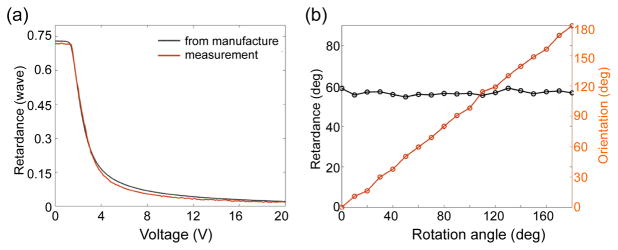
The high NA objective in OCM leads to a tight focus and short Rayleigh range. The confocal parameter (depth of focus) in the system was measured to be 5.6 μm. As the retardance manifests along the depth that light propagates through, the question is raised as to whether the retardance sensitivity and precision is sufficient for such a short depth of focus. The retardance was measured to be 2.7° when there’s no birefringence in the sample, setting the limit of the smallest retardance that our PS-OCM can detect. We used a liquid crystal variable retarder (Meadowlark Optics) to test the accuracy of the retardance measure. The retarder was placed before the microscope objective and a back reflector. The retardance of the crystal was manipulated by applying a voltage from 0 to 20 V, incremented by 0.1V. Fig. 2(a) shows the measured retardance (solid red) in unit of wave, and the data provided by the manufacture and converted to the wavelength of 1300 nm (dash black). In general, the measurement matches the expectation well over the entire range. The small discrepancy might result from the broad bandwidth of the light source, so the measured retardance at a certain voltage didn’t reveal the accuracy for single wavelength. In PS-OCM, we are more interested in the accuracy of measurement for low retardance and the sensitivity of detecting small change. Therefore, we compared the slopes of retardance curve at the lower end of the two plots in Fig. 2(a). We used a linear fit on retardance data corresponding to the voltage of 18 – 20 V, and obtained a slope of −1.50 × 10⁻³ WN/V for the measured data, compared to −2.02 × 10⁻³ WN/V for that provided by the manufacture.
Fig. 2.
Characterization of retardance (a) and optic axis orientation (b).
We tested the accuracy of the optic axis orientation by rotating a known retarder from 0° to 180° with 10° increments. Fig. 2(b) shows the measured orientation and retardance along with rotation. After subtraction of the common offset in the optic axis orientation, the measured orientation linearly increases from 0° to 180°, following the rotating angle of the retarder. The retardance on the other hand is flat in spite of rotation, proving that the measurement is independent of optic axis orientation. The mean measured retardance was 56.64°, compared to the expected value of 58.85°.
We used the PS-OCM to image a coronal section of a mouse brain. The animal was prepared under a protocol approved by the Subcommittee on Research and Animal Care at Massachusetts General Hospital. The brain was fixed by transcardial perfusion with 4% paraformaldehyde, cut in blocks, and embedded in agarose. Before scanning, the surface of the brain was flattened using a vibratome tissue slicer. The tissue was mounted on xyz translational stages. An automatic acquisition pipeline was developed to move the stages and acquire data to achieve large sample scanning. One optical scan covered an area of 200 × 200 μm2. The images were collected in tiles with 25% overlap in both the x- and y-direction, covering a total area of 2.3 × 5 mm2. Because of the limited Rayleigh range, investigation of retardance and optic axis orientation signals along z-axis was performed by focusing the light at different depths. We imaged the entire region at 10 focal depths with a 10 μm increment, up to 100 μm deep in the tissue. There were 4500 optical scans in total for the brain sample (450 on xy-plane x 10 focal depths).
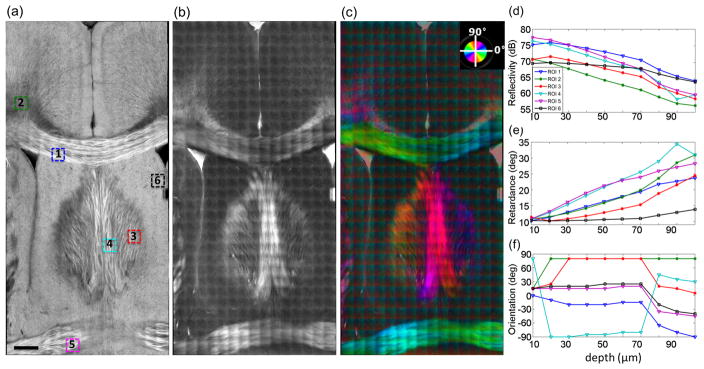
For each optical scan, the en-face images of reflectivity, retardance and optic axis orientation were created as a depth projection over 20 μm around the focus (10 μm above and below). The en-face reflectivity was computed as a maximum intensity projection. The en-face retardance was obtained by the mean value of retardance in depth. The en-face optic axis orientation was derived from a histogram approach, in which the distribution of orientation in depth was obtained with 5° binning interval and the orientation of peak frequency was chosen. The en-face images were stitched together for a certain focal depth. In the end, there are ten sets of stitched images created for the brain section, representing the reconstruction at ten focal depths. Fig. 3 illustrates the reflectivity (a), retardance (b) and optic axis orientation (c) maps of the mouse brain at the focal depth of 50 μm. The reflectivity reveals both gray and white matter. The small dark dots distributed all over the cortex and the subcortical nuclei represent the cell bodies of neurons. Most of the fiber tracts exhibit bright contrasts on the section. The radial fibers from the corpus callosum to the cortex are visible, and the small tracts within thick fiber bundles are distinguished. The fibers like cingulum (regions around ROI 2 in Fig. 3a) can be darker than the surrounding medium depending on the through-plane orientation. The retardance reliably identifies the white matter fibers. Small fibers from the corpus callosum to the cortex are visible as well. The brightness of the retardance signal implicates the apparent birefringence, which relates to fiber density, consistency of fiber alignment, through-plane orientation, and myelin birefringence. For example, the lower signal in the fimbria of hippocampus (the location of ROI 3 in Fig. 3a) indicates crossing fibers with relatively low density as shown on the reflectivity image. As retardance accumulates along light propagation, the signal at the focal depth of 50 μm carries the information above; therefore, the features of individual fibers are not as sharp as the reflectivity image, which catches the discontinuity of the refractive index at the focus depth. The optic axis orientation map clearly describes the in-plane orientation of big fiber tracts. The group orientations of the axonal fibers extending to the cortex in the left and right hemispheres are also distinguishable. The orientation in the gray matter region does not have a physical meaning; however, the color transition in individual tiles introduces a disruption on the stitched image.
Fig. 3.
Stitched en-face images of reflectivity (a), retardance (b) and optic axis orientation (c). In (c), the orientation value is indicated by the color wheel on the top right corner. The brightness is controlled by the retardance value. The numbers in (a) indicate the ROIs where the depth profiles of reflectivity (d), retardance (e) and optic axis orientation (f) were conducted at 10 imaging depths. ROIs: 1 – corpus callosum; 2 – cingulum; 3 – fimbria of hippocampus; 4 – fornix; 5 – anterior commissure; 6 – lateral septal nucleus. Scale bar: 400 μm.
We examined the signal changes of en-face reflectivity (d), retardance (e) and optic axis orientation (f) at the ten focal depths for six region of interests (ROIs). As indicated on Fig. 3(a), ROIs 1 (corpus callosum), 4 (fornix) and 5 (anterior commissure) are within big fiber bundles, whereas ROIs 2 (cingulum) and 3 (fimbria of hippocampus) are in the regions with the small fiber tracts, and ROI 6 (lateral septal nucleus) is located in gray matter. Each ROI covers 200 × 200 μm2. For reflectivity and retardance signals, the mean value of the ROI was calculated, while for the orientation signal, the histogram approach was used, the same as above for computing the en-face optic axis orientation. As shown on Fig. 3(d) – (f), the depths between 20 μm and 70 μm offer a favorable range for all the contrasts. Reflectivity and retardance exhibit a linear trend, while orientation is generally flat. Deeper than 70 μm, the signals are not reliable, probably due to the influence of multiple scattering in the focal volume. The decay of the reflectivity signals is greater in the white matter (ROIs 1 – 5) than the gray matter (black line, ROI 6), although the decay rate varies between different fiber regions. The retardance of the gray matter (ROI 6, black line) is flat and low within the first 70 μm depths. In contrast, linear increases are clearly seen in all the fiber tracts despite bearing different rates. We applied a linear fit in the reflectivity and retardance plots between depths of 20 μm and 70 μm and used the slope as an estimation of the apparent attenuation coefficient and the apparent birefringence for the ROIs. Table 1 shows the quantitative estimations. The orientation signal starts to stabilize after the first 10 – 20 μm depths. At very superficial depths, the orientation is not reliable, due to the weak signal in the cross-polarization channel. For example, the slow increasing rate of retardance in ROI 3 (red line in (e)) leads to a delayed occurrence of a trustworthy orientation signal (red line in (f)). The orientation in ROI 1 slightly shifts along depths, which may indicate altered in-plane orientation; however, the current orientation measure is not able to quantitatively estimate the change.
Table 1.
Estimation of the apparent attenuation coefficient and apparent birefringence for the six ROIs as shown in Fig. 3(a).
| ROI | appr. attenuation coeff. (dB/μm) | appr. birefringence (°/μm) |
|---|---|---|
| 1 | 0.105 | 0.162 |
| 2 | 0.163 | 0.167 |
| 3 | 0.123 | 0.103 |
| 4 | 0.158 | 0.259 |
| 5 | 0.178 | 0.220 |
| 6 | 0.036 | 0.015 |
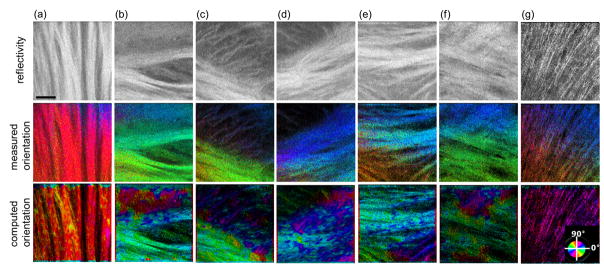
In order to better understand the validity and accuracy of the optic axis orientation under high resolution and small accumulation depths, we inspected the fiber tracts with a variety of morphologies and organizations in individual tiles. Fig. 4 demonstrates seven representative regions at the focal depths between 30 μm and 50 μm in tissue: vertical (a), horizontal (b), and negatively (c) and positively (d) tilted fiber bundles, fiber tracts with different sizes and orientations(e), crossing fibers (f), small fiber tracts (g). The measured optic axis orientation (middle row) was compared against the computed orientation (bottom row) generated with a structure tensor approach [15] The structure tensor takes the gradients in a local neighborhood of a specific point on the reflectivity image (top row), and estimates the fiber orientation by eigen-decomposition. The two types of orientation maps shared the same color-coding as shown in Fig. 3(c). In general, the polarization measured and structure tensor computed orientations display a high level of agreement, especially in large fiber bundles (a – d). The measured orientations show better uniformity within aligned bundles, whereas artificial patches are observed in the computed orientations due to the contamination of speckle noise. In small fiber tracts (g and lower e) where birefringence is low and the cross-polarization signal is weak, the measured orientation is less reliable. A trend of color transition is observed in the imaging plane. In contrast, the computed orientation captures the features and accurately estimates their orientation. In the crossing fiber region (f), the measured orientation represents the orientation of the fibers on the top layer and appears more reliable than the computed orientation. Therefore, the optic axis orientation measure is valid in PS-OCM where small depth accumulation is required; however, it is more reliable for larger fiber tracts where apparent birefringence is high so that the phase signal in the cross-polarization channel becomes more prominent and stable.
Fig. 4.
Fiber orientation maps in seven representative tiles (a – g) at the focal depth of 30 – 50 μm. Top: reflectivity; middle: optic axis orientation measured by PS-OCM; bottom: computed orientation using a structure tensor approach. The color wheel at the bottom right indicates the orientation values. Scale bars: 50 μm.
In summary, we built a PMF based spectral domain PS-OCM to study neuronal structures and fiber orientations in ex-vivo brain with 1.3 μm transverse resolution. The study shows that at shallow depths ranging from 20 μm to 70 μm, the PS-OCM is capable of revealing reflectivity, retardance and optic axis orientation information. The accuracy of fiber orientation maps depends on the apparent birefringence (slope of retardance), which was affected by the fiber size and density. The optic axis orientation is superior in revealing grouped fibers at the depths of 30 – 50 μm. Further technical improvement on minimizing the wavelength dependency of the polarization manipulation optics would enhance the sensitivity of retardance and orientation and might allow us to measure micron scale fiber tracts. Currently, the optic axis orientation is not able to reveal the change of in-plane orientation with depth. To overcome the problem, a depth resolved Jones calculus in PS-OCM might be useful [16]. The development of PS-OCM may provide an approach for bridging the macroscopic and microscopic scales of 3D reconstruction of fiber maps in human brain.
Acknowledgments
Funding. NIH EB015896, NS055104, NS091230, EB021018, EB018464, AG042026 and NSF 1510674.
Footnotes
OCIS codes: (180.1655) Coherence tomography; (290.5855) Scattering; polarization; (170.0180) Microscopy; (170.3880) Medical and biological imaging.
References
- 1.Wang Hui, Zhu Junfeng, Akkin Taner. Serial optical coherence scanner for large-scale brain imaging at microscopic resolution. NeuroImage. 2014;84:1007–1017. doi: 10.1016/j.neuroimage.2013.09.063. [DOI] [PMC free article] [PubMed] [Google Scholar]
- 2.Min Eunjung, Lee Junwon, Vavilin Andrey, Jung Sunwoo, Shin Sungwon, Kim Jeehyun, Jung Woonggyu. Wide-field optical coherence microscopy of the mouse brain slice. Opt Lett. 2015;40:4420–4423. doi: 10.1364/OL.40.004420. [DOI] [PubMed] [Google Scholar]
- 3.Magnain Caroline, Augustinack Jean C, Reuter Martin, Wachinger Christian, Frosch Matthew P, Ragan Timothy, Akkin Taner, Wedeen Van J, Boas David A, Fischl Bruce. Blockface histology with optical coherence tomography: a comparison with Nissl staining. Neuroimage. 2014;84:524–533. doi: 10.1016/j.neuroimage.2013.08.072. [DOI] [PMC free article] [PubMed] [Google Scholar]
- 4.Srinivasan Vivek J, Radhakrishnan Harsha, Jiang James Y, Barry Scott, Cable Alex E. Optical coherence microscopy for deep tissue imaging of the cerebral cortex with intrinsic contrast. Opt Express. 2012;20:2220–2239. doi: 10.1364/OE.20.002220. [DOI] [PMC free article] [PubMed] [Google Scholar]
- 5.Leahy Conor, Radhakrishnan Harsha, Srinivasan Vivek J. Volumetric imaging and quantification of cytoarchitecture and myeloarchitecture with intrinsic scattering contrast. Biomed Opt Express. 2013;4:1978–1990. doi: 10.1364/BOE.4.001978. [DOI] [PMC free article] [PubMed] [Google Scholar]
- 6.Magnain Caroline, Augustinack Jean C, Konukoglu Ender, Frosch Matthew P, Sakadžić Sava, Varjabedian Ani, Garcia Nathalie, Wedeen Van J, Boas David A, Fischla Bruce. Optical coherence tomography visualizes neurons in human entorhinal cortex. Neurophotonics. 2015;2:015004. doi: 10.1117/1.NPh.2.1.015004. [DOI] [PMC free article] [PubMed] [Google Scholar]
- 7.Li Fengqiang, Song Yu, Dryer Alexandra, Cogguillo William, Berdichevsky Yevgeny, Zhou Chao. Nondestructive evaluation of progressive neuronal changes in organotypic rat hippocampal slice cultures using ultrahigh-resolution optical coherence microscopy. Neurophotonics. 2014;1:025002. doi: 10.1117/1.NPh.1.2.025002. [DOI] [PMC free article] [PubMed] [Google Scholar]
- 8.Arous Juliette Ben, Binding Jonas, Léger Jean-François, Casado Mariano, Topilko Piotr, Gigan Sylvain, Claude Boccara A, Bourdieu Laurent. Single myelin fiber imaging in living rodents without labeling by deep optical coherence microscopy. J Biomed Opt. 2011;16:116012. doi: 10.1117/1.3650770. [DOI] [PubMed] [Google Scholar]
- 9.de Boer Johannes F, Milner Thomas E, van Gemert Martin JC, Stuart Nelson J. Two-dimensional birefringence imaging in biological tissue by polarization-sensitive optical coherence tomography. Opt Lett. 1997;22:934–936. doi: 10.1364/ol.22.000934. [DOI] [PubMed] [Google Scholar]
- 10.Wang Hui, Al-Qaisi Mohammed K, Akkin Taner. Polarization-maintaining fiber based polarization-sensitive optical coherence tomography in spectral domain. Opt Lett. 2010;35:154–156. doi: 10.1364/OL.35.000154. [DOI] [PubMed] [Google Scholar]
- 11.Wang Hui, Black Adam J, Zhu Junfeng, Stigen Tyler W, Al-Qaisi Muhammad K, Netoff Theoden I, Abosch Aviva, Akkin Taner. Reconstructing micrometer-scale fiber pathways in the brain: multi-contrast optical coherence tomography based tractography. NeuroImage. 2011;58:984–992. doi: 10.1016/j.neuroimage.2011.07.005. [DOI] [PMC free article] [PubMed] [Google Scholar]
- 12.Moneron Gael, Boccara Albert-Claude, Dubois Arnaud. Polarization-sensitive full-field optical coherence tomography. Opt Lett. 2007;32:2058–2060. doi: 10.1364/ol.32.002058. [DOI] [PubMed] [Google Scholar]
- 13.Zhang Pengfei, Mehta Kalpesh, Rehman Shakil, Chen Nanguang. Imaging single chiral nanoparticles in turbid media using circular-polarization optical coherence microscopy. Sci Rep. 2014;4:4979. doi: 10.1038/srep04979. [DOI] [PMC free article] [PubMed] [Google Scholar]
- 14.Cense Barry, Nassif Nader A, Chen Teresa C, Pierce Mark C, Yun Seok-Hyun, Hyle Park B, Bouma Brett E, Tearney Guillermo J, de Boer Johannes F. Ultrahigh-resolution high-speed retinal imaging using spectral-domain optical coherence tomography. Opt Express. 2004;12:2435–2447. doi: 10.1364/opex.12.002435. [DOI] [PubMed] [Google Scholar]
- 15.Wang Hui, Lenglet Christopher, Akkin Taner. Structure tensor analysis of serial optical coherence scanner images for mapping fiber orientations and tractography in the brain. J Biomed Opt. 2015;20:036003. doi: 10.1117/1.JBO.20.3.036003. [DOI] [PMC free article] [PubMed] [Google Scholar]
- 16.Fan Chuanmao, Yao Gang. Imaging myocardial fiber orientation using polarization sensitive optical coherence tomography. Biomed Opt Express. 2013;4:460–465. doi: 10.1364/BOE.4.000460. [DOI] [PMC free article] [PubMed] [Google Scholar]


