

Summary
Understanding how > 30 types of retinal ganglion cells (RGCs) in the mouse retina each contribute to visual processing in the brain will require more tools that label and manipulate specific RGCs. We screened and analyzed retinal expression of Cre recombinase using 88 transgenic driver lines. In many lines, Cre was expressed in multiple RGC types and retinal cell classes, but several exhibited more selective expression. We comprehensively mapped central projections from RGCs labeled in 26 Cre lines using viral tracers, high-throughput imaging, and a data processing pipeline. We identified over 50 retinorecipient regions, and present a quantitative retina-to-brain connectivity map, enabling comparisons of target-specificity across lines. Projections to two major central targets were notably correlated; RGCs projecting to the outer shell or core regions of the lateral geniculate projected to superficial or deep layers within the superior colliculus, respectively. Retinal images and projection data are available online at www.connectivity.brain-map.org.
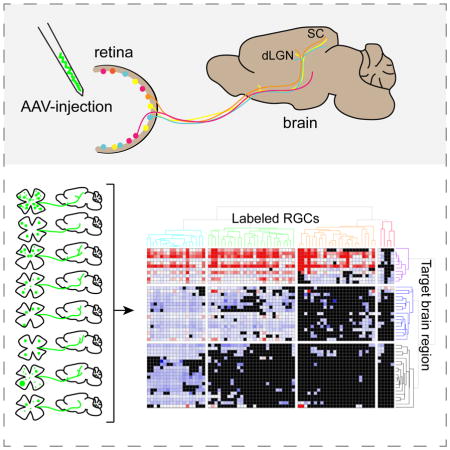
Graphical Abstract
Introduction
The vertebrate retina is a sophisticated image-processing device (Gollisch and Meister, 2010). Photoreceptors that transduce light into electrical signals form synapses on interneurons, which process the signals and transmit them to a layer of retinal ganglion cells (RGCs). The RGCs, in turn, send axons through the optic nerve to retinorecipient areas in the brain (Masland, 2012). There are >30 RGC types, which receive distinct patterns of input from the ~70 types of interneurons and thereby become tuned to particular visual features, such as motion in a particular direction, oriented lines, or color contrast (Sanes and Masland, 2015;Baden et al., 2016). As a consequence, the optic nerve carries many parallel representations of the world to the brain.
Another level of complexity arises in the projections of the RGCs. The main retinorecipient areas in mammals are the superior colliculus (SC) and the dorsal lateral geniculate nucleus (LGd) but nearly 40 additional brain regions receive direct input from RGCs (Fleming et al., 2006; Gaillard et al., 2013; Morin and Studholme, 2014). Different RGC types project to distinct combinations of retinorecipient areas (Hattar et al., 2006; Berson, 2008; Yonehara et al., 2009; Kay et al., 2011; Osterhout et al., 2011; Dhande et al., 2013; Dhande et al., 2015); several of these areas are essential for specific behaviors, such as gaze control (superior colliculus), the optokinetic reflex (pretectal nuclei), and circadian rhythms (suprachiasmatic nucleus) (reviewed in Dhande et al., 2015). Even within the SC and LGd, distinct RGC types project to different laminae, which in turn supply distinct higher order centers (Kim et al., 2010; Hong et al., 2011; Cruz-Martin et al., 2014).
The finding that RGC types responsive to different visual features engage different targets supports an emerging consensus that different RGC types contribute disproportionately to different behaviors (Dhande et al., 2015). To understand how the organization of visual pathways supports these behaviors, we need better genetic access to RGCs. In mice, such access is currently best achieved by “driver lines” in which Cre or Flp recombinase is expressed in specific neuronal types; use of recombinase-dependent reporters allows these neurons to be selectively marked and manipulated (Huang and Zeng, 2013; Harris et al., 2014). We surveyed a collection of 88 “Cre driver” lines, seeking ones in which specific RGC types are labeled. For 26 of these lines, we comprehensively and quantitatively mapped projections from Cre-defined RGCs to all retinorecipient areas. These data are accessible through the Allen Mouse Brain Connectivity Atlas portal, with associated visualization tools (Oh et. al, 2014, www.connectivity.brain-map.org). Our results reveal a rich variety of projection patterns from eye to brain.
Results
Cre expression in the adult retina of 88 driver lines
To begin, we surveyed Cre driver lines for expression in the retina (Table 1 and Table S1); whole brain Cre expression was previously reported for most of these lines (Harris et al., 2014); http://connectivity.brain-map.org/transgenic). To label Cre-expressing retinal cells we injected adult eyes intravitreally with a recombinant adeno-associated viral (rAAV) vector encoding Cre-dependent EGFP. We used serotype 1 for this screen because initial studies with Cre-independent vectors showed that it is capable of infecting all retinal cell classes following intravitreal injection (data not shown). Following viral infection (n=1–3 mice per line), retinas were examined in whole mount, and then fixed, sectioned, and stained with anti-GFP to enhance detection of Cre-expressing cells.
Table 1.
Retinal cell types labeled in Cre lines screened by intravitreal injection of reporter virus.
| Number | Line | GCL | RGCs | INL | Cell Classes |
|---|---|---|---|---|---|
| 1 | A930038C07Rik-Tg1-Cre | + | yes | + | AC, BC, MG |
| 2 | Adcyap1-2A-Cre | ++ | yes | + | MG |
| 3 | Agrp-IRES-Cre | + | yes | + | AC, BC, MG, PR |
| 4 | Calb2-IRES-Cre | + | yes | + | AC, HC |
| 5 | Cart-IRES2-Cre | + | yes | + | AC |
| 6 | Cart-Tg1-Cre | ++ | yes | + | AC |
| 7 | Cck-IRES-Cre | + | yes | + | AC, BC |
| 8 | Cdh4-CreER | + | yes | ++ | AC, HC |
| 9 | Cdh6-CreER | ++ | yes | + | AC |
| 10 | Cdhr1-Cre_KG66 | − | no | − | |
| 11 | Chrna2-Cre_OE25 | − | no | − | |
| 12 | Chrnb4-Cre_OL57 | + | yes | + | AC, HC, PR |
| 13 | Cnnm2-Cre_KD18 | ++ | yes | + | AC |
| 14 | Cort-T2A-Cre | + | yes | ++ | AC, BC, HC |
| 15 | Crh-IRES-Cre (ZJH) | + | yes | + | AC |
| 16 | Crh-IRES-Cre (BL) | + | yes | + | AC |
| 17 | Cux2-IRES-Cre | ++ | yes | ++ | AC, BC, HC, MG |
| 18 | Dbh-Cre_KH212 | − | no | − | |
| 19 | Dbx1-IRES-Cre | + | ? | ++ | AC, HC, MG, PR |
| 20 | Dcx-CreERT2 | + | no | + | AC |
| 21 | Dcx-Cre-35 | ++ | yes | + | AC |
| 22 | Drd1a-Cre | ++ | yes | ++ | AC, BC, HC |
| 23 | Drd2-Cre_ER44 | + | yes | ++ | AC, BC, HC |
| 24 | Drd3-Cre_KI196 | + | yes | + | AC |
| 25 | Efr3a-Cre_NO108 | − | no | − | |
| 26 | Erbb4-2A-CreERT2 | − | no | + | AC |
| 27 | Etv1-CreERT2 | + | yes | + | AC |
| 28 | Fezf1-2A-Cre | + | no | + | AC |
| 29 | Foxp2-IRES-Cre | + | yes | + | AC |
| 30 | Fstl4-CreERT2/KIAA- | + | yes | + | AC |
| 31 | Gabra6-IRES-Cre | ++ | yes | + | AC, BC |
| 32 | Gabrr3-Cre_KC112 | + | yes | ++ | BC, HC |
| 33 | Gad2-IRES-Cre | + | ? | ++ | AC |
| 34 | Gal-Cre_KI87 | + | yes | + | AC, PR |
| 35 | Gnb4-2A-Cre | + | yes | + | AC |
| 36 | Gng7-Cre_KH71 | + | yes | + | AC |
| 37 | Gpr26-Cre_KO250 | + | yes | + | AC |
| 38 | Grik4-Cre | + | yes | + | AC |
| 39 | Grm2-Cre_MR90 | + | yes | + | AC |
| 40 | Grp-Cre_KH288 | + | yes | + | AC, HC |
| 41 | Hdc-Cre_IM1 | − | no | + | AC, MG |
| 42 | Htr2a-Cre_KM207 | + | yes | ++ | AC, BC |
| 43 | Ins2-Cre | + | yes | ++ | AC, BC, HC, MG |
| 44 | Jam2-Cre | ++ | yes | ++ | AC |
| 45 | Jam2-CreER | + | yes | + | AC |
| 46 | Kcnc2-Cre | − | no | + | AC, HC |
| 47 | Kcng4-Cre | ++ | yes | + | BC |
| 48 | Kiss1-Cre | + | yes | ++ | AC |
| 49 | Lepr-IRES-Cre | − | no | + | AC |
| 50 | Gnrh1-Cre/Lhrh-Cre | − | no | − | |
| 51 | Neto1-Cre | + | yes | + | AC |
| 52 | Nr5a1-Cre | − | no | − | |
| 53 | Ntrk1-IRES-Cre | − | no | − | |
| 54 | Ntsr1-Cre_GN220 | + | yes | + | AC, BC, HC, MG |
| 55 | Otof-Cre | + | yes | + | BC, MG, PR |
| 56 | Otof-CreERT2 | − | no | − | |
| 57 | Oxt-IRES-Cre | − | no | + | AC, BC, HC |
| 58 | Pcdh9-Cre_NP276 | + | yes | + | AC |
| 59 | Pde1c-2A-Cre | + | yes | + | BC, MG |
| 60 | Pdzk1ip1-Cre_KD31 | + | yes | + | AC, BC, MG |
| 61 | Pmch-Cre | + | yes | + | AC, BC, HC, MG, |
| 62 | Pnmt-Cre | − | no | + | AC |
| 63 | Pomc-Cre (ST) | + | yes | ++ | AC |
| 64 | Pomc-Cre (BL) | − | no | − | |
| 65 | Ppp1r17-Cre_NL146 | + | yes | + | AC |
| 66 | Prkcd-GluCla-CFP-IRES-Cre | + | yes | ++ | AC, BC, MG |
| 67 | Pvalb-IRES-Cre | ++ | yes | + | AC |
| 68 | Satb2-Cre_MO23 | + | yes | + | AC, BC, HC |
| 69 | Scnn1a-Tg2-Cre | + | yes | + | AC |
| 70 | Scnn1a-Tg3-Cre | + | yes | + | AC |
| 71 | Sdk2-CreER | + | yes | ++ | AC, HC |
| 72 | Slc17a6-IRES-Cre | ++ | yes | + | AC, HC |
| 73 | Slc18a2-Cre_OZ14 | + | yes | + | AC |
| 74 | Slc32a1-IRES-Cre | − | no | ++ | AC |
| 75 | Slc6a3-Cre | − | no | + | AC |
| 76 | Slc6a4-Cre_ET33 | + | yes | + | AC, HC, MG |
| 77 | Slc6a5-Cre_KF109 | − | no | + | AC |
| 78 | Sst-Cre | − | no | − | |
| 79 | Syt17-Cre_NO14 | − | no | − | |
| 80 | Syt6-Cre_KI148 | + | yes | − | |
| 81 | Tac2-IRES2-Cre | ++ | no | + | AC |
| 82 | Thy1-Cre | ++ | yes | + | AC |
| 83 | Tlx3-Cre | − | no | − | |
| 84 | Trib2-2A-CreERT2 | ++ | yes | ++ | AC, BC, MG |
| 85 | Ucn3-Cre_KF43 | − | no | + | AC, MG, PR |
| 86 | Vip-IRES-Cre | − | no | ++ | AC |
| 87 | Vipr2-Cre_KE2 | + | yes | ++ | AC |
| 88 | Wfs1-Tg3-CreERT2 | + | yes | + | AC |
+ = present, ++ = numerous. BOLD = line used for central projection mapping. Abbreviations; amacrine cells, AC; bipolar cells, BC; horizontal cells, HC; Muller glia, MG; photoreceptors, PR
We identified retinal cell classes primarily by laminar position within the retina. Layers and cells of the retina are schematized in Figure 1a. Three cellular (nuclear) layers are separated by two synaptic (plexiform) layers. The outer nuclear layer (ONL) contains photoreceptors (rods and cones); the inner nuclear layer (INL) contains interneurons (horizontal, bipolar and amacrine cells) as well as Müller glia; and the ganglion cell layer (GCL) contains RGCs as well as amacrine cells. Within the INL, somata are layered in the rough order horizontal, bipolar, Müller glia and amacrine cells (outside to inside). Counterstaining sections with DAPI marks all cells and laminar boundaries and permits tentative identification of most cell classes (Figure 1b). Because RGCs and amacrine cells are intermingled in the GCL in roughly equal proportions (Jeon et al., 1998; Pang and Wu, 2011), we used antibodies to the pan-RGC markers RBPMS (Rodriguez et al., 2014) and Brn3 transcription factors (Xiang et al., 1995), or the amacrine marker AP2a to distinguish these two cell classes (Figure 1c).
Figure 1. Diverse retinal cell types labeled by Cre-dependent rAAV reporter in Cre driver lines.

(a) Sketch of retina showing cell types and layers. ONL, outer nuclear layer; OPL, outer plexiform layer; INL, inner nuclear layer; IPL, inner plexiform layer; GCL, ganglion cell layer; R, rod photoreceptor; C, cone photoreceptor; H, horizontal cell; B, bipolar cell; A, amacrine cell; M, Muller glia; RGC, retinal ganglion cell. (b–i) Cre-expressing lines were injected intravitreally with rAAV encoding Cre-dependent EGFP. Sections were stained with anti-GFP. Section in (b) was also stained with DAPI to mark all cells. Section in (c) was stained with anti-AP2a (red) to mark amacrine cells and anti-VAChT (blue) to mark dendrites of starburst amacrine cells in the IPL. Sections in (h,i) were labeled with anti-RBPMS and anti-VAChT to mark both RGCs and dendrites of starburst amacrine cells; arrowheads point to RGCs. In (a–g) bracket marks IPL layer. (b) RGCs and amacrines in Grm2-Cre_MR90. (c) RGCs in Slc17a6-IRES-Cre. (d) RGCs, amacrines and horizontal cells in Cux2-IRES-Cre. (e) Narrow-field amacrine cells in Pnmt-Cre. (f) A17 amacrine cell in Slc6a5-Cre_KF109. (g) RGCs and amacrine cells in Wfs1-Tg3-CreERT2. Pcdh9-Cre_NP276 (e) and Grik4-Cre (f) selectively label RGCs that cofasciculate with starburst amacrine cells in S4, a characteristic of ON-DSGCs. Grik4-Cre also contains some CART-positive ooDSGCs (not shown). Scale bars 25μm.
Results from 88 Cre lines are summarized in Table 1. Neurons were labeled in the GCL of 65 of these lines; 60 contained GFP-positive RGCs, confirmed by RBPMS co-staining. In most of these lines, amacrine cells were also labeled but, in some, labeling in the GCL was largely confined to RGCs (e.g. Figure 1c). Cells were also labeled in the ONL of 7 lines and in the INL of 75 lines. Within the INL, horizontal cells, bipolar cells, amacrine cells and Muller glia were labeled in at least 19, 21, 70, and 16 of the lines, respectively. In a few lines, GFP expression was absent from the GCL, but amacrine cells were labeled in the INL. For example, Pnmt-Cre labeled several classes of narrow-field amacrines (Figure 1e) and Slc6a5-Cre_KF109 labeled several amacrine types, including what appeared to be A17 amacrine cells, characterized by the “waterfall” appearance of their dendritic arbor (Figure 1f, Grimes et al., 2010).
Comparison of cumulative and adult labeling patterns
Results in Table 1 reflect Cre expression in adults. Additional neuronal populations might express Cre transiently during development. To characterize the lifetime expression of Cre in the retina, we supplemented our survey by crossing 33 lines to a Cre-dependent reporter line (Buffelli et al., 2003; Madisen et al., 2010). Results are summarized in Figure S1a. In most cases, transgene reporter labeled the same classes of cells as rAAV in adults, but with greater numbers of cells labeled by the reporter (Figure S1b). These differences are consistent with either early expression in additional cells or limited infectivity by rAAV. In some lines, however, cell classes labeled by the reporter line were not labeled by rAAV. For example, horizontal cells were labeled in the Adcyap1-2A-Cre and Cdh6-CreER lines when crossed to a reporter but not when they were infected with rAAV as adults. We interpret such differences as reflecting a transient, developmental phase of Cre expression.
RGC types that express Cre in 26 Driver Lines
Based on results from the initial screen, we selected 26 lines with labeled RGCs for more detailed characterization, again using Cre-dependent rAAV. In this series, we used rAAV serotype 2 (rAAV2) because it labels cells efficiently in the GCL, but poorly in the INL, enhancing our ability to distinguish RGC arbors in the inner plexiform layer (IPL) from those of amacrines or bipolar cells. We also injected only one eye, so we could distinguish contra- from ipsi-lateral projections. In addition, we found that the rAAV serotype 1 (rAAV1) used in the initial screen led to inflammation and necrosis in some retinas, which was minimal when using rAAV2 prepared from the same viral reporter plasmid. We did not investigate whether this damage was a general property of rAAV1 or related to the specific viral preparation used.
We characterized the GFP-labeled (i.e. Cre-expressing) RGCs in two ways. First, we stained sections with antibodies to a panel of cell type-specific markers: (1) RBPMS, which labels RGCs but not amacrine cells (Rodriguez et al., 2014); (2) osteopontin (OPN), which labels alpha RGCs (Duan et al., 2015); (3) CART, which labels ON-OFF direction-selective RGCs (ooDSGCs, Kay et al., 2011); (4) Foxp2, which labels 2 types of small direction-selective RGCs and 2 types of medium-sized direction-nonselective RGCs (Rousso et al., 2016); and (5) parvalbumin (Pvalb), which labels 11 types of RGCs that include alpha RGCs and ooDSGCs, as well as others (Yi et al., 2012; Farrow et al., 2013). In some cases, we also stained sections with antibodies to melanopsin (Opn4), which labels 3 types of intrinsically photosensitive (ip)RGCs (Schmidt et al., 2011) and Brn3a, which labels the majority of RGCs (Badea et al., 2009). Together this panel allowed us to estimate the fraction of GFP-positive cells in the GCL that were RGCs, and the fraction of the GFP-positive RGCs that corresponded to previously described types. Second, we documented the sublaminae of the IPL within which dendrites of labeled RGCs arborized. Dendrites of each RGC type are restricted to one or a few sublaminae, and laminar pattern has been a principal criterion for classifying RGCs (Sanes and Masland, 2015). To register lamination, we used staining with anti-VAChT (vesicular acetylcholine transporter), which labels the dendrites of starburst amacrine cells, to divide the IPL into 5 sublaminae, with S1 being closest to the INL and S5 being closest to the GCL. Epifluorescent images of antibody staining in these 26 Cre lines are available at http://connectivity.brain-map.org/transgenic. For quantification of co-labeled cells, however, we scanned immunostained sections using a confocal microscope. Confocal images from one line, Htr2a-Cre_KM207, are shown in Figure S2.
Results are summarized in Figure 2. For all lines, most GFP-positive cells in the GCL were RGCs as assessed by co-staining with RBPMS. Because few retinas were analyzed for each line (n=1–3) and labeling was often sparse, we report the fraction of GFP-positive RGCs labeled by a type-specific marker in broad ranges. Likewise, in some lines it was not possible to distinguish GFP-positive dendrites of RGCs from those of amacrine cells, leading to some ambiguity in laminar assignments. Nonetheless, the combination of type-specific markers and restriction of RGC dendrites in the IPL allowed us to divide the lines into six groups: (1) all or most RGC types labeled by Cre, (2) multiple, but not all, RGC types labeled, and (3–6) lines enriched for one of a few RGC types.
Figure 2. RGC types labeled and laminar distribution of all labeled dendrites in IPL in 26 Cre driver lines.

Expression of Cre in known RGC types was assessed for each line based on co-staining with type-specific markers (a) and lamination patterns in the IPL (b). (a) The fraction of GFP-positive cells in the ganglion cell layer that colocalized with specific RGC marker antibodies was assessed for each Cre line. Colors indicate % of GFP-positive cells in the ganglion cell layer that were RGCs (RBPMS-positive) or the % of GFP-positive RGCs that were alpha RGCs (OPN-positive), Pvalb-positive, ooDSGCs (CART-positive), or F-RGCs (Foxp2-positive). (b) Each sketch summarizes laminar distribution results from a single line. The IPL was divided into 5 roughly equal sublaminae, S1–S5, using anti-VAChT to mark S2 and S4 (see Figure 1). Color bands indicate density of labeling from cells in the GCL (RGCs and amacrines). Colored text indicates cluster membership based on central projection patterns shown in Figure 4; black = cluster 1, green = cluster 2, orange = cluster 3, red = cluster 4.
All RGC types were labeled in Slc17a6-IRES-Cre and Thy1-Cre mice, consistent with immunostaining results (Barnstable and Drager, 1984; Stella et al., 2008). Cux2-IRES-Cre, Drd1a-Cre, and Jam2-Cre also label large numbers of RGC types, as judged both by the type-specific markers and by the broad coverage of the IPL by their dendrites.
RGCs of multiple, but not all, types were labeled in many lines. For example, in the Htr2a-Cre_KM207 line, few CART- or Foxp2-positive DSGCs and no Opn4-positive ipRGCs were labeled (Figure S2). Similarly, RGCs labeled in the Calb2-IRES-Cre, Slc18a2-Cre_OZ14, and FoxP2-IRES-Cre lines did not co-express the alpha RGC marker OPN, and GFP+ RGCs in the FoxP2-IRES-Cre line did not co-express OPN or the ooDSCG marker, CART. Interestingly, GFP-positive dendrites exhibited laminar restriction in several of these lines, suggesting expression is in a more limited number of RGC types yet to be identified. For example, in Slc18a2-Cre_OZ14, dendrites were all but excluded from S2 and S4.
ooDSGCs were preferentially labeled in three lines, Cart-Tg1-Cre, Cdh6-CreER, and Gpr26-Cre_KO250, based on CART co-expression and dendritic lamination patterns (fasciculating with processes of starburst amacrine cells in S2 and S4). Labeling by Cdh6-CreER was characterized previously (Kay et al., 2011). In that study, ooDSGCs were labeled almost exclusively following injection of tamoxifen at birth. The less specific labeling observed here following tamoxifen injection at ~P56 may indicate broader expression of cdh6 in adults. Labeling of ooDSGCs by Cart-Tg1-Cre is consistent with results of Kay et al. (2011), who showed that anti-CART marks ooDSGCs. Of these lines, labeling by Cdh6-CreER was most selective for ooDSGCs and that by Gpr26-Cre_KO250 least selective. In Figure 2, GFP is shown across IPL layers for Cart-Tg1-Cre; this is likely due to the presence of both CART-positive amacrine cells and some Cre-positive RGCs that do not stain with CART antibodies.
Most RGCs labeled in the Pcdh9-Cre_NP276 and Grik4-Cre lines bore dendrites that costratify with the innermost starburst amacrine cell processes (sublamina S4; Figures 1h,i and 2). This morphology is characteristic of ON-DSGCs (Sun et al., 2006). Grik4-Cre also labels some CART-positive ooDSGCs as previously described (Ivanova et al., 2010), but in our hands predominant labeling was of the monostratified ON population.
A single OFF DSGC RGC type, the J-RGC, which laminates in S1, is labeled in Jam2-CreER (Kim et al., 2008). This pattern differed dramatically from that of the Jam2-Cre line, which labeled many RGC types, and is therefore included in group 1. Immunostaining shows preferential expression of Cre in J-RGCs in both lines, but low levels of Cre expression in other RGCs are sufficient to activate GFP in Jam2-Cre, with constitutive Cre activity, but not in Jam2-CreER, with tamoxifen-induced Cre activity (J. L. and J.R.S., in preparation).
OPN-positive alpha RGCs were selectively labeled in four lines, Crh-IRES-Cre, Etv1-CreERT2, Gal-Cre_KI87 and Kcng4-Cre (Figure 2 and Figure S3). There are four alpha RGC subtypes with two ON and two OFF types arborizing in the inner and outer portions of the IPL, respectively. We have shown previously that all are labeled in the Kcng4-Cre line (Krieger submitted, Duan et al., 2015). In contrast, inspection of the IPL suggests that Gal-Cre_KI87, Etv1-CreERT2, and Crh-IRES-Cre preferentially label OFF-alpha RGCs.
An inventory of retinorecipient areas in the mouse brain
To identify the full set of retinorecipient areas in the mouse brain, we labeled RGC axons in three ways, each expected to label all RGC types: 1) Injection of Cre-dependent rAAV-EGFP into retinas of Thy1-Cre mice; 2) Injection of Cre-dependent rAAV-EGFP into retinas of Slc17a6-IRES-Cre mice; and 3) Injection of fluorophore-tagged cholera toxin B subunit (CTB-488 or CTB-555) into retinas of wild type mice. Following fixation and sectioning, brains were imaged through their entire rostral-caudal extent. The resulting image series (see Movie S1 for Thy1-Cre+ RGC axons across the brain) were registered in 3-D to the Allen Mouse Common Coordinate Framework (CCF), enabling voxel-based automated signal detection and assignment to annotated brain structures (Kuan et al., 2015).
All three methods revealed very similar sets of retinorecipient areas, as judged by the presence of ramified RGC terminals (Figure 3 and Table S2). Although the density of retinal axons varied greatly among regions, we were able to resolve even very sparse terminal zones due to the high resolution imaging and robust fluorescence produced by the viral tracer (Figure 3m–r). We identified 34 retinorecipient brain regions containing projections from the contralateral eye; 25 of these areas also received ipsilateral projections, for a total of 59 areas. No regions received solely ipsilateral projections. Retinorecipient regions were in the thalamus, midbrain, hypothalamus and amygdala/pallidum; labeled fibers were not observed in forebrain, hindbrain or cerebellum. The projection targets and patterns we identified are very similar to those described in a recent analysis using CTB as a tracer (Morin and Studholme, 2014). Several potential differences were accounted for by translating between alternative nomenclatures. These differences, and the few discrepancies between our results and those of Morin and Studholme, are listed in Table S2; nearly all were in regions with very sparse innervation. Most of the retinorecipient areas are defined in the current Allen Mouse CCF, but refined annotation of the medial terminal nucleus of the accessory optic tract (MT) was necessary to obtain quantitative values of projection strength.
Figure 3. Retinorecipient regions in the mouse brain.

(a) Brain-wide projections from the retina (yellow) in a lateral view of the mouse brain. Retinorecipient regions are shown in different colors which correspond to major brain subdivisions within the Allen Mouse Common Coordinate Framework (CCF). (b–l) Coronal plates (at the levels indicated by dashed lines in a) showing brain regions annotated in the Allen Mouse CCF that contain RGC axon terminals. RGCs were labeled by injection of Cre-dependent rAAV EGFP into the left eye of Thy1-Cre mice; all RGC types are labeled in this line. Contralateral (right side) and ipsilateral (left side) brain structures containing labeled retinal projections are shown as colored regions in the eleven coronal plates along the rostral-to-caudal axis. (m–r) Selected images show axon terminals within six regions, corresponding to the boxes in panels e, g, h, j and k. Note that the retinal input to each target may be sparse and/or present in only small sub-regions of larger structures. Abbreviations for each target region are in Table 3. Colors: hypothalamus = red, amygdala/pallidum = blue, thalamus = pink, midbrain = purple.
Whole brain projections from RGCs in 26 Cre driver lines
We quantified axonal projections from RGCs to the brain areas described above for the 26 Cre lines (2–3 per line, 74 total), generating a retina-to-brain connectivity map of projection strengths (Figure 4, source data also provided). Eleven of the 59 targets listed in Table S2 were excluded from quantitative analysis due to sparse signals, resulting in a 48×74 matrix. We manually validated the presence/absence of labeled fibers in each target for every experiment, assigning all true negatives a value of “0”. Projection strength is defined here as the number of segmented pixels within all voxels in a given brain structure. We also normalized projection strength at each target to the optic chiasm as a proxy for injection site strength, to facilitate comparisons between experiments; all RGC axons pass through the chiasm. Normalized projection strengths measured in the retinorecipient regions spanned over 10 orders of magnitude (Log10 −9.46 to +3.26), with a median value of Log10 −0.97.
Figure 4. Retina-to-brain connectivity map.

Each column shows one injection experiment. Rows show retinorecipient regions included for quantitative analysis. The projection strength is quantified as the sum of all algorithmically-detected (segmented) fluorescent pixels within a given structure of the Allen Mouse CCF. Data were normalized by dividing the segmented projection volume in each structure with the segmented injection volume in the optic chiasm. Negative regions (no fluorescent signal or only passing fibers) verified by manual analysis are shown in black. The color map indicates Log10-transformed normalized projection volumes. Unsupervised hierarchical clustering of the experiments and target regions (using Euclidean distance and average linkage method) identified four major clusters of experiments and three major groups of retinal target regions among this set of Cre lines. Abbreviations for each target region are in Table 3. “-R” is right side and contralateral to injected eye. “-L” is left side and ipsilateral to injected eye.
Prior studies would predict that individual RGC types project to specific, non-random sets of all possible central targets. As an example, we looked at the brain-wide targets of the Cre lines identified by retinal data as enriched for alpha RGCs; Kcng4-Cre, Crh-IRES-Cre (BL), Etv1-CreERT2, and Gal-Cre_KI87 (Figure 2 and Table S3). Kcng4-Cre, which labels all types of alpha RGCs, had the most extensive projections. Terminals were reliably identified in most retinorecipient nuclei of the hypothalamus, midbrain, and thalamus. Terminals were not seen in MEA. Notably, in the midbrain, the only targets not containing terminals were accessory optic nuclei, MT and LT. Etv1-CreERT2, Gal-Cre_KI87, and Crh-IRES-Cre (BL) RGCs each contacted a subset of the Kcng4-Cre targets above (Table S3); no additional targets were seen, consistent with the hypothesis that they label more restricted subtypes of alpha RGCs.
We also performed unsupervised hierarchical clustering of projection patterns, independent of the knowledge gained from the retinal data, so that we could compare results from the different data types (i.e. morphological and gene expression in the retina with projection patterns). Clustering of both the experiments and target regions used average linkages and distances calculated by three methods: Euclidean distance (Figure 4), Spearman rank and Pearson correlations. Cluster membership was highly consistent among these three methods (Figure S4). Three major groups of retinorecipient regions and four major clusters of Cre lines were identified. Images of labeled axons in 5 locations for one representative line per cluster is shown in Figure 5. Retinal target groups are distinguished both by anatomical location and by projection strengths. The first group (Figure 4, rows) contained targets with the strongest projections. These were major retinorecipient regions such as the dorsal and ventral lateral geniculate nucleus (LGd, LGv), both contra- and ipsi-lateral to the injected eye, and contralateral superior colliculus (SC), as well as midbrain pretectal nuclei (e.g. NOT, APN, OP, PPT). The second group of target regions were innervated with more moderate strengths and included contralateral accessory optic nuclei (MT, MG), ventral thalamic targets (IGL, PP, ZI, SubG) and ipsilateral midbrain nuclei (SC, NOT, APN, OP, PPT). The third group of target regions, containing the weakest projections, was dominated by hypothalamic nuclei both ipsi- and contra-lateral to the injected eye. One exception in this group is the relatively strong signal detected in the MEA-R; its proximity to the optic tract may have resulted in some fraction of the strong signal in the optic tract being mis-assigned to MEA (see Figure 3o).
Figure 5. Projections from Cre-expressing RGCs to five major retinorecipient brain areas.

Section images are shown at the level of the hypothalamus, accessory optic nucleus, thalamus, pretectal region and superior colliculus from four Cre driver lines (a–d), one from each of the four projection clusters defined in Figure 4. A coronal view of the maximum intensity projection (MIP) of brain-wide fluorescent signal for each experiment is shown in the first column; contralateral to injected eye is on the top and ipsilateral on the bottom. All experiments in all clusters showed greater contralateral vs ipsilateral projections, but differ in the specific targets contacted by labeled axons
The four clusters of injection experiments also reflected patterns in both target location and projection strength. Clustering was done using individual experiments rather than average values from each line so that variability could be easily visualized. However, projection strengths across regions derived from replicate experiments were highly consistent (mean Pearson r=0.90, range 0.75 to 0.97) and in line with previous results comparing projection strengths from duplicate injections (mean Pearson r=0.90, Oh et al., 2014). Replicates within a Cre line were more similar to each other than to animals from other lines (mean Pearson r=0.80, range 0.49 to 0.86). Moreover, for 24 of the 26 lines all replicate experiments from each line fell into a single cluster, and, for the remaining 2 lines, 2 of the 3 replicates fell into a single cluster. Principal features of these clusters are as follows:
In Cluster 1, labeled retinal axons were present in the majority of retinorecipient regions (e.g. Figure 5a). Unsurprisingly, most of the lines in this cluster labeled large numbers of RGC types as measured by type-specific markers and multi-laminar projections in the IPL (Figure 2). Thus, all five lines in retinal Group 1 as assessed by staining were members of this cluster. Consistent with this correspondence, the average volume of segmented pixels in the optic chiasm (e.g. labeled axons) was significantly higher in Cluster 1 compared to the other three clusters (p<0.0001 by one-way ANOVA and Tukey post-hoc test). Kcng4-Cre, in which alpha RGCs are selectively labeled, was unexpectedly assigned to this cluster. However, 2 of the 3 replicates fell into a distinct sub-cluster, and all 3 were assigned to the Cluster 2 equivalent when using one of the two alternative clustering methods (Figure S4).
Lines in Cluster 2 also projected widely to most targets, but avoided retinorecipient regions of Group 3, which consist mostly of hypothalamic areas (e.g. Figure 5b). This suggests that in these lines, specific RGC types are excluded, such as the intrinsically photosensitive cells (ipRGCs) that innervate the SCH (Hattar et al., 2002 2006; Ecker et al., 2010). Lines that label ooDSGCs and OFF-DSGCs fall into this group (Cart-Tg1-Cre, Cdh6-CreER, Jam2-CreER). Three other lines in this group (Calb2-IRES-Cre, Scnn1-Tg3-Cre, and Pvalb-IRES-Cre) also label ooDSGCs, among other types.
Specific central targets contacted were more exclusive for lines in Cluster 3. Axons were absent not only from hypothalamus, but also from the second group of targets - ipsilateral midbrain, ventral thalamic regions, and accessory optic nuclei (e.g. Figure 5c). Cluster 3 axons project predominantly to the major image-forming retinal target regions. None project to the accessory optic nucleus, MT, except for one of three Cdh4-CreER replicates. Several of these lines had no detectable projections to the thalamic area LP (Crh-IRES-Cre (BL), Gal-Cre_KI87, Satb2-Cre_MO23, and Neto1-Cre).
Finally, the most exclusive projection patterns were observed in Cluster 4, which contains Grik4-Cre and Pcdh9-Cre_NP276 (e.g. Figure 5d). These lines selectively label RGCs with dendritic morphology and RGC marker labeling suggesting that they are predominantly ON-DSGCs. These lines both have strong and relatively restricted projections to area MT, which is known to be a major projection site for ON-DSGCs (Buhl and Peichl, 1986; Yonehara et al., 2009; Gauvain and Murphy, 2015), further validating the assignment of RGC type in these lines.
Lamina-selective projections to the superior colliculus and dorsal lateral geniculate nucleus
The vast majority of Cre lines we screened projected to the two major retinorecipient areas, SC and LGd. Previous studies have found that some RGC types project to specific layers within these two structures. For example alpha RGCs project to deep layers in the SC and a core region in the LGd, whereas ooDSGCs and J-RGCs project to the superficial layers of the SC and LGd (Sachs and Schneider, 1984; Reese, 1988; Huberman et al., 2008; Kim et al., 2010; Hong et al., 2011; Kay et al., 2011; Cruz-Martin et al., 2014). The retina-to-brain connectivity map (Figure 4) does not contain information on connection strength within these subregions because they are not all annotated in the Allen Mouse CCF. To ask whether projections from Cre driver lines displayed subregion-specific targeting patterns, we drew new regional boundaries within the LGd, subdividing it into ipsilateral, core, and shell regions (Figure 6a; see also supplemental material). We used three subdivisions of the sensory region of the SC (SCs): optic layer, SCop, superficial gray layer, SCsg, and zonal layer, SCzo (Figure 6a). We qualitatively analyzed and classified the projection patterns to these subdivisions. Within the LGd, we observed 3 major patterns (Figure 6b,c): (1) equal density of projections across shell and core (pan); (2) shell-preferring lines; and (3) core-preferring lines. Not all Cre lines within a group are equal; for example, some Cre lines in the LGd shell group had much stronger preferences for shell than other members. Within the SCs, 5 patterns were identified (Figure 6b,d): (1) equal density of projections across all layers (pan); (2) superficial layer-preferring (SCsg+SCzo); (3) mid-superficial layer-preferring (SCsg); (4) deep layer-preferring (SCop+SCsg); and (5) deep and superficial (SCop+SCzo).
Figure 6. Correspondence between projection patterns within LGd and SCs from Cre expressing RGCs.

(a) Subdivisions of the LGd and SCs. Contralateral projections from Kcng4 Cre (salmon) and Cart-Tg1-Cre (light pink) RGCs are shown in three coronal views on the rostral-caudal axis, along with ipsilateral projections mapped from a mouse injected with CTB in the opposite eye (cyan). These datasets were used to delineate the borders between each subdivision in the LGd. (b) Summary of the LGd and SCs projection patterns observed for all Cre lines. (c,d) Example images near the rostral-caudal midpoint through LGd (c) and SCs (d) from lines that differed in their laminar distribution of labeled terminals. Dashed lines in (c) show the border between shell and core regions. zo, zonal layer; sg, superficial gray layer; op, optic layer; ip, ipsilateral zone of LGd.
A striking relationship between LGd and SCs projection patterns emerged from this analysis (Figure 6b). First, most lines that projected preferentially to LGd core also projected selectively to the deeper layers of SCs. Three lines in which alpha RGCs were selectively labeled (Kcng4-Cre, Etv1-CreERT2 and Gal-Cre_KI87) all fell into this group. The one exception was the Crh-IRES-Cre line which had very sparse labeling that made reliable assignment to core or shell in the LGd difficult, but was more suggestive of shell. Second, lines that projected preferentially to LGd shell also projected selectively to the superficial gray layer of the SCs (SCsg and, in some cases, SCzo). Lines in which ooDSGCs were selectively labeled (Cdh6-CreER, Cart-Tg1-Cre, and Gpr26-Cre_KO250) fell into this group. This group also included 3 lines in which OFF-DSGCs are labeled (Jam2-CreER, Cdh4-CreER and Foxp2-Cre) (Kim et al., 2008; Rousso et al., 2016). Lines with terminals in all layers of LGd also projected to all layers of SCs. Unsurprisingly, this pan group included all Cre lines in which most or all RGC types were labeled. The two lines in which ON-DSGCs were selectively labeled (Pcdh9-Cre_NP276 and Grik4-Cre) projected either very weakly or to neither LGd nor SCs. A few exceptions to this correspondence were noted; e.g. Satb2-Cre_MO23 labeled projections to the LGd core, but had terminals in both deep and very superficial (zonal) regions in SC.
Discussion
The main aims of this study were to characterize RGC subsets labeled in a large set of Cre driver lines, and to map their projections to retinorecipient areas in the brain. To identify lines for detailed analysis, we first screened 88 driver lines using intravitreal injection of a Cre-dependent viral reporter. Because the serotype we used for this survey, rAAV1, is capable of infecting all major retinal cell classes, our results will enable researchers to select Cre driver lines with expression in particular classes, including photoreceptors, amacrine cells, bipolar cells, horizontal cells and Müller glia, as well as RGCs. Our results are broadly consistent with those of a prior survey of GFP reporter lines (Siegert et al., 2009), and smaller scale screens of Cre driver lines (e.g. Ivanova et al., 2010). We then mapped and quantified all central projections of RGCs labeled in 26 of the lines, taking advantage of our Allen Mouse Brain Connectivity Atlas high-throughput imaging and data processing pipeline.
Genetic access to RGCs
The large numbers of Cre driver lines generated over the past several years provide an invaluable resource enabling genetic access to cells. In most cases, labeled neurons included types outside of the interests or purpose of the creators of the lines, and so were not initially described. Therefore, systematic analysis of these lines by investigators with other interests greatly expands their utility. Previously, we characterized whole brain transgenic Cre expression patterns from a collection of >100 Cre driver lines, but did not include retina (Harris et al., 2014). Here, we screened for RGC expression in many of these lines, as well as additional lines, using Cre-dependent viral and/or transgenic reporters.
We hoped to find lines in which labeling was largely restricted to a single RGC type, but only a few (e.g., Pcdh9-Cre_NP276) fulfilled this criterion. In most cases, Cre was expressed in multiple RGC types. This pattern is disappointing but not surprising. In fact, despite intensive effort, few lines have been found in which a reporter is specifically expressed in a single RGC type (Huberman et al., 2008; Kim et al., 2008; Huberman et al., 2009; Trenholm et al., 2011). In other cases, the reporter marks a small number of types, which are often related to each other (Siegert et al., 2009; Kim et al., 2010; Kay et al., 2011; Dhande et al., 2013; Farrow et al., 2013; Duan et al., 2015; Rousso et al., 2016). Indeed, within the retina, and even within just RGCs, single genes are seldom reliable markers of a single cell type (reviewed in Sanes and Masland, 2015). Most likely, combinations of genes will be required to target additional specific cell types. Identifying those combinations of genes is critical for next generation development of appropriate intersectional genetic tools. In keeping with this trajectory, although the majority of the Cre lines that we characterized here did not show specific labeling of a single RGC type, several had strong enrichment for or, alternatively, excluded specific cell populations (Figure 2). This set of Cre lines may thus help to provide one of the necessary genes required to access a specific cell type using intersectional strategies that incorporate other recombinase driver lines (e.g. Flp recombinase, Madisen et al., 2015); these future tools will then enable the mapping of a more precise cell type-specific wiring diagram from the retina to the brain.
Mouse retinal projectome
To derive a comprehensive, quantitative, connectivity map of all central projections from the retina, we used the high-throughput whole brain mapping approach previously described for the mouse brain (Oh et al., 2014). This platform enables automated segmentation of fluorescent signal and registration of each brain to our fully annotated 3-D Allen Mouse CCF reference space. Using data from mice in which most or all RGCs were labeled, we identified all regions within the Allen Mouse CCF that contain terminals of labeled retinal axons. We confirmed the vast majority of retinal target areas identified in a recent analysis using CTB (Morin and Studholme, 2014). Counting contra- and ipsi-lateral projections separately, as well as the laminar subdivisions of the LGd and SCs, we annotated ~60 central targets in this study. The method we use here for mapping the retinal projectome relies on population labeling of Cre-defined RGCs, and can easily be extended as additional lines are generated. An alternative is to use sparse labeling of single RGCs, as we have done to a limited extent in mice (Hong et al., 2011) and others have done in zebrafish (Robles et al., 2014).
The quantification of projection strength between Cre-defined RGCs and retinorecipient brain regions does present several challenges and caveats; (1) The retina is large compared to the central source areas injected in our previous connectivity map (Oh et al., 2014) and, despite precautions, it is unlikely that we labeled all Cre+ cells across its full extent. There are substantial variations in density of specific RGC types across the retina (Bleckert et al., 2014; Rousso et al., 2016) and although we excluded retinas in which labeling was confined to a narrow region (whole mount images for each experiment can be viewed online), differences in injection position and extent of infection likely contributed to variability observed among animals. (2) The rAAV tracer used here produces expression of EGFP throughout the axon and the automated signal detection does not differentiate between fibers of passage and presynaptic terminals. Thus, we manually verified every target by visual expert inspection to generate an accurate matrix of all true positive (and true negative) targets. Quantified projection strengths are only shown in Figure 4 for regions with verified positive signals.
Correspondence between Cre lines, RGC type, and central projection patterns
The correspondence between RGC types labeled in a particular Cre line and projection pattern was striking for two of the four clusters in Figure 4. Cluster 1 contains primarily lines in which most or all RGC types were labeled, and retinal axons were found in the vast majority of all possible retinorecipient targets. Cluster 4 comprised two lines with arguably the highest specificity (Pcdh9-Cre_NP276 and Grik4-Cre) in which accessory optic nucleus projecting-ON-DSGCs were selectively labeled. Previous work in the Grik4-Cre line suggested that Cre+ cells were predominantly bistratified ooDSGCs (Ivanova et al., 2010), although we found that labeled cells are mostly, but not exclusively, of the monostratified type. The Pcdh9-Cre_NP276 line was even more specific to monostratifed RGCs than Grik4-Cre, and the central projection patterns reflect this increased specificity. Pcdh9-Cre_NP276 experiments showed very little (and less reliable) labeling outside of areas MT and MG (which contains DT in our atlas, as mentioned previously).
The correspondence between central projections and RGC types described for these Cre lines is imperfect however. For example, Kcng4-Cre, Crh-IRES-Cre (BL), Gal-Cre_KI87 and Etv1-CreERT2 all predominantly label alpha RGCs. However, experiments from these four lines are distributed among Clusters 1–3, with Kcng4-Cre labeled cells (Cluster 1) projecting to a larger set of retinorecipient regions than Etv1-CreERT2 (Cluster 2), and Crh-IRES-Cre and Gal-Cre_KI87 lines (Cluster 3) projecting to an even more limited number of targets (Table S3). There are clear similarities, too; they all have in common a lack of terminals in accessory optic nuclei (e.g. MT), and show projections targeting the core of LGd and deeper layers of the SCs, consistent with previous data on alpha cells (reviewed in Dhande et al., 2015). Further characterization of these four Cre lines may reveal that they each label different, or more restricted, populations of alpha cells, which might then better explain distinct projection patterns. The three Cre lines (Cart-Tg1-Cre, Cdh6-CreER, and Gpr26-Cre_KO250) enriched for ooDSGC also showed many similarities but some differences. In fact, differences among projections of ooDSGC subtypes have been documented previously (Kay et al., 2011; Rivlin-Etzion et al., 2011).
Our results also confirm previous reports on differences in specific termination patterns within the LGd and SCs for alpha RGCs vs ooDSGCs. The correspondence between the LGd and SCs patterns we describe across all lines, together with previous data showing these differences can be explained by RGC type, provides us with an additional tool for determining whether a Cre line is enriched for alpha or DSGCs. Our results support the idea that both the LGd and SC contain multiple functionally segregated maps from the retina (e.g. see for review Dhande et al., 2015), with direction-selective information routed to the shell of the LGd and superficial layers of SCs and center-surround information flowing to the LGd core and deeper SCs layers.
Clusters 2 and 3 contain Cre lines with progressively exclusive projection targeting. Given current characterization data we were not able to resolve the contributions of specific cell types to these projection patterns, but the exclusion of specific targets is also telling as to what cell types are NOT present. For example, ipRGCs contribute the vast majority of all retinal input to several central targets, including the SCH, the lateral habenular region (captured in area CL in the Allen Mouse CCF), and the intergeniculate leaflet (IGL) (Hattar et al., 2006). Given this pattern, it appears that ipRGCs were not labeled by the majority of Cre lines surveyed here. Outside of the Cluster 1 lines, which labeled all or most of the RGC types, we identified only a few lines in which retinal axons were consistently labeled in the SCH; including Slc18a2-Cre_OZ14 and Satb2-Cre_MO23 (Cluster 3).
In summary, we screened for retinal expression in a large set of Cre driver mice, identifying several lines with Cre expression restricted to subsets of RGCs. We systematically mapped retinal input brain-wide with high resolution and sensitivity, and generated a quantitative connectivity map of projections from Cre-defined RGCs. This dataset is available as an online resource through the Allen Mouse Brain Connectivity Atlas portal (http://connectivity.brain-map.org/), which allows other researchers to access and interact with the data, enabling design of future experiments aimed to genetically dissect apart circuits supplying visual information to the brain.
Experimental Procedures
Transgenic mice
Experiments involving mice were approved by the Institutional Animal Care and Use Committees of the Allen Institute for Brain Science and Harvard University in accordance with NIH guidelines. Sources of Cre driver lines are listed in Table S1, including the GENSAT project (Gong et al., 2007). Tracer injections were done in male and female mice at an average age of P56+/− 7 days. For tamoxifen-inducible Cre lines (CreER), mice were treated with 200 μl of tamoxifen solution (0.2 mg/g body weight) via oral gavage once per day for 5 consecutive days starting the week following virus injection.
Tracer injections and Histology
rAAV2.pCAG.FLEX.EGFP.WPRE.bGH viruses were prepared by and purchased from the Penn Vector Core (Addgene plasmid #51502). Serotype 1 (rAAV1; 2.97E+13 gc/ml) was used during the initial Cre driver survey. Serotype 2 (rAAV2; 6.12E+12 gc/ml) was used for whole brain projection mapping. Cholera toxin subunit B (CTB-488 or −555, 1–2 μl of 1 mg/ml, Invitrogen) was used for nonselective anterograde tracing of RGC axons in a subset of experiments. Intravitreal injections were made in adult mice (see Supplemental materials for details). Brains and retinas were harvested three weeks post-injection for Cre mice, or post-tamoxifen induction, for CreER mice.
Retinas were screened for native EGFP fluorescence under a fluorescent dissecting. Brains were selected for imaging after confirming that the extent of RGC labeling was broad across the nasal-temporal and dorsal-ventral axes of the retina, to reduce effects of retinal location on projection target specificity. 2–3 brains corresponding to retinas with the most robust EGFP expression were imaged by serial two-photon tomography, and the retinas prepared as flattened whole mounts for imaging. The remaining retinas were processed for vertical sectioning and cell type-specific marker analyses. Detailed methods for staining and imaging retinas are described in Supplemental materials.
Imaging
Confocal images for quantification of co-labeled cells were collected on either an Olympus FV1000MPE or Zeiss LSM-710 at 20X or at 40X. Retinal whole mounts (4X) and section (20X) images were collected via semi-automated protocols by multichannel fluorescence microscopy (Olympus VS series; Olympus) to acquire full-color images for archival data online. Using our previously published methods, brains were imaged by serial two-photon tomography, and the resulting images were processed using the informatics data pipeline (IDP) set up for the Allen Mouse Brain Connectivity Atlas (Oh et al., 2014; Kuan et al., 2015); additional details provided in Supplemental materials.
Supplementary Material
Acknowledgments
We thank S. Caldejon, C. Cuhaciyan, and A. Ho for operation of TissueCyte imaging systems and generation of retinal images that appear on the Allen Institute website. We thank W. Wakeman for ensuring data moved appropriately through the informatics data processing pipeline. We also thank the In Vivo Sciences team for mouse husbandry and tissue preparation at the Allen Institute facilities, in particular Dr. V. Maldonado and J. Huffman. Pilot rAAV2 was generated by C. Wang in the Boston Children’s Hospital Viral Core, supported by NIH grant P30EY012196. This work was supported in part by NIH grants EY022073 and NS029169 to J.R.S. We thank the Allen Institute for Brain Science founders, Paul G. Allen and Jody Allen, for their vision, encouragement, and support.
Footnotes
Author Contributions
Conceptualization, M.E., X.D., H.Z., J.R.S., and J.A.H; Project Administration, S.W.O; Investigation, E.M., K.E.H., M.E., A.B., X.D., B.O., J.J.R., M.S., and Q.W., Formal Analysis, J.A.H.; Software, Y.L. and L.N.; Visualization, E.M., K.E.H., M.E., and J.A.H.; Writing – Original Draft, J.R.S., and J.A.H.; Writing – Review & Editing, E.M., K.E.H., H.Z., J.R.S., and J.A.H.
Publisher's Disclaimer: This is a PDF file of an unedited manuscript that has been accepted for publication. As a service to our customers we are providing this early version of the manuscript. The manuscript will undergo copyediting, typesetting, and review of the resulting proof before it is published in its final citable form. Please note that during the production process errors may be discovered which could affect the content, and all legal disclaimers that apply to the journal pertain.
References
- Badea TC, Cahill H, Ecker J, Hattar S, Nathans J. Distinct roles of transcription factors brn3a and brn3b in controlling the development, morphology, and function of retinal ganglion cells. Neuron. 2009;61:852–864. doi: 10.1016/j.neuron.2009.01.020. [DOI] [PMC free article] [PubMed] [Google Scholar]
- Baden T, Berens P, Franke K, Roman Roson M, Bethge M, Euler T. The functional diversity of retinal ganglion cells in the mouse. Nature. 2016;529:345–350. doi: 10.1038/nature16468. [DOI] [PMC free article] [PubMed] [Google Scholar]
- Barnstable CJ, Drager UC. Thy-1 antigen: a ganglion cell specific marker in rodent retina. Neuroscience. 1984;11:847–855. doi: 10.1016/0306-4522(84)90195-7. [DOI] [PubMed] [Google Scholar]
- Berson DM. Retinal Ganglion Cell Types and Their Central Projections. In: Basbaum AI, editor. The Senses: A Comprehensive Reference. Amsterdam, Boston: Elsevier; 2008. pp. 491–519. [Google Scholar]
- Bleckert A, Schwartz GW, Turner MH, Rieke F, Wong RO. Visual space is represented by nonmatching topographies of distinct mouse retinal ganglion cell types. Curr Biol. 2014;24:310–315. doi: 10.1016/j.cub.2013.12.020. [DOI] [PMC free article] [PubMed] [Google Scholar]
- Buffelli M, Burgess RW, Feng G, Lobe CG, Lichtman JW, Sanes JR. Genetic evidence that relative synaptic efficacy biases the outcome of synaptic competition. Nature. 2003;424:430–434. doi: 10.1038/nature01844. [DOI] [PubMed] [Google Scholar]
- Buhl EH, Peichl L. Morphology of rabbit retinal ganglion cells projecting to the medial terminal nucleus of the accessory optic system. J Comp Neurol. 1986;253:163–174. doi: 10.1002/cne.902530204. [DOI] [PubMed] [Google Scholar]
- Cruz-Martin A, El-Danaf RN, Osakada F, Sriram B, Dhande OS, Nguyen PL, Callaway EM, Ghosh A, Huberman AD. A dedicated circuit links direction-selective retinal ganglion cells to the primary visual cortex. Nature. 2014;507:358–361. doi: 10.1038/nature12989. [DOI] [PMC free article] [PubMed] [Google Scholar]
- Dhande OS, Estevez ME, Quattrochi LE, El-Danaf RN, Nguyen PL, Berson DM, Huberman AD. Genetic dissection of retinal inputs to brainstem nuclei controlling image stabilization. J Neurosci. 2013;33:17797–17813. doi: 10.1523/JNEUROSCI.2778-13.2013. [DOI] [PMC free article] [PubMed] [Google Scholar]
- Dhande OS, Stafford BK, Lim JA, Huberman AD. Contributions of Retinal Ganglion Cells to Subcortical Visual Processing and Behaviors. Annual Review of Vision Science. 2015;1:291–328. doi: 10.1146/annurev-vision-082114-035502. [DOI] [PubMed] [Google Scholar]
- Duan X, Qiao M, Bei F, Kim IJ, He Z, Sanes JR. Subtype-specific regeneration of retinal ganglion cells following axotomy: effects of osteopontin and mTOR signaling. Neuron. 2015;85:1244–1256. doi: 10.1016/j.neuron.2015.02.017. [DOI] [PMC free article] [PubMed] [Google Scholar]
- Ecker JL, Dumitrescu ON, Wong KY, Alam NM, Chen SK, Legates T, Renna JM, Prusky GT, Berson DM, Hattar S. Melanopsin-expressing retinal ganglion-cell photoreceptors: cellular diversity and role in pattern vision. Neuron. 2010;67:49–60. doi: 10.1016/j.neuron.2010.05.023. [DOI] [PMC free article] [PubMed] [Google Scholar]
- Farrow K, Teixeira M, Szikra T, Viney TJ, Balint K, Yonehara K, Roska B. Ambient illumination toggles a neuronal circuit switch in the retina and visual perception at cone threshold. Neuron. 2013;78:325–338. doi: 10.1016/j.neuron.2013.02.014. [DOI] [PubMed] [Google Scholar]
- Fleming MD, Benca RM, Behan M. Retinal projections to the subcortical visual system in congenic albino and pigmented rats. Neuroscience. 2006;143:895–904. doi: 10.1016/j.neuroscience.2006.08.016. [DOI] [PMC free article] [PubMed] [Google Scholar]
- Gaillard F, Karten HJ, Sauve Y. Retinorecipient areas in the diurnal murine rodent Arvicanthis niloticus: a disproportionally large superior colliculus. J Comp Neurol. 2013;521:1699–1726. doi: 10.1002/cne.23303. [DOI] [PubMed] [Google Scholar]
- Gauvain G, Murphy GJ. Projection-specific characteristics of retinal input to the brain. J Neurosci. 2015;35:6575–6583. doi: 10.1523/JNEUROSCI.4298-14.2015. [DOI] [PMC free article] [PubMed] [Google Scholar]
- Gollisch T, Meister M. Eye smarter than scientists believed: neural computations in circuits of the retina. Neuron. 2010;65:150–164. doi: 10.1016/j.neuron.2009.12.009. [DOI] [PMC free article] [PubMed] [Google Scholar]
- Gong S, Doughty M, Harbaugh CR, Cummins A, Hatten ME, Heintz N, Gerfen CR. Targeting Cre recombinase to specific neuron populations with bacterial artificial chromosome constructs. J Neurosci. 2007;27:9817–9823. doi: 10.1523/JNEUROSCI.2707-07.2007. [DOI] [PMC free article] [PubMed] [Google Scholar]
- Grimes WN, Zhang J, Graydon CW, Kachar B, Diamond JS. Retinal parallel processors: more than 100 independent microcircuits operate within a single interneuron. Neuron. 2010;65:873–885. doi: 10.1016/j.neuron.2010.02.028. [DOI] [PMC free article] [PubMed] [Google Scholar]
- Harris JA, Hirokawa KE, Sorensen SA, Gu H, Mills M, Ng LL, Bohn P, Mortrud M, Ouellette B, Kidney J, Smith KA, Dang C, Sunkin S, Bernard A, Oh SW, Madisen L, Zeng H. Anatomical characterization of Cre driver mice for neural circuit mapping and manipulation. Front Neural Circuits. 2014;8:76. doi: 10.3389/fncir.2014.00076. [DOI] [PMC free article] [PubMed] [Google Scholar]
- Hattar S, Kumar M, Park A, Tong P, Tung J, Yau KW, Berson DM. Central projections of melanopsin-expressing retinal ganglion cells in the mouse. J Comp Neurol. 2006;497:326–349. doi: 10.1002/cne.20970. [DOI] [PMC free article] [PubMed] [Google Scholar]
- Hattar S, Liao HW, Takao M, Berson DM, Yau KW. Melanopsin-containing retinal ganglion cells: architecture, projections, and intrinsic photosensitivity. Science. 2002;295:1065–1070. doi: 10.1126/science.1069609. [DOI] [PMC free article] [PubMed] [Google Scholar]
- Hong YK, Kim IJ, Sanes JR. Stereotyped axonal arbors of retinal ganglion cell subsets in the mouse superior colliculus. J Comp Neurol. 2011;519:1691–1711. doi: 10.1002/cne.22595. [DOI] [PMC free article] [PubMed] [Google Scholar]
- Huang ZJ, Zeng H. Genetic approaches to neural circuits in the mouse. Annu Rev Neurosci. 2013;36:183–215. doi: 10.1146/annurev-neuro-062012-170307. [DOI] [PubMed] [Google Scholar]
- Huberman AD, Manu M, Koch SM, Susman MW, Lutz AB, Ullian EM, Baccus SA, Barres BA. Architecture and activity-mediated refinement of axonal projections from a mosaic of genetically identified retinal ganglion cells. Neuron. 2008;59:425–438. doi: 10.1016/j.neuron.2008.07.018. [DOI] [PMC free article] [PubMed] [Google Scholar]
- Huberman AD, Wei W, Elstrott J, Stafford BK, Feller MB, Barres BA. Genetic identification of an On-Off direction-selective retinal ganglion cell subtype reveals a layer-specific subcortical map of posterior motion. Neuron. 2009;62:327–334. doi: 10.1016/j.neuron.2009.04.014. [DOI] [PMC free article] [PubMed] [Google Scholar]
- Ivanova E, Hwang GS, Pan ZH. Characterization of transgenic mouse lines expressing Cre recombinase in the retina. Neuroscience. 2010;165:233–243. doi: 10.1016/j.neuroscience.2009.10.021. [DOI] [PMC free article] [PubMed] [Google Scholar]
- Jeon CJ, Strettoi E, Masland RH. The major cell populations of the mouse retina. J Neurosci. 1998;18:8936–8946. doi: 10.1523/JNEUROSCI.18-21-08936.1998. [DOI] [PMC free article] [PubMed] [Google Scholar]
- Kay JN, De La Huerta I, Kim IJ, Zhang Y, Yamagata M, Chu MW, Meister M, Sanes JR. Retinal ganglion cells with distinct directional preferences differ in molecular identity, structure, and central projections. J Neurosci. 2011;31:7753–7762. doi: 10.1523/JNEUROSCI.0907-11.2011. [DOI] [PMC free article] [PubMed] [Google Scholar]
- Kim IJ, Zhang Y, Meister M, Sanes JR. Laminar restriction of retinal ganglion cell dendrites and axons: subtype-specific developmental patterns revealed with transgenic markers. J Neurosci. 2010;30:1452–1462. doi: 10.1523/JNEUROSCI.4779-09.2010. [DOI] [PMC free article] [PubMed] [Google Scholar]
- Kim IJ, Zhang Y, Yamagata M, Meister M, Sanes JR. Molecular identification of a retinal cell type that responds to upward motion. Nature. 2008;452:478–482. doi: 10.1038/nature06739. [DOI] [PubMed] [Google Scholar]
- Kuan L, Li Y, Lau C, Feng D, Bernard A, Sunkin SM, Zeng H, Dang C, Hawrylycz M, Ng L. Neuroinformatics of the Allen Mouse Brain Connectivity Atlas. Methods. 2015;73:4–17. doi: 10.1016/j.ymeth.2014.12.013. [DOI] [PubMed] [Google Scholar]
- Madisen L, Garner AR, Shimaoka D, Chuong AS, Klapoetke NC, Li L, Van Der Bourg A, Niino Y, Egolf L, Monetti C, Gu H, Mills M, Cheng A, Tasic B, Nguyen TN, Sunkin SM, Benucci A, Nagy A, Miyawaki A, Helmchen F, Empson RM, Knopfel T, Boyden ES, Reid RC, Carandini M, Zeng H. Transgenic mice for intersectional targeting of neural sensors and effectors with high specificity and performance. Neuron. 2015;85:942–958. doi: 10.1016/j.neuron.2015.02.022. [DOI] [PMC free article] [PubMed] [Google Scholar]
- Madisen L, Zwingman TA, Sunkin SM, Oh SW, Zariwala HA, Gu H, Ng LL, Palmiter RD, Hawrylycz MJ, Jones AR, Lein ES, Zeng H. A robust and high-throughput Cre reporting and characterization system for the whole mouse brain. Nat Neurosci. 2010;13:133–140. doi: 10.1038/nn.2467. [DOI] [PMC free article] [PubMed] [Google Scholar]
- Masland RH. The neuronal organization of the retina. Neuron. 2012;76:266–280. doi: 10.1016/j.neuron.2012.10.002. [DOI] [PMC free article] [PubMed] [Google Scholar]
- Morin LP, Studholme KM. Retinofugal projections in the mouse. J Comp Neurol. 2014;522:3733–3753. doi: 10.1002/cne.23635. [DOI] [PMC free article] [PubMed] [Google Scholar]
- Oh SW, Harris JA, Ng L, Winslow B, Cain N, Mihalas S, Wang Q, Lau C, Kuan L, Henry AM, Mortrud MT, Ouellette B, Nguyen TN, Sorensen SA, Slaughterbeck CR, Wakeman W, Li Y, Feng D, Ho A, Nicholas E, Hirokawa KE, Bohn P, Joines KM, Peng H, Hawrylycz MJ, Phillips JW, Hohmann JG, Wohnoutka P, Gerfen CR, Koch C, Bernard A, Dang C, Jones AR, Zeng H. A mesoscale connectome of the mouse brain. Nature. 2014;508:207–214. doi: 10.1038/nature13186. [DOI] [PMC free article] [PubMed] [Google Scholar]
- Osterhout JA, Josten N, Yamada J, Pan F, Wu SW, Nguyen PL, Panagiotakos G, Inoue YU, Egusa SF, Volgyi B, Inoue T, Bloomfield SA, Barres BA, Berson DM, Feldheim DA, Huberman AD. Cadherin-6 mediates axon-target matching in a non-image-forming visual circuit. Neuron. 2011;71:632–639. doi: 10.1016/j.neuron.2011.07.006. [DOI] [PMC free article] [PubMed] [Google Scholar]
- Pang JJ, Wu SM. Morphology and immunoreactivity of retrogradely double-labeled ganglion cells in the mouse retina. Invest Ophthalmol Vis Sci. 2011;52:4886–4896. doi: 10.1167/iovs.10-5921. [DOI] [PMC free article] [PubMed] [Google Scholar]
- Reese BE. ‘Hidden lamination’ in the dorsal lateral geniculate nucleus: the functional organization of this thalamic region in the rat. Brain Res. 1988;472:119–137. doi: 10.1016/0165-0173(88)90017-3. [DOI] [PubMed] [Google Scholar]
- Rivlin-Etzion M, Zhou K, Wei W, Elstrott J, Nguyen PL, Barres BA, Huberman AD, Feller MB. Transgenic mice reveal unexpected diversity of on-off direction-selective retinal ganglion cell subtypes and brain structures involved in motion processing. J Neurosci. 2011;31:8760–8769. doi: 10.1523/JNEUROSCI.0564-11.2011. [DOI] [PMC free article] [PubMed] [Google Scholar]
- Robles E, Laurell E, Baier H. The retinal projectome reveals brain-area-specific visual representations generated by ganglion cell diversity. Curr Biol. 2014;24:2085–2096. doi: 10.1016/j.cub.2014.07.080. [DOI] [PubMed] [Google Scholar]
- Rodriguez AR, De Sevilla Muller LP, Brecha NC. The RNA binding protein RBPMS is a selective marker of ganglion cells in the mammalian retina. J Comp Neurol. 2014;522:1411–1443. doi: 10.1002/cne.23521. [DOI] [PMC free article] [PubMed] [Google Scholar]
- Rousso DL, Qiao M, Kagan RD, Yamagata M, Palmiter RD, Sanes JR. Two pairs of ON and OFF retinal ganglion cells are defined by intersectional patterns of transcription factor expression. Cell Reports. 2016 doi: 10.1016/j.celrep.2016.04.069. in press. [DOI] [PMC free article] [PubMed] [Google Scholar]
- Sachs GM, Schneider GE. The morphology of optic tract axons arborizing in the superior colliculus of the hamster. J Comp Neurol. 1984;230:155–167. doi: 10.1002/cne.902300202. [DOI] [PubMed] [Google Scholar]
- Sanes JR, Masland RH. The types of retinal ganglion cells: current status and implications for neuronal classification. Annu Rev Neurosci. 2015;38:221–246. doi: 10.1146/annurev-neuro-071714-034120. [DOI] [PubMed] [Google Scholar]
- Schmidt TM, Do MT, Dacey D, Lucas R, Hattar S, Matynia A. Melanopsin-positive intrinsically photosensitive retinal ganglion cells: from form to function. J Neurosci. 2011;31:16094–16101. doi: 10.1523/JNEUROSCI.4132-11.2011. [DOI] [PMC free article] [PubMed] [Google Scholar]
- Siegert S, Scherf BG, Del Punta K, Didkovsky N, Heintz N, Roska B. Genetic address book for retinal cell types. Nat Neurosci. 2009;12:1197–1204. doi: 10.1038/nn.2370. [DOI] [PubMed] [Google Scholar]
- Stella SL, Jr, Li S, Sabatini A, Vila A, Brecha NC. Comparison of the ontogeny of the vesicular glutamate transporter 3 (VGLUT3) with VGLUT1 and VGLUT2 in the rat retina. Brain Res. 2008;1215:20–29. doi: 10.1016/j.brainres.2008.03.038. [DOI] [PMC free article] [PubMed] [Google Scholar]
- Sun W, Deng Q, Levick WR, He S. ON direction-selective ganglion cells in the mouse retina. J Physiol. 2006;576:197–202. doi: 10.1113/jphysiol.2006.115857. [DOI] [PMC free article] [PubMed] [Google Scholar]
- Trenholm S, Johnson K, Li X, Smith RG, Awatramani GB. Parallel mechanisms encode direction in the retina. Neuron. 2011;71:683–694. doi: 10.1016/j.neuron.2011.06.020. [DOI] [PMC free article] [PubMed] [Google Scholar]
- Xiang M, Zhou L, Macke JP, Yoshioka T, Hendry SH, Eddy RL, Shows TB, Nathans J. The Brn-3 family of POU-domain factors: primary structure, binding specificity, and expression in subsets of retinal ganglion cells and somatosensory neurons. J Neurosci. 1995;15:4762–4785. doi: 10.1523/JNEUROSCI.15-07-04762.1995. [DOI] [PMC free article] [PubMed] [Google Scholar]
- Yi CW, Yu SH, Lee ES, Lee JG, Jeon CJ. Types of parvalbumin-containing retinotectal ganglion cells in mouse. Acta Histochem Cytochem. 2012;45:201–210. doi: 10.1267/ahc.11061. [DOI] [PMC free article] [PubMed] [Google Scholar]
- Yonehara K, Ishikane H, Sakuta H, Shintani T, Nakamura-Yonehara K, Kamiji NL, Usui S, Noda M. Identification of retinal ganglion cells and their projections involved in central transmission of information about upward and downward image motion. PLoS One. 2009;4:e4320. doi: 10.1371/journal.pone.0004320. [DOI] [PMC free article] [PubMed] [Google Scholar]
Associated Data
This section collects any data citations, data availability statements, or supplementary materials included in this article.