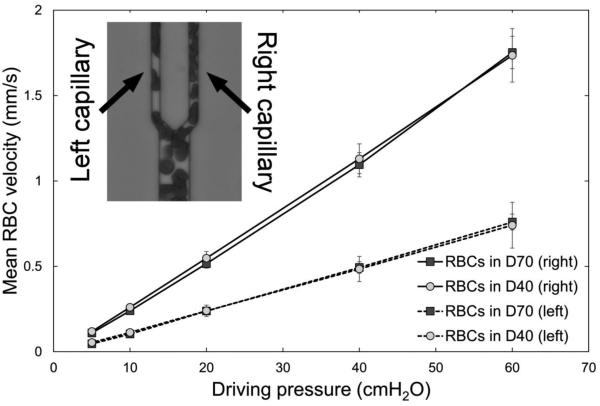
Figure 5.
Mean RBC velocity measured in “capillary” microchannels – corresponding to the left capillary (dashed line) and right capillary (solid line) – for RBCs suspended at 30% hematocrit in a 46.5 g/L solution of dextran 40 in GASP buffer (D40; circles) or in a 35.0 g/L solution of dextran 70 solution in GASP buffer (D70; squares) for driving pressures ranging from 5 to 60 cm H2O (0.49 to 5.88 kPa). Asterisks denote a statistically significant difference (p-value < 0.01) in mean RBC velocity between RBCs in D40 and D70 in both the left and right “capillaries”. Mean values ± standard deviation, n = 7.

