

Abstract
Scope
Enterohepatic recycling is often thought to involve mostly phase II metabolites generated in the liver. This study aims to determine if direct biliary excretion of extrahepatically generated glucuronides would also enable recycling.
Methods and Results
Conventional and modified intestinal perfusion models along with intestinal and liver microsomes were used to determine the contribution of extrahepatically derived glucuronides. Glucuronidation of four flavonoids (genistein, biochanin A, apigenin and chrysin @2.5–20 μM) were generally more rapid in the hepatic than intestinal microsomes. Furthermore, when aglycones (@10 μM each) were perfused, larger (1.7–9 fold) amounts of glucuronides were found in the bile than in the luminal perfusate. However, higher concentrations of glucuronides were not found in jugular vein than portal vein, and apigenin glucuronide actually displayed a significantly lower concentration in jugular vein (<1 nM) than portal vein (≈4 nM). A direct portal infusion of 4 flavonoid glucuronides (5.9–10.4 μM perfused @2 ml/hr) showed that the vast majority (>65%) of the glucuronides (except for biochanin A glucuronide) administered were efficiently excreted into the bile.
Conclusion
Direct biliary excretion of extrahepatically generated flavonoid glucuronides is a highly efficient clearance mechanism, which should enable enterohepatic recycling of flavonoids without hepatic conjugating enzymes.
Keywords: Enterohepatic Recycling, Flavonoids, UGT, Biliary Excretion, Extrahepatically, Efficient
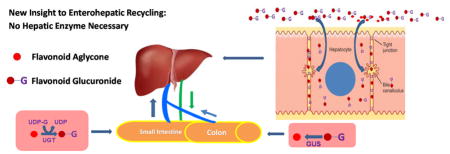
Graphical Abstract
The present study is focused on understanding the roles played by intestine and liver in the disposition of flavonoids using intestinal and portal vein perfusion. We found that flavonoid aglycones were rapidly metabolized in the intestine and that the flavonoid glucuronides were then rapidly taken up by the hepatocytes and excreted into the bile. Since conjugates are rapidly hydrolyzed by microbes for absorption again, the novel finding is that enterohepatic recycling can occur without hepatic enzymes, which provides a new insight into the enterohepatic recycling process.
1-INTRODUCTION
Flavonoids are an important class of phytochemicals in human diets because most of the vegetables and fruits are enriched with them [1–3]. Furthermore, consumption of a diet rich in vegetables and fruits is considered a healthy life style, and regularly promoted in the scientific literatures and popular media [1–3]. Hence, there is a considerable amount of interest in how flavonoids are processed in humans, because disposition of flavonoids affects their bioavailability and likely their bioactivities.
It is commonly recognized that most (albeit not all) flavonoid aglycones have poor bioavailabilities because they undergo rather rapid and extensive first-pass metabolism via glucuronidation and sulfation, and as a result most flavonoids are present as conjugates in the systemic circulation [2, 4–6]. However, flavonoids have reasonable half-life, and in some instance, reasonably long half-life (several hours). For example, many of the flavonoids that have been studied have apparent half-lives in the several hour range [2, 4–6]. The main reason is that flavonoids participate in extensive recycling, via the duo or triple recycling schemes [7, 8]. In these recycling schemes [6, 8, 9], the phase II metabolites (e.g., glucuronides and sulfate) are excreted into the intestinal lumen, directly via enterocytes or indirectly via bile, where they are converted back to aglycone either via enterocyte-derived glucuronidase [7] or more likely the microbial glucuronidases and sulfatases in the colon [6, 9]. The aglycones produced by these hydrolysis reactions are almost always rapidly reabsorbed and then undergo additional rounds of recycling. For genistein, the recycling schemes are rather efficient and genistein can remain in the rat blood (albeit at low nM concentration) for up to 7 days after removing a soy-rich rat chow (not shown). On the other hand, microbes in the gut could also further degrade the flavonoid and its conjugates in the gut to reductive metabolites and ring-fission products. For example, daidzein is metabolized by microbes into O-desmethylangolensin and equol, the latter is more active than daidzein as estrogen receptor agonist [10, 11].
In previous publications, it was generally believed that enterocyte derived flavonoid glucuronides were either excreted back into the lumen or pumped into the portal vein and continued on to enter the systemic circulation [2, 12–14], although Zhong and his associates provided evidence that OATP2B1 might take up conjugates generated extrahepatically and affected their plasma pharmacokinetic profiles [15]. Nevertheless, it was believed that glucuronides excreted into the bile were mainly, albeit not exclusively, derived from hepatocytes because there is no documented evidence that hepatocytes will efficiently take up xenobiotic glucuronides. In fact, only amino acid conjugated bile acids are believed to be efficiently (greater than 50% is considered efficient) taken up by the hepatocytes for recycling [16]. Many researchers have used biliary excretion of glucuronides as indicator of liver’s role in the disposition of flavonoids [12–14]. Some have made repeated assertions that if biliary excretion of conjugates were higher than intestinal excretion, then the role of liver is likely to be more important than that of the intestine or vice versa [13, 14, 17, 18].
In the present study, we tested the hypothesis that the biliary bound flavonoid conjugates are primarily derived from extrahepatic sources using four model flavonoid aglycones (i.e., genistein, biochanin A, apigenin and chrysin) and their glucuronides, using conventional and modified intestinal perfusion models. We used a concentration of 10 mM for perfusion study since it is relevant to human consumption dose of 10–30 mg flavonoids per day (assuming a molecular weight of 450 for a typical flavonoid glycoside and gastrointestinal fluid volume of 1–2 liters). We found that the biliary excretion of enterically or extrahepatically derived flavonoid glucuronides was highly efficient. This suggests that flavonoid glucuronides were used directly for the enterohepatic recycling without the involvement of hepatic enzymes.
2-MATERIALS AND METHODS
2.1-Chemicals and reagents
Genistein, biochanin A, apigenin and chrysin were purchased from Indofine Chemicals (Hillsborough, NJ). Hanks’ balanced salt solution (HBSS, powder form), uridine-diphosphoglucuronic acid (UDP), alamethicin, D-saccharic-1,4-lactone monohydrate, and magnesium chloride were purchased from Sigma-Aldrich (St. Louis, MO). BCA protein assay kit was purchased from Thermo Scientific (Rockford, IL). Non-soy rat chow (AIN76A) was purchased from Harlan Laboratory (Madison, WI). All other materials (typically analytical grade or better) were used without further purification.
2.2-Biosynthesis of flavonoid glucuronides
Genistein, biochanin A, apigenin and chrysin conjugates were biosynthesized using UGT1A9 expressed Hela cells [19], and purified using the solid phase extraction. The concentrations of the glucuronides were determined using UPLC with diode-array detector using a previously published method [20, 21].
2.3-Rat intestinal microsomes and liver microsomes preparation
Pooled male Wistar rat (from 8 rats, 300–350 grams, 12 week old) intestinal and liver microsomes were prepared as described previously [17]. The resulting microsomes were suspended in 250 mM sucrose solution, separated into microcentrifuge tubes, and stored at −80°C until use.
Protein concentrations of microsomes were determined by a protein assay kit (BCA, Bio-Rad, Hercules, CA) according to the manufacturer’s instructions, using bovine serum albumin as the standard.
2.4-Measurement of UGT activities using microsomes
The incubation procedures for measuring UGT activities using microsomes were published previously [17] and used as described here. A reaction mixture consisted of microsomes (final concentration, 1 mg/ml protein), magnesium chloride (0.88 mM), saccharolactone (4.4 mM), and alamethicin (0.022 mg/ml), three different concentrations of substrates (2.5, 10 and 20 μM) in a 50 mM potassium phosphate buffer (pH 7.4), and UDPGA (3.5 mM, added the last) (total volume, 200 μl) was incubated at 37°C for 30 or 60 min. The reaction was stopped by addition of 50 μl of 94% acetonitrile/6% glacial acetic acid containing 10 μM testosterone as the internal standard.
2.5-Animals and Procedures
Male Wistar rats (6–10 weeks, Body weight between 250 to 275g) were purchased from Harlan Laboratory (Indianapolis, IN). Rats were kept in an environmentally controlled room (temperature: 25 ± 2°C, humidity: 50 ± 5%, 12 h dark-light cycle) for at least 1 week before the experiments. The rats were fasted overnight before the date of the experiment. Rats were given non-soya food for 7 days before experiments using genistein, as genistein is found at a high concentration in the rat chow.
Animal surgery
The procedures were approved by the University of Houston’s Institutional Animal Care and Uses Committee (Protocol#: 12-031). Two schematics representing intestinal perfusion of a flavonoid aglycone or portal vein infusion of a flavonoid glucuronide were shown as Fig. 1 to provide an overview of the animal models. Rats, 4 per group, were first anesthetized by inhalation of isoflurane-oxygen mixture and maintained by i.m. injection of urethane (2g/kg). After anesthesia, the rat was put on a heating blanket under a heating lamp to keep its normal body temperature. Then the skin of neck and abdomen was properly shaved for surgery and cannula insertion. For cannulation of bile duct, we first located duodenum after making a 5cm abdominal midline incision. Then we separated the bile duct from the surrounding tissues by removing the fatty tissues from the bile duct surface. After separating the bile duct from the mesentery, we made a small cut with a micro vascular scissor and a tubing (PE10) was inserted and secured with a surgical suture. For cannulation of one segment of jejunum, we inserted inlet cannula at the beginning of jejunum and outlet cannula about 20–25 cm below the inlet one and then sutured both the cannulas. (This 20–25 cm of intestinal segment was chosen because our previous experiences [13, 14, 17] suggested that the segment would be long enough to produce sufficient metabolites in blood, bile and perfusate for measurement.) Then we put the intestine into the abdominal cavity which was covered by a saline-wetted cotton towel to prevent excessive bleeding and/or moisture loss. In addition, the inlet cannula was insulated and kept warm at 37°C by a circulating water bath to keep the temperature of the perfusate constant. Next, for cannulation of the jugular vein we made a 1.5cm incision on the left neck. Then we removed the fatty tissue from the jugular vein surface after dissecting different layers of tissues that covered the vein (e.g., superficial fascia and shallow muscularis). After locating and identifying the jugular vein, we inserted a tubing (PE20) through a small incision made by a microvascular scissor to collect blood from jugular vein. Lastly for cannulation of the portal vein, we first located superior mesenteric vein in the mesentery of jejunum, which is directly connected to the portal vein. After that we punctured the superior mesenteric vein by a venous indwelling needle (no tie-up with suture to allow free blood flow) and collected the blood periodically as we collected the perfusate.
Figure 1.

Schematic Depiction of the Basics of the Animal Models Used in the Current Study. Top schematic shows the intestinal perfusion model used with various sampling points. Bottom schematic shows the portal vein infusion model used with various sampling points. Flavonoids were introduced into the system at a constant rate (perfusion at 0.191 ml/min and infusion at 0.033 ml/min or 2 ml/hr). Each sample interval was 30 min, and at least four sequential samples were taken to demonstrate the achievement of the steady-state.
Intestinal perfusion experiment
This is a single-pass perfusion method and 4 rats were used for each flavonoid. One segments of jejunum was perfused with a perfusate containing an aglycone (10 μM) using an infusion pump (model PHD 2000; Harvard Apparatus Inc., Holliston, MA) at a flow rate of 0.191 ml/min. After a 30-min washout period, which was usually sufficient to achieve the steady-state absorption, four samples were collected from the outlet cannula every 30 min. Bile samples (approximately 0.4 ml) were collected before perfusion started and every 30 min afterward. Portal vein and jugular vein blood samples (approximately 50μl) were collected before perfusion started and every 30 min afterward. After perfusion, the length of the intestine was measured as described previously. The outlet concentrations of test flavonoids and their metabolites were determined by UPLC-MS/MS.
Portal vein infusion experiment
We conducted these experiment by infusing into portal vein (at 2 ml/hr) a 5% dextrose solution containing a flavonoid glucuronide at one of the following concentrations; genistein glucuronide (8.24 μM), biochanin a glucuronide (5.9 μM), apigenin glucuronide (10.4 μM) and chrysin glucuronide (10.0 μM). One segment of jejunum was also perfused with blank HBSS, and four rats were used per glucuronide. After a 30-min washout period, which was usually sufficient to achieve the steady-state absorption, four perfusate samples were collected from the outlet cannula every 30 min. Bile sample, jugular vein sample were collected before perfusion started and every 30 min afterward. The outlet concentrations of test compounds were determined by UPLC-MS/MS.
2.6-Sample preparation and processing
Perfusate
For intestinal perfusion experiment: 50 μl perfusate samples were taken and 200 μl 0.5 μM formononetin in acetonitrile (internal standard) was added. After that, samples were vortexed and centrifuged for 15mins at 15500 rpm. Then 200 μl supernatant was taken and 20 μl was injected to UPLC for analysis.
For portal vein infusion experiment: 200 μl perfusate samples were taken and 50 μl 0.5 μM formononetin in acetonitrile (internal standard) was added. After that, samples were vortexed and centrifuged for 15mins at 15500 rpm. Then 200 μl supernatant was taken and 20 μl was injected into UPLC-MS/MS for analysis.
Bile
10 μl of bile samples were added with 10 μl HBSS and 100 μl 0.1 μM formononetin in acetone (internal standard) was added. Afterwards, samples were vortexed and centrifuged for 15mins at 15500 rpm. Then 100 μl supernatant was collected, air dried and reconstituted in 200 μl 50% methanol. Next, the samples were vortexed, centrifuged at the speed of 15500 rpm for 15 minutes and 160 μl supernatant was taken and 20 μl was injected to UPLC-MS/MS.
Blood
50 μl of blood samples were mixed (i.e., vortexed) with 100 μl 0.1 μM formononetin in acetonitrile (internal standard) and centrifuged for 15mins at 15500 rpm. Then 100 μl supernatant was collected, air dried and reconstituted in 200 μl 50% methanol. Next, the samples were vortexed, centrifuged at the speed of 15500 rpm for 15 minutes and 160 μl supernatant was taken and 20 μl was injected to UPLC-MS/MS.
2.7-UPLC analysis of flavonoids and their conjugates
The conditions for analyzing apigenin, genistein, biochanin A and chrysin in the intestinal perfusate samples were as follows: system, AcQuity UPLC (Waters, Milford, MA) with photodiode array detector and Empower software; column, AcQuity UPLC BEH C18 column (Waters), 1.7 μm, 2.1 × 50 mm; mobile phase B, 100% acetonitrile; mobile phase A, aqueous solution (0.1% formic acid); gradient, 0 to 0.3 min, 0% B, flow rate, 1 ml/min; 0.3 to 1.80 min, 0 to 50% B, flow rate, 0.925 ml/min; 1.80 to 2.10 min, 50 to 100% B, flow rate, 0.925 ml/min; 2.10 to 2.40 min, 100% B, flow rate, 0.925 ml/min; and 2.40 to 2.50, 100 to 0% B, flow rate, 1 ml/min; wavelength, 254 nm; and injection volume, 10 μl.
LC-MS/MS was usually used for the analysis of blood, bile and perfusate samples when glucuronides were given via portal vein. For LC–MS/MS analysis, an API 5500-Qtrap triple quadrupole mass spectrometer (Applied Biosystem/MDS SCIEX, Foster City, CA) equipped with a TurboIonSpray™ source was operated at the positive ion mode. The concentrations of apigenin, genistein, biochanin A, chrysin and formononetin (I.S.) were determined by MRM (multiple reaction monitoring) method in the positive ion mode. The main working parameters for mass spectrum were set as follows: ion-spray voltage, 5.5 kV; ion source temperature, 500°C; gas1, 40 psi; gas2, 40 psi; curtain gas, 10 psi, collision gas, high. The compound-dependent parameters in MRM mode for 4 compounds and formononetin were summarized in Table S1 (Supplemental Information). Analyte concentrations were determined using the software Analyst 1.4.2. The calibration curves and lower limits of quantitation (LLOQs) of apigenin, genistein, biochanin A, chrysin and there glucuronides were summarized in Table S2. All calibration curves exhibited good linearity with correlation coefficient (r) within the range of 0.9955–0.9982. The LLOQs were appropriate for quantitative analysis of analytes in various biomatrices in the present studies.
2.8-Data and Statistical Analysis
Concentrations of flavonoid and its glucuronide determined from LC-MS/MS measurement were used directly in relevant data analysis. Amounts of flavonoid and its glucuronide were calculated by multiplying the concentrations with corresponding volume (e.g., perfusate volume, bile volume, etc.), which were measured experimentally. Amounts of flavonoid and its glucuronide in blood were estimated based on an assumption that the total blood volume is 8% of body weight. Amounts are needed to compare amount of flavonoids or flavonoid glucuronides in different samples (e.g., bile vs perfusate) since they have different volume. One way ANOVA with Tukey’s posthoc test was used in the statistical analysis with p value set at 0.05.
3-RESULTS
3.1-Glucuronidation of model flavonoids in intestinal vs liver microsomes
A classical approach to estimate the contribution of intestinal vs liver in the metabolism of a drug is to determine the rate of metabolism (in this case glucuronidation) in microsomes prepared from these two organs [14, 18, 22, 23]. The results of our studies showed that liver microsomes appeared to be much more active than intestinal microsomes in the glucuronidation of four model flavonoids (Fig. 2, except in few instances where the difference was small (see Fig. S1 Supplemental Information). Therefore, the liver is probably more active than intestine when same concentration of aglycone was presented to the respective microsomes. We have also showed identification of these glucuronides in the Supplemental Information (Fig. S2–Fig. S5) since the identification of these metabolites was shown in previous publications [20, 21, 24–26]. The genistein glucuronide was identified as genistein-7-O-glucuronide, biochanin A glucuronide identified as biochanin A-7-O-glucuronide, apigenin glucuronide identified as apigenin-7-O-glucuronide and chrysin glucuronide as chrysin-7-O-glucuronide.
Figure 2.

Metabolism of Four Model Flavonoids in Liver and Intestinal Microsomes of Wistar Rats. Experiments were conducted at three different concentrations to ensure that the trend obtained would be applicable at different substrate concentrations. Each column is the average of three determinations and the error bars are the standard deviation of the mean.
3.2-Intestinal perfusion studies of two isoflavones genistein and biochanin A
We have conducted perfusion studies of two isoflavones genistein and biochanin A using a modified single site single-pass perfusion model of the intestine. We continued to use the 10 μM concentration in our perfusion studies as were done previously since it is a concentration achievable by most flavonoids (e.g., solubility of biochanin A is less than 15 μM). Unlike the studies we conducted previously [14, 17, 18], we simultaneously measured jejunal absorption, biliary excretion, concentrations of isoflavones and their metabolites in the portal and jugular vein. The unique modification to this model is the simultaneous determination of flavonoid glucuronides in the jugular and portal vein compared to the model we used earlier. This modified model probably amplified the role of liver since total amount of metabolism in the intestine was derived using only approximately 20 cm of rat jejunum (total length of rat small intestine is approximately 80 cm).
The results indicated that the majority of the metabolites were found in the intestinal perfusate for both genistein glucuronide and biochanin A glucuronide (Fig. 3). A substantially smaller amount of glucuronide was found in the bile (Fig. 3). If we have perfused the whole intestine (here we only perfused 20 cm of the intestine), the discrepancy will be even more substantial. Unexpectedly, we did not find differences in the concentration of genistein or biochanin A in the jugular vs portal vein (Fig. 3). We also did not find differences in the concentration of their glucuronides in these two blood sampling sites. Although the portal vein concentrations of biochanin A glucuronide at 120 min sampling point was more than 100% higher than its jugular vein concentration, the difference was not statistically significant due to large variability. Similarly, the AUC values of aglycone and glucuronide were also not significantly different from each other, although jugular vein AUC of biochanin A aglycone was greater than its portal vein AUC (Table 1). This is somewhat unexpected since we expect significant uptake of the aglycone by the hepatocytes and then additional excretion of the conjugates into the blood from the hepatocytes. If the expected event had happened, we would have expected lower concentration of aglycones in the jugular vein vs portal vein but higher concentration of glucuronides in the jugular vein vs the portal vein.
Figure 3.

Single-Pass Intestinal Perfusion Study of Isoflavones Genistein and Biochanin A. The concentration of each isoflavone (perfused alone) was 10 μM delivered at a flow rate of 0.191 ml/min. We collected a perfusion, a bile, and a portal vein blood and a jugular vein blood sample every 30 min. Hence, the time axis for the perfusate and bile sample represented the beginning of the time when bile or perfusate was collected, and each time period of collection was 30 min. This was true for all perfusion experiments in this paper. Concentration of isoflavones and their glucuronides in bile (A1 Panel) and perfusate (B1 Panel) were determined using a validated LC or LC-MS/MS method. Amount of isoflavones and their glucuronides in bile (A2 Panel) and perfusate (B2 Panel) were calculated after multiplying the concentration with the volume of the bile (usually 0.4–0.5 ml) or perfusate (usually around 5.4 ml) collected during the experiment. Plasma concentration of isoflavones and their glucuronides were also determined and shown in C1 and C2 panels. Each data point is the average of four determinations and the error bars are the standard deviation of the mean.
Table 1.
AUC (±SD) (μM· hr) of Flavonoid Aglycones and Their Conjugates in Bile, Perfusate, Portal and Jugular Vein Following Intestinal Perfusion of Flavonoid Aglycones (10 μM).
| Intestinal Perfusion | Genistein | Biochanin A* | Apigenin | Chrysin | ||||
|---|---|---|---|---|---|---|---|---|
| Aglycone | Glucuronide | Aglycone | Glucuronide | Aglycone | Glucuronide | Aglycone | Glucuronide | |
| Bile | 4.0 | 28.8 | 0.096 | 21.0 | - | 9.4 | 1.0 | 2.4 |
| (0.23) | (9.3) | (0.061) | (2.8) | - | (3.1) | (0.26) | (0.91) | |
|
| ||||||||
| Perfusate | 2.4 | 3.2 | 1.6 | 12.4 | 1.4 | 4.8 | 3.3 | 0.87 |
| (0.70) | (0.83) | (0.42) | (1.8) | (0.70) | (1.1) | (1.3) | (0.46) | |
|
| ||||||||
| Portal | 0.37 | 0.010 | 0.010 | 0.019 | - | 0.0064 | 0.015 | 0.0078 |
| (0.17) | (0.0052) | (0.0082) | (0.0039) | - | (0.0024) | (0.019) | (0.0069) | |
|
| ||||||||
| Jugular | 0.40 | 0.0060 | 0.033 | 0.013 | - | 0.0010 | 0.0036 | - |
| (0.12) | (0.0047) | (0.042) | (0.0072) | - | (0.0012) | (0.0035) | - | |
Concentration at 150 min was not determined during experiments and hence AUC value for biochanin A was from 0 to 120 min. Interested reader may also find the actual amount of metabolite at different time points in Table S3 and S4 of Supplemental Information.
3.3 Intestinal perfusion studies of two flavones apigenin and chrysin
To determine if the unexpected findings shown above were isoflavone specific, we conducted studies to determine if they were also true for two flavones; apigenin (a structural isoform of genistein) and chrysin. The results obtained with flavones were very similar to those obtained using two isoflavones in that intestinally secreted metabolites were much more than the metabolites found in the bile. Similarly, there was no detectable difference between 2 flavonoid aglycones in the jugular vs portal vein (Fig. 4), although the concentration of apigenin was below the LLOQs in both samples derived from these two blood sampling sites. However, the portal vein concentration of apigenin glucuronide was unexpectedly higher than the corresponding jugular vein concentration, and this difference reached a statistically significant level (p<0.05) at the latter time points (120 and 150 min sampling time) (Fig. 4C1, bottom panel). Similarly, concentrations of chrysin conjugates were much higher in portal vein than in jugular vein, but the difference was not significant due to large variability in concentration of chrysin glucuronide (Fig. 4C2, bottom panel). An analysis of the AUC values showed apigenin aglycone concentration was often too low to be accurately measured in jugular vein or portal vein, whereas AUC of apigenin glucuronide was actually 6 fold higher in portal vein than jugular vein (Table 1). AUC values of chrysin aglycone was 4 fold higher in portal vein than in jugular vein, but AUC values of chrysin glucuronide was higher in portal vein than in jugular vein (Table 1). However, none of the differences in chrysin or chrysin glucuronide AUC values was statistically significant.
Figure 4.

Single-Pass Intestinal Perfusion Study of Flavones Apigenin and Chrysin. The concentration of individual flavone (perfused alone) was 10 μM delivered at a flow rate of 0.191 ml/min. We collected a perfusion, a bile, and a portal vein blood and a jugular vein blood sample every 30 min. Because bile is cannulated, it did not flow into the duodenum. Concentration of flavones and their glucuronide in bile (A1 Panel) and perfusate (B1 Panel) were determined using a LC or LC-MS/MS method. Amount of flavones and their conjugates in bile (A2 Panel) and perfusate (B2 Panel) were calculated after multiplying the concentration with the volume of the bile (usually 0.4–0.5 ml) or perfusate (usually around 5.4 ml) collected during the experiment. Plasma concentration of flavones and their glucuronides were also determined and shown in C1 and C2 panels. Each data point is the average of four determinations and the error bars are the standard deviation of the mean.
3.4-Mass balance considerations in the intestinal perfusion studies
An advantage of the single-pass perfusion experiment is that a steady-state absorption and intestinal metabolism can be achieved within 30–60 min for the present infusion rate of 0.191 ml/min. Therefore, absorption and metabolism in the intestine should be the same for each of the subsequent sampling period, which appeared to be true here for all four flavonoids although some fluctuation was expected and observed. Since the binding of aglycone should be saturated after certain period of time (in the order of minutes), the amount left in the perfusate reflects the amount of flavonoid aglycone that has been perfused minus the amount that has been absorbed, which was used to calculate the %absorbed (Table S3 in Supplemental Materials). Here, we made an approximate account of the amount absorbed vs amount of metabolite found in various samples we collected (Table S3 and Table S4 in Supplemental Materials). We found that biochanin A appeared to have the highest % (approximately 72%) of absorbed amount (metabolite in bile+perfusate) available for recycling, followed by genistein (27.7%) and apigenin (22.8%), whereas chrysin appears to have the lowest % (7.9%) of absorbed amounts participating in it (Table S4 in Supplemental Materials).
3.5-Portal infusion of flavonoid glucuronides
We did not foresee the lack of difference between portal and jugular concentration of flavonoids or their conjugates. We thought that there would be higher concentrations of aglycone and lower concentrations of glucuronides in portal vein, or alternatively, lower concentrations of aglycone and higher concentrations of glucuronides in the jugular vein. Additional, mass balance studies showed that liver would not get sufficient amount of biochanin A and apigenin aglycone for producing the amount of glucuronides shown in the bile. Therefore, we determined if conjugates formed in the intestine could be directly targeted for biliary excretion by using direct portal infusion of purified flavonoids conjugates. We found that a large percentage (>60%) of conjugates given via portal infusion was found in the bile except for biochanin A, where a small yet substantial percentage was recovered (approximately 30%) (Fig. 5). In addition, approximately 2% of the biochanin A glucuronide was recovered in the intestinal perfusate (Fig. 5). Interestingly, AUC value of glucuronides in bile were at least 100 times (some more than 550 times) greater than plasma AUC (Table 2), suggesting the presence of highly efficient biliary extraction process for these conjugates. Hence, these results showed that the biliary excretion of extrahepatic flavonoid glucuronides is a highly efficient clearance mechanism (with extraction ratio greater than 0.6 for 3 out of 4 flavonoid glucuronides, and nearly 1 for apigenin glucuronide).
Figure 5.


Portal Infusion of Flavonoid Conjugate Studies. The infusion was delivered at a rate of 2 ml/hr. We collected a perfusion, a bile, and a portal vein blood and a jugular vein blood sample every 30 min. The concentrations of the flavonoid conjugates in the infusion solution (5% dextrose) were 8.24 μM of genistein glucuronide, 5.9 μM of biochanin A glucuronide, 10.4 μM of apigenin glucuronide; and 10.0 μM of chrysin glucuronide (10.0 μM). Concentrations of flavonoid conjugates in bile, jejunal perfusate, and jugular vein plasma were determined using a validated LC-MS/MS method and shown in A1, B1, C1 and D1, whereas their corresponding amounts were calculated and shown in A2, B2, C2 and D2. Panel E1 and E2 showed concentration and amounts of flavonoid aglycones in bile, whereas Panel F1 shows concentration of flavonoid aglycones in the jugular vein. Each data point is the average of four determinations and the error bars are the standard deviation of the mean.
Table 2.
AUC (±SD) (μM· hr) of Flavonoid Aglycones and Their Conjugates in Bile, Perfusate, and Jugular Vein Following Direct Portal Vein Infusion of Flavonoid Glucuronides (10 μM).
| Portal Infusion | Genistein | Biochanin A | Apigenin | Chrysin | ||||
|---|---|---|---|---|---|---|---|---|
| Aglycone | Glucuronide | Aglycone | Glucuronide | Aglycone | Glucuronide | Aglycone | Glucuronide | |
| Bile | - | 23.1 | - | 8.0 | 0.57 | 24.0 | 0.46 | 22.5 |
| - | (3.9) | - | (1.7) | (0.71) | (3.7) | (0.25) | (5.3) | |
|
| ||||||||
| Perfusate | - | - | - | 0.068 | - | - | - | 0.0022 |
| - | - | - | (0.077) | - | - | - | (0.00055) | |
|
| ||||||||
| Plasma | 0.034 | 0.043 | - | 0.063 | - | - | - | 0.040 |
| (0.024) | (0.0029) | - | (0.025) | - | - | - | (0.021) | |
4-DISCUSSION
We have demonstrated for the first time that biliary excretion serves as a highly efficient in vivo clearance mechanism for four enterocyte-derived derived or extrahepatically produced flavonoid glucuronides (two isoflavones and two flavones). Because of the high bile over plasma concentration or AUC ratios, and hydrophilic properties of flavonoid glucuronides, it is likely, although unproven, that hepatic uptake of enterocyte-derived or extrahepatically produced flavonoid glucuronides provides a direct and fast input for their subsequent excretion via bile. This direct biliary excretion of extrahepatically generated flavonoid glucuronides significantly increases amounts of orally administered flavonoids available for the enterohepatic recycling, since intestine could rapidly glucuronidate flavonoids [18, 22, 23, 27–32]. It provides a highly efficient mechanism for the body to retain flavonoids that are rapidly metabolized in the gut, which would explain these flavonoids’ longer than expected half-life in vivo [2–4, 6]. Unlike enteric recycling, enterohepatic recycling in humans and many animals (exclude rats that do not have a gall bladder) may respond to feeding and produces a second peak in the plasma concentration time profile [33]. Hence, this direct and highly efficient glucuronide disposition pathway (Fig. 6) substantially increases the amounts of flavonoids available for enterohepatic recycling, which we believe is important for this class of antioxidants’ in vivo effects.
Fig. 6.

Schematic Representation of a Highly Efficient Enterohepatic Recycling of Flavonoid Glucuronides. In this diagram, flavonoid glucuronide produced in the intestine (via the action of UGT to produce flavonoid glucuronides ●-G) and other extrahepatic sites are transported to sinusoidal blood (blue arrows) via portal vein (blue vessels). Hepatocytes then rapidly take up ●-G directly from the sinusoidal blood and excreted ●-G into the bile (blue curved arrows), which carries ●-G into the duodenum via the (green) bile duct. The ●-G then travels to colon where ●-G is reconverted back to aglycone (●) via the action of bacterial glucuronidases (or GUS) and re-absorbed In the colon. The new paradigm here is that highly efficient enterohepatic recycling of flavonoids and perhaps other xenobiotics can occur without or with minimal involvement of hepatic enzymes.
Our conclusion was based on direct in vivo evidence using an in situ perfusion model, where glucuronides were produced in the enterocytes (using the intestinal perfusion model, Fig. 1A) or directly introduced into the portal vein (using the portal vein perfusion model, Fig. 1B). We were able to show that large amounts of flavonoid glucuronides were generated by the enterocytes and found in the intestinal perfusate (Fig. 3, Fig. 4, Table 1). It also showed that large amounts of flavonoid glucuronides were found in bile (Fig. 3, Fig. 4, Table 1). More remarkably, we showed that large percentages of flavonoid glucuronides (greater than 60% except for biochanin A glucuronide) introduced into the portal vein were found to be excreted directly into the bile (Fig. 5, Table 2), which was unexpected since these glucuronides can only be transported into hepatocytes via transporter(s) due to their high hydrophilicity. No literature reports have shown that there are such efficient pathways for hepatic clearance (extraction ratio of 0.6 or more) of plasma flavonoid glucuronides or any glucuronides for that matter (see Discussion later). The highly efficient pathway is only known previously for recycling of bile acids [34].
Our conclusion that most (>60%) of the enteric-derived glucuronides (3 out of 4 flavonoid glucuronides) are efficiently targeted to direct biliary excretion is novel. This highly efficient disposition pathway for flavonoids may hold the key for improved recycling of flavonoids, polyphenols (e.g., resveratrol) and drugs (e.g., raloxifene) that are similarly disposed in vivo. Without this highly efficient pathway, much of the flavonoids glucuronides generated extrahepatically would have been eliminated via kidney. This efficient excretion explains why less than 4% of apigenin and its conjugates were recovered in urine even though the compound was well absorbed and rapidly metabolized [35]. It is also consistent with the findings of another study where chrysin was found to be poorly bioavailable in humans and rats, but only less than 3% of dose excreted as urinary metabolites [36]. It explains why apigenin and its metabolites, measured using radiolabeled apigenin, were found to remain in vivo ten days after its administration with an apparent half-life of longer than 90 hr [37]. Similarly, genistein and biochanin A have been shown to have poor bioavailability (both less than 5%) in rats, but both compounds had reasonable long half-life (>7 hr) in vivo [38], consistent with the fact that these two compounds undergo recycling. We believe that the recycling relies upon direct excretion of flavonoid glucuronides generated in the enterocyte, since these two compounds are rapidly and nearly completely glucuronidated in the rat intestine [18].
There is no clear literature consensus where the conjugates participating in the enterohepatic recycling are produced in vivo [33]. Textbooks usually state that drugs and/or their phase II conjugates excreted into the bile can undergo recycling, without pointing out where the conjugates are derived. The underlying assumption is that many if not most glucuronides were generated in or derived from the liver. This is because the recycling is often used to explain the recycling of bile acid conjugates, which are generally formed in the liver [33]. Bile acids usually form conjugates with amino acids which are rare in the conjugation of drugs and dietary substances. However, little is known about the fate of flavonoid glucuronides or other glucuronides generated in the gut wall. We knew that a large percentage of glucuronide conjugates generated in the gut wall is excreted back into the lumen. The question is, for those conjugates that exit basolateral membrane to the portal vein, what is their fate? Could they be efficiently taken up by the hepatocytes?
Hepatocytes have been shown to take up glucuronides since 1970s. In 1978, Norling et al [39] showed that 4-nitrophenyl glucuronide and phenolphthalein glucuronide were taken up by the hepatocytes. Studies published in the 1980s and 1990s, many by Vore and her coworkers, using primary hepatocytes have shown that hepatocytes are capable of taking up glucuronides of sex hormones (e.g., estradiol) [40–42], toxic bile acid lithocholate [43], diagnostic agent iopanoic acid [44], and certain drugs and other xenobiotics [45]. Similar works from Sugiyama and his coworkers later confirmed those earlier findings, although they sometimes used more integrated model such as the perfused liver model [46, 47]. These studies clearly demonstrated that hepatocytes can take up glucuronides, and by extension flavonoid glucuronides (also never shown directly). However, these studies usually did not reveal that hepatocyte-mediated uptake can result in highly efficient clearance of glucuronides present in the blood. One study showed that glucuronide of 6-hydroxy-5,7-dimethyl-2-methylamino-4-(3-pyridylmethyl) benzothiazole (a drug candidate) was reasonably efficiently taken up by the hepatocytes with an extraction ratio of 0.3 using a perfused liver model [46]. This extraction ratio (0.3) was the highest one we could find in the literature for a glucuronide. This is much less than we observed here for flavonoid conjugates such as apigenin glucuronide, where the extraction ratio is close to 1. Hence, our study has demonstrated the presence of a highly efficient system for driving flavonoid glucuronides present in the blood to bile excretion, which affords these flavonoids to be recycled upon hydrolysis by intestinal microorganisms. Obviously, microbial glucuronidases and their selectivity and functional activities toward flavonoid glucuronides will be important for the reconversion of these conjugates into aglycones (Fig. 6). Thereafter, how fast flavonoid aglycones can penetrate the colonic epithelium will also determine the efficiency of colonic uptake of flavonoid aglycones, and by extension the efficiency of their enterohepatic recycling.
Whereas hepatocytes have been shown to take up glucuronides, the molecular mechanisms responsible for their uptake are only recently becoming clear, albeit seldom specifically for flavonoid glucuronides [15]. For example, OATPs were involved in the uptake of steroid conjugate estradiol-glucuronide via OATP1b2 and 1a4 [48, 49], of gemfibrozil-1-O-β-glucuronide via OATP1B1, 1B3, and 2B1 [50], of ezetimibe glucuronide via OATP1B1 and 2B1 [51], of scutellarein-7-O-glucuronide via OATP2B1 [15], and of raloxifene-glucuronides via OATP1B1 and OATP1B3 [52]. However, these studies are usually conducted using cells overexpressing various hepatic transporters, and as such it is difficult to gauge the actual contribution of each of the OATPs in vivo. In a study conducted in vivo using Atp11c mutant mice, which has very significantly reduced (>80% decrease) expression of OATP1b2 and 1a4, clearance of 17β-estradiol-glucuronide was reduced less than 50% and its steady state concentration was increased only 2 fold. Hence, we cannot exclude the possibility that other uptake transporters might be involved in flavonoid glucuronide uptake by the hepatocytes [49].
Our results have shown chrysin was metabolized much less efficiently than other three flavonoids, in that biliary concentrations of aglycone were only 50% less (p>0.05) than its glucuronide whereas perfusate concentration of aglycone was higher than its glucuronide (Fig. 3, Fig. 4). This was not consistent with chrysin’s metabolism rates in the microsomal studies (Fig. 2), which was only slower than apigenin but faster than genistein and biochanin A. This translates into higher chrysin concentration in the portal vein than in the jugular vein (Fig. 4C2), although the difference was not significant due to large standard deviation. It is plausible that a large sample size would have demonstrated this difference, which would mean that liver mediated metabolism plays a more important role in the enterohepatic recycling of chrysin. That would be much different from the other three flavonoids, where intestine was playing a dominant role.
We also found that one of the flavonoid conjugates, biochanin A glucuronide, which was not particularly efficiently eliminated via bile, was eliminated via direct intestinal excretion. Whereas this was not unique for glucuronides, it is quite rare for flavonoid glucuronide and there was no literature report of such a clearance mechanism for flavonoid conjugates. This suggest that direct intestinal excretion from plasma could provide a method to recycle biochanin A via so called enteric recycling mechanism [6].
Lastly, we believe that our studies have provided strong evidence that extrahepatically generated glucuronides can be efficiently targeted for biliary excretion and subsequent recycling. The next important and relevant question is: for flavonoid aglycones, which is the most important organ for their metabolism? Our data clearly suggested that intestine is the main site of metabolism for these flavonoid aglycones. This is because even at the highest reported hepatic flow rate (range 25–75 ml/min/kg) [53, 54], the maximal amount of any flavonoid aglycone (@maximal portal vein concentration of 9 nM) flowing to liver every 30 min for a 300 gram rat is 5.7 nmol. The latter is significantly less than the amount absorbed from the intestine (>45 nmole every 30 min, Table S3, Supplemental Information). Therefore, intestine appears to represent the most important organ for the glucuronidation of these flavonoids, as most absorbed flavonoids did not leave intestine as aglycone. However, as shown earlier, for enterohepatic recycling, it is the hepatic uptake and direct excretion of the extrahepatically generated glucuronides that dominate. Hence, both intestine and liver play a vital role in the disposition of flavonoids, although liver enzymes did not.
In conclusion, our data show for the first time that direct biliary excretion of flavonoid glucuronides generated in the enterocytes or other extrahepatic tissues is a highly efficient mechanism. We show for the first time that enterohepatic recycling of flavonoids can efficiently proceed with intestinal enzymes and biliary excretion, but without hepatic enzymes, which has not been recognized previously. Because enterohepatic recycling of flavonoids are known to prolong their presence in animals and humans, efficient recycling of extrahepatically generated flavonoid glucuronides represents a very efficient mechanism for enterohepatic recycling of flavonoids and possibly other compounds that undergo efficient enteric glucuronidation.
Supplementary Material
Acknowledgments
Work was supported by a grant from National Institute of Health GM070737 to MH. MZ was also supported by a training grant from Taihe Hospital, and RS was also supported by a training grant from Hubei University of Medicine.
ABBREVIATIONS
- AUC
area under the curve
- HBSS
Hanks’ balanced salt solution
- i.m
intramuscular injection
- I.S
internal standard
- LLOQ
lower limits of quantitation
- MRM
multiple reaction monitoring
- OATP
organic anion transporting peptide
- UDPGA
uridine-diphospho-glucuronic acid
- UGT
UDP-glucuronosyltransferase
- UPLC
ultra-performance liquid chromatography
- UPLC-MS/MS
UPLC triple quad mass spectrometry
Footnotes
Conflict of Interests.
The authors report no conflict of interests.
Contribution of the Authors
MZ, design and execution of experiments, sample and data analysis and plots, paper writing
RS, design and execution of experiments, sample and data analysis and plots, paper writing
SB, design and execution of experiments, sample analysis
YM, execution of experiments, sample analysis
SG, sample analysis method development
TY, Caco-2 cell culture and experiments
SG, design of experiments, supervision of data analysis method development
JZ, provide the financial support, discuss the project aims and its relevance to clinical use of irinotecan
MH, design of experiments, supervise data analysis and plots, paper writing, obtained funding
References
- 1.Brown DM, Kelly GE, Husband AJ. Flavonoid compounds in maintenance of prostate health and prevention and treatment of cancer. Mol Biotechnol. 2005;30:253–270. doi: 10.1385/MB:30:3:253. [DOI] [PubMed] [Google Scholar]
- 2.Hollman PC, Katan MB. Bioavailability and health effects of dietary flavonols in man. Arch Toxicol Suppl. 1998;20:237–248. doi: 10.1007/978-3-642-46856-8_21. [DOI] [PubMed] [Google Scholar]
- 3.McCue P, Shetty K. Health benefits of soy isoflavonoids and strategies for enhancement: a review. Crit Rev Food Sci Nutr. 2004;44:361–367. doi: 10.1080/10408690490509591. [DOI] [PubMed] [Google Scholar]
- 4.Cassidy A. Factors affecting the bioavailability of soy isoflavones in humans. J AOAC Int. 2006;89:1182–1188. [PubMed] [Google Scholar]
- 5.Ross JA, Kasum CM. Dietary flavonoids: bioavailability, metabolic effects, and safety. Annu Rev Nutr. 2002;22:19–34. doi: 10.1146/annurev.nutr.22.111401.144957. [DOI] [PubMed] [Google Scholar]
- 6.Hu M. Commentary: bioavailability of flavonoids and polyphenols: call to arms. Mol Pharm. 2007;4:803–806. doi: 10.1021/mp7001363. [DOI] [PMC free article] [PubMed] [Google Scholar]
- 7.Xia B, Zhou Q, Zheng Z, Ye L, et al. A novel local recycling mechanism that enhances enteric bioavailability of flavonoids and prolongs their residence time in the gut. Molecular pharmaceutics. 2012;9:3246–3258. doi: 10.1021/mp300315d. [DOI] [PMC free article] [PubMed] [Google Scholar]
- 8.Dai P, Zhu L, Luo F, Lu L, et al. Triple Recycling Processes Impact Systemic and Local Bioavailability of Orally Administered Flavonoids. The AAPS journal. 2015 doi: 10.1208/s12248-015-9732-x. [DOI] [PMC free article] [PubMed] [Google Scholar]
- 9.Jeong EJ, Liu X, Jia X, Chen J, Hu M. Coupling of conjugating enzymes and efflux transporters: impact on bioavailability and drug interactions. Curr Drug Metab. 2005;6:455–468. doi: 10.2174/138920005774330657. [DOI] [PubMed] [Google Scholar]
- 10.Bowey E, Adlercreutz H, Rowland I. Metabolism of isoflavones and lignans by the gut microflora: a study in germ-free and human flora associated rats. Food Chem Toxicol. 2003;41:631–636. doi: 10.1016/s0278-6915(02)00324-1. [DOI] [PubMed] [Google Scholar]
- 11.Kinjo J, Tsuchihashi R, Morito K, Hirose T, et al. Interactions of phytoestrogens with estrogen receptors alpha and beta (III). Estrogenic activities of soy isoflavone aglycones and their metabolites isolated from human urine. Biol Pharm Bull. 2004;27:185–188. doi: 10.1248/bpb.27.185. [DOI] [PubMed] [Google Scholar]
- 12.O’Leary KA, Day AJ, Needs PW, Mellon FA, et al. Metabolism of quercetin-7- and quercetin-3-glucuronides by an in vitro hepatic model: the role of human beta-glucuronidase, sulfotransferase, catechol-O-methyltransferase and multi-resistant protein 2 (MRP2) in flavonoid metabolism. Biochem Pharmacol. 2003;65:479–491. doi: 10.1016/s0006-2952(02)01510-1. [DOI] [PubMed] [Google Scholar]
- 13.Wang SW, Kulkarni KH, Tang L, Wang JR, et al. Disposition of flavonoids via enteric recycling: UDP-glucuronosyltransferase (UGT) 1As deficiency in Gunn rats is compensated by increases in UGT2Bs activities. J Pharmacol Exp Ther. 2009;329:1023–1031. doi: 10.1124/jpet.108.147371. [DOI] [PMC free article] [PubMed] [Google Scholar]
- 14.Wang SW, Chen J, Jia X, Tam VH, Hu M. Disposition of flavonoids via enteric recycling: structural effects and lack of correlations between in vitro and in situ metabolic properties. Drug Metab Dispos. 2006;34:1837–1848. doi: 10.1124/dmd.106.009910. [DOI] [PubMed] [Google Scholar]
- 15.Gao C, Zhang H, Guo Z, You T, et al. Mechanistic studies on the absorption and disposition of scutellarin in humans: selective OATP2B1-mediated hepatic uptake is a likely key determinant for its unique pharmacokinetic characteristics. Drug metabolism and disposition: the biological fate of chemicals. 2012;40:2009–2020. doi: 10.1124/dmd.112.047183. [DOI] [PubMed] [Google Scholar]
- 16.Zwicker BL, Agellon LB. Transport and biological activities of bile acids. Int J Biochem Cell Biol. 2013;45:1389–1398. doi: 10.1016/j.biocel.2013.04.012. [DOI] [PubMed] [Google Scholar]
- 17.Chen J, Lin H, Hu M. Metabolism of flavonoids via enteric recycling: role of intestinal disposition. J Pharmacol Exp Ther. 2003;304:1228–1235. doi: 10.1124/jpet.102.046409. [DOI] [PubMed] [Google Scholar]
- 18.Chen J, Wang S, Jia X, Bajimaya S, et al. Disposition of Flavonoids via Recycling: Comparison of Intestinal versus Hepatic Disposition. Drug Metab Dispos. 2005;33:1777–1784. doi: 10.1124/dmd.105.003673. [DOI] [PubMed] [Google Scholar]
- 19.Jiang W, Xu B, Wu B, Yu R, Hu M. UDP-glucuronosyltransferase (UGT) 1A9-overexpressing HeLa cells is an appropriate tool to delineate the kinetic interplay between breast cancer resistance protein (BRCP) and UGT and to rapidly identify the glucuronide substrates of BCRP. Drug Metab Dispos. 2012;40:336–345. doi: 10.1124/dmd.111.041467. [DOI] [PMC free article] [PubMed] [Google Scholar]
- 20.Singh R, Wu B, Tang L, Hu M. Uridine Diposphate Glucuronosyltransferases Isoform-Dependent Regiospecificity of Glucuronidation of Flavonoids. J Agric Food Chem. 2011 doi: 10.1021/jf1041454. [DOI] [PMC free article] [PubMed] [Google Scholar]
- 21.Wu B, Xu B, Hu M. Regioselective glucuronidation of flavonols by six human UGT1A isoforms. Pharmaceutical research. 2011;28:1905–1918. doi: 10.1007/s11095-011-0418-5. [DOI] [PMC free article] [PubMed] [Google Scholar]
- 22.Donovan JL, Crespy V, Manach C, Morand C, et al. Catechin is metabolized by both the small intestine and liver of rats. J Nutr. 2001;131:1753–1757. doi: 10.1093/jn/131.6.1753. [DOI] [PubMed] [Google Scholar]
- 23.Jia X, Chen J, Lin H, Hu M. Disposition of flavonoids via enteric recycling: enzyme-transporter coupling affects metabolism of biochanin A and formononetin and excretion of their phase II conjugates. J Pharmacol Exp Ther. 2004;310:1103–1113. doi: 10.1124/jpet.104.068403. [DOI] [PubMed] [Google Scholar]
- 24.Wu B, Morrow JK, Singh R, Zhang S, Hu M. Three-dimensional quantitative structure-activity relationship studies on UGT1A9-mediated 3-O-glucuronidation of natural flavonols using a pharmacophore-based comparative molecular field analysis model. J Pharmacol Exp Ther. 2011;336:403–413. doi: 10.1124/jpet.110.175356. [DOI] [PMC free article] [PubMed] [Google Scholar]
- 25.Wu B, Zhang S, Hu M. Evaluation of 3,3′,4′-trihydroxyflavone and 3,6,4′-trihydroxyflavone (4′-O-glucuronidation) as the in vitro functional markers for hepatic UGT1A1. Molecular pharmaceutics. 2011;8:2379–2389. doi: 10.1021/mp200300w. [DOI] [PMC free article] [PubMed] [Google Scholar]
- 26.Ge S, Gao S, Yin T, Hu M. Determination of Pharmacokinetics of Chrysin and Its Conjugates in Wild-Type FVB and Bcrp1 Knockout Mice Using a Validated LC-MS/MS Method. Journal of agricultural and food chemistry. 2015;63:2902–2910. doi: 10.1021/jf5056979. [DOI] [PubMed] [Google Scholar]
- 27.Andlauer W, Kolb J, Furst P. Isoflavones from tofu are absorbed and metabolized in the isolated rat small intestine. J Nutr. 2000;130:3021–3027. doi: 10.1093/jn/130.12.3021. [DOI] [PubMed] [Google Scholar]
- 28.Chen L, Lee MJ, Li H, Yang CS. Absorption, distribution, elimination of tea polyphenols in rats. Drug Metab Dispos. 1997;25:1045–1050. [PubMed] [Google Scholar]
- 29.Crespy V, Morand C, Manach C, Besson C, et al. Part of quercetin absorbed in the small intestine is conjugated and further secreted in the intestinal lumen. Am J Physiol. 1999;277:G120–126. doi: 10.1152/ajpgi.1999.277.1.G120. [DOI] [PubMed] [Google Scholar]
- 30.Fan Y, Tang L, Zhou J, Feng Q, et al. Simultaneous determination of sulfation and glucuronidation of flavones in FVB mouse intestine in vitro and in vivo. J Appl Toxicol. 2013;33:273–280. doi: 10.1002/jat.1737. [DOI] [PubMed] [Google Scholar]
- 31.Liu Y, Hu M. Absorption and metabolism of flavonoids in the caco-2 cell culture model and a perused rat intestinal model. Drug Metab Dispos. 2002;30:370–377. doi: 10.1124/dmd.30.4.370. [DOI] [PubMed] [Google Scholar]
- 32.Silberberg M, Morand C, Mathevon T, Besson C, et al. The bioavailability of polyphenols is highly governed by the capacity of the intestine and of the liver to secrete conjugated metabolites. Eur J Nutr. 2006;45:88–96. doi: 10.1007/s00394-005-0568-5. [DOI] [PubMed] [Google Scholar]
- 33.Roberts MS, Magnusson BM, Burczynski FJ, Weiss M. Enterohepatic circulation: physiological, pharmacokinetic and clinical implications. Clinical pharmacokinetics. 2002;41:751–790. doi: 10.2165/00003088-200241100-00005. [DOI] [PubMed] [Google Scholar]
- 34.Kevresan S, Kuhajda K, Kandrac J, Fawcett JP, Mikov M. Biosynthesis of bile acids in mammalian liver. European journal of drug metabolism and pharmacokinetics. 2006;31:145–156. doi: 10.1007/BF03190711. [DOI] [PubMed] [Google Scholar]
- 35.Hanske L, Loh G, Sczesny S, Blaut M, Braune A. The bioavailability of apigenin-7-glucoside is influenced by human intestinal microbiota in rats. The Journal of nutrition. 2009;139:1095–1102. doi: 10.3945/jn.108.102814. [DOI] [PubMed] [Google Scholar]
- 36.Walle T, Otake Y, Brubaker JA, Walle UK, Halushka PV. Disposition and metabolism of the flavonoid chrysin in normal volunteers. British journal of clinical pharmacology. 2001;51:143–146. doi: 10.1111/j.1365-2125.2001.01317.x. [DOI] [PMC free article] [PubMed] [Google Scholar]
- 37.Gradolatto A, Basly JP, Berges R, Teyssier C, et al. Pharmacokinetics and metabolism of apigenin in female and male rats after a single oral administration. Drug metabolism and disposition: the biological fate of chemicals. 2005;33:49–54. doi: 10.1124/dmd.104.000893. [DOI] [PubMed] [Google Scholar]
- 38.Moon YJ, Sagawa K, Frederick K, Zhang S, Morris ME. Pharmacokinetics and bioavailability of the isoflavone biochanin A in rats. The AAPS journal. 2006;8:E433–442. doi: 10.1208/aapsj080351. [DOI] [PMC free article] [PubMed] [Google Scholar]
- 39.Norling A, Andersson B, Berggren M, Moldeus P. Uptake of glucuronides into isolated hepatocytes and their effects on glucuronide and sulphate conjugation. Acta Pharmacol Toxicol (Copenh) 1978;43:311–317. doi: 10.1111/j.1600-0773.1978.tb02271.x. [DOI] [PubMed] [Google Scholar]
- 40.Brock WJ, Vore M. Characterization of uptake of steroid glucuronides into isolated male and female rat hepatocytes. The Journal of pharmacology and experimental therapeutics. 1984;229:175–181. [PubMed] [Google Scholar]
- 41.Brouwer KL, Durham S, Vore M. Multiple carriers for uptake of [3H]estradiol-17 beta(beta-D-glucuronide) in isolated rat hepatocytes. Molecular pharmacology. 1987;32:519–523. [PubMed] [Google Scholar]
- 42.Teo S, Vore M. Mirex exposure inhibits the uptake of estradiol-17 beta(beta-D-glucuronide), taurocholate, and L-alanine into isolated rat hepatocytes. Toxicology and applied pharmacology. 1990;104:411–420. doi: 10.1016/0041-008x(90)90163-o. [DOI] [PubMed] [Google Scholar]
- 43.Takikawa H, Tomita J, Takemura T, Yamanaka M. Cytotoxic effect and uptake mechanism by isolated rat hepatocytes of lithocholate and its glucuronide and sulfate. Biochimica et biophysica acta. 1991;1091:173–178. doi: 10.1016/0167-4889(91)90058-6. [DOI] [PubMed] [Google Scholar]
- 44.Barnhart JL, Witt BL. Uptake of iopanoic acid and its glucuronide conjugate by rat hepatocytes in primary culture. Proc Soc Exp Biol Med. 1983;173:506–511. doi: 10.3181/00379727-173-41678. [DOI] [PubMed] [Google Scholar]
- 45.Miyauchi S, Sugiyama Y, Iga T, Hanano M. Membrane-limited hepatic transport of the conjugative metabolites of 4-methylumbelliferone in rats. Journal of pharmaceutical sciences. 1988;77:688–692. doi: 10.1002/jps.2600770809. [DOI] [PubMed] [Google Scholar]
- 46.Takenaka O, Horie T, Suzuki H, Sugiyama Y. Carrier-mediated active transport of the glucuronide and sulfate of 6-hydroxy-5,7-dimethyl-2-methylamino-4-(3-pyridylmethyl) benzothiazole (E3040) into rat liver: quantitative comparison of permeability in isolated hepatocytes, perfused liver and liver in vivo. The Journal of pharmacology and experimental therapeutics. 1997;280:948–958. [PubMed] [Google Scholar]
- 47.Kouzuki H, Suzuki H, Ito K, Ohashi R, Sugiyama Y. Contribution of sodium taurocholate co-transporting polypeptide to the uptake of its possible substrates into rat hepatocytes. The Journal of pharmacology and experimental therapeutics. 1998;286:1043–1050. [PubMed] [Google Scholar]
- 48.Shitara Y, Li AP, Kato Y, Lu C, et al. Function of uptake transporters for taurocholate and estradiol 17beta-D-glucuronide in cryopreserved human hepatocytes. Drug Metab Pharmacokinet. 2003;18:33–41. doi: 10.2133/dmpk.18.33. [DOI] [PubMed] [Google Scholar]
- 49.Matsuzaka Y, Hayashi H, Kusuhara H. Impaired Hepatic Uptake by Organic Anion-Transporting Polypeptides Is Associated with Hyperbilirubinemia and Hypercholanemia in Atp11c Mutant Mice. Molecular pharmacology. 2015;88:1085–1092. doi: 10.1124/mol.115.100578. [DOI] [PubMed] [Google Scholar]
- 50.Kimoto E, Li R, Scialis RJ, Lai Y, Varma MV. Hepatic Disposition of Gemfibrozil and Its Major Metabolite Gemfibrozil 1-O-beta-Glucuronide. Molecular pharmaceutics. 2015;12:3943–3952. doi: 10.1021/acs.molpharmaceut.5b00411. [DOI] [PubMed] [Google Scholar]
- 51.Oswald S, Konig J, Lutjohann D, Giessmann T, et al. Disposition of ezetimibe is influenced by polymorphisms of the hepatic uptake carrier OATP1B1. Pharmacogenetics and genomics. 2008;18:559–568. doi: 10.1097/FPC.0b013e3282fe9a2c. [DOI] [PubMed] [Google Scholar]
- 52.Trdan Lusin T, Stieger B, Marc J, Mrhar A, et al. Organic anion transporting polypeptides OATP1B1 and OATP1B3 and their genetic variants influence the pharmacokinetics and pharmacodynamics of raloxifene. J Transl Med. 2012;10:76. doi: 10.1186/1479-5876-10-76. [DOI] [PMC free article] [PubMed] [Google Scholar]
- 53.Davies B, Morris T. Physiological parameters in laboratory animals and humans. Pharm Res. 1993;10:1093–1095. doi: 10.1023/a:1018943613122. [DOI] [PubMed] [Google Scholar]
- 54.Pollack GM, Brouwer KL, Demby KB, Jones JA. Determination of hepatic blood flow in the rat using sequential infusions of indocyanine green or galactose. Drug Metab Dispos. 1990;18:197–202. [PubMed] [Google Scholar]
Associated Data
This section collects any data citations, data availability statements, or supplementary materials included in this article.