Abstract
By employing a capillary ITP (CITP)/CZE-based proteomic technology, a total of 1795 distinct mouse Swiss-Prot protein entries (or 1705 nonredundant proteins) are identified from synaptic mitochondria isolated from mouse brain. The ultrahigh resolving power of CITP/CZE is evidenced by the large number of distinct peptide identifications measured from each CITP fraction together with the low peptide fraction overlapping among identified peptides. The degree of peptide overlapping among CITP fractions is even lower than that achieved using combined CIEF/nano-RP LC separations for the analysis of the same mitochondrial sample. When evaluating the protein sequence coverage by the number of distinct peptides mapping to each mitochondrial protein identification, CITP/CZE similarly achieves superior performance with 1041 proteins (58%) having 3 or more distinct peptides, 233 (13%) having 2 distinct peptides, and 521 (29%) having a single distinct peptide. The reproducibility of protein identifications is found to be around 86% by comparing proteins identified from repeated runs of the same mitochondrial sample. The analysis of the mouse mitochondrial proteome by two CITP/CZE runs results in the detection of 2095 distinct mouse Swiss-Prot protein entries (or 1992 nonredundant proteins), corresponding to 59% coverage of the updated Maestro mitochondrial reference set. The collective analysis from combined CITP/CZE and CIEF-based proteomic studies yields the identification of 2191 distinct mitochondrial protein entries (or 2082 nonredundant proteins), corresponding to 76% coverage of the MitoP2-database reference set.
Keywords: Capillary isotachophoresis, Capillary zone electrophoresis, Electrospray ionization mass spectrometry, Mitochondria, Proteomics
1 Introduction
Mitochondria have a variety of essential responsibilities in cellular metabolism, e.g., the production of ATP through oxidative phosphorylation in aerobic cells as well as the initiation of the signal cascade leading to apoptosis [1]. Alteration of the mitochondrial proteome and altered mitochondrial function has been implicated in a variety of degenerative diseases, heart disease, aging, and cancer [2–7]. Because the mitochondria are a major source of endogenously generated reactive oxygen species (ROS), it is not surprising that they have been proposed to play a major role in aging [8, 9]. The free radical theory of aging predicts that oxidative damage to the mitochondria can lead to an amplifying effect whereby damaged mitochondria release more ROS, further increasing oxidative damage [10]. The accumulation of damaged mitochondria results in a decrease in the capacity to produce ATP. This can, in turn, cause cellular dysfunction if oxidative damage exceeds the capacity of the cell to handle removal of both ROS and oxidatively damaged macromolecules [11].
In addition to their biological and medical significance, mitochondria are ideal targets for global proteome analysis because they have a manageable level of complexity as a consequence of their apparent prokaryotic ancestry. Their endosymbiotic origins have been preserved in their double membrane structure, and they possess their own circular genome with mitochondria-specific transcription, translation, and protein assembly systems. Mammalian mitochondria DNA encodes for 13 essential polypeptide components of the oxidative phosphorylation system, small and large rRNAs, and 22 tRNAs. The remaining mitochondrial proteins of the oxidative phosphorylation system, metabolic enzymes, membrane channel proteins, and any other proteins regulating mitochondrial function are derived from the nuclear genome. Import of these proteins into the mitochondria is highly regulated through the function of protein chaperones and the inner and outer transmembrane peptides import complexes [12, 13]. However, the coordination of protein synthesis from two separate genomes within a cell and their correct submitochondrial assembly is not fully understood [14].
While 2-D PAGE has been employed toward an inventory of the mitochondrial proteome [7, 11, 15–19], mitochondria contain many membrane-bound and very basic proteins that are quite difficult to be analyzed by 2-D PAGE [7, 14]. Consequently, considerable efforts have been devoted to the application of various LC techniques in single or multidimensional separation format prior to MS detection for the analysis of mitochondrial proteins [17–31]. In particular, the peptide-based shotgun proteomic studies fully exploit the resolution and sensitivity achievable with multidimensional LC-MS or SDS-PAGE/LC-MS approaches, allowing many additional mitochondrial proteins to be identified.
Still, proteins cataloged from reported proteomic studies comprise only small part of the estimated 1500 [32, 33] and 697–4532 [34] total human mitochondrial proteins. The actual number of mitochondrial proteins is difficult to determine as these estimations can have a false discovery rate (FDR) of up to 68% [34]. Even with reduced protein complexity in the subcellular proteome, the goal of achieving comprehensive proteome analysis is still challenged by the large variation of protein relative abundances. A capillary ITP (CITP)-based multidimensional separation platform, capable of providing selective analyte enrichment [35–39] and high resolving power toward complex protein/peptide mixtures, is therefore employed in this study for the analysis of synaptic mitochondria isolated from the brains of mice.
2 Materials and methods
2.1 Materials
Fused-silica capillaries (50 µm id/375 µm od and 100 µm id/375 µm od) were acquired from Polymicro Technologies (Phoenix, AZ). Acetic acid, BSA, DTT, ethylene glycol tetra-acetic acid (EGTA), N-2-hydroxyethylpiperazine-N′-2-ethanesulfonic acid (HEPES), iodoacetamide (IAM), mannitol, and sucrose were obtained from Sigma (St. Louis, MO). ACN, hydroxypropylcellulose (average MW 100 000), SDS, Tris, and urea were purchased from Fisher Scientific (Pittsburgh, PA). Pharmalyte 3–10 and Percoll were acquired from Amersham Biosciences (Piscataway, NJ). Sequencing-grade trypsin was obtained from Promega (Madison, WI). All solutions were prepared using water purified by a Nanopure II system (Dubuque, IA) and further filtered with a 0.22 µm membrane (Millipore, Billerica, MA).
2.2 Isolation of synaptic mouse brain mitochondria
Animal experiments were performed in accordance with the Guide for the Care and Use of Laboratory Animals and approved by the University of Maryland Institutional Animal Care and Use Committee. Male (20 g) wild-type C57BL/6 mice were used. Mice were decapitated, and brains were removed and homogenized in ice-cold isolation medium containing 225 mM mannitol, 75 mM sucrose, 5 mM HEPES, and 1 mM EGTA, pH 7.4, at 4°C. As described previously [40], a slightly modified procedure by Dunkley et al. [41] was employed to separate synaptosomes and non-synaptic mitochondria. Briefly, after low-speed spin (1300 × g for 3 min) of the brain homogenate, the supernatant was centrifuged at 21 000 × g for 10 min. The pellet was suspended in 3% Percoll and layered on top of a preformed gradient of 24% (3.5 mL), 15% (2 mL), 10% (1.5 mL) of Percoll and centrifuged at 32 000 × g for 8 min. Nonsynaptic mitochondria sedimented at the bottom of the tube and the synaptosomes accumulated at the interface of 24 and 15% Percoll and also at the interface of 15 and 10% Percoll.
The synaptosomes were collected and the mitochondria were released from synaptosomes using a nitrogen cavitation technique [42, 43]. The suspension was layered onto a preformed gradient of 40% (1.5 mL) and 24% (3.5 mL) Percoll. The mitochondria accumulated at the interface of 40 and 24% Percoll gradient. After the mitochondria fraction was collected and diluted with isolation medium, it was centrifuged to pellet purified synaptic mitochondria. Synaptic mitochondria were suspended in isolation medium containing 1 mg/mL BSA to remove free fatty acid from mitochondrial membranes. The purity of synaptosome and mitochondria isolated from the Percoll gradient was examined with electron microscopy and demonstrated in our previous studies [40–43].
2.3 Mitochondrial sample preparation
After centrifugation at 7500 × g, the mitochondrial pellet was suspended and treated with a solution containing 1% SDS, 50 mM Tris (pH 8.0), and 1 mM DTT. After centrifugation at 20 000 × g for 30 min, the supernatant was collected as the SDS-solubilized mitochondrial proteins. The SDS-solubilized mitochondrial proteins were placed in a dialysis cup and dialyzed overnight at 4°C against 100 mM Tris at pH 8.0. The dialyzed proteins were denatured, reduced, and alkylated by sequentially adding urea, DTT, and IAM with final concentrations of 8 M, 10 mg/mL, and 20 mg/mL, respectively. The solution was incubated at 37°C for 1 h in the dark and then diluted eight-fold with 100 mM ammonium acetate at pH 8.0. Trypsin was added at a 1:40 w/w enzyme to substrate ratio and the solution was incubated at 37°C overnight. Tryptic digests were desalted using a Peptide MacroTrap column (Michrom Bioresources, Auburn, CA), lyophilized to dryness using a SpeedVac (Thermo, San Jose, CA), and then stored at −80°C. Approximately 100–300 µg of mitochondrial proteins were obtained from each of the whole mouse forebrain (brain without the cerebellum).
2.4 Transient CITP/capillary zone electrophoresis-based multidimensional separations
The CITP apparatus was constructed in-house using a CZE 1000R high-voltage power supply (Spellman High-Voltage Electronics, Plainview, NY). An 80-cm long CITP capillary (100 µm id/365 µm od) coated with hydroxypropylcellulose was initially filled with a background electrophoresis buffer of 0.1 M acetic acid at pH 2.8. The sample containing mitochondrial protein digests was prepared in a 2% Pharmalyte solution and was hydrodynamically injected into the capillary. A positive electric voltage of 24 kV was then applied to the inlet reservoir, which was filled with a 0.1 M acetic acid solution.
UV absorbance detection at 214 nm was placed at 14 cm from the cathodic end of the capillary. The cathodic end of the capillary was housed inside a stainless-steel needle using a coaxial liquid sheath flow configuration [44]. A sheath liquid composed of 0.1 M acetic acid was delivered at a flow rate of 1 µL/min using a Harvard Apparatus 22 syringe pump (South Natick, MA). The stacked and resolved peptides in the CITP/CZE capillary were sequentially fractionated and loaded into individual wells on a moving microtiter plate.
To couple transient CITP/CZE with nano-RPLC, peptides collected in individual wells were sequentially injected into individual trap columns (3 cm × 200 µm id × 365 µm od) packed with 5 µm porous C18 particles. Each peptide fraction was subsequently analyzed by nano-RPLC equipped with an Ultimate dual-quaternary pump (Dionex, Sunnyvale, CA) and a dual nanoflow splitter connected to two pulled-tip fused-silica capillaries (50 µm id × 365 µm od). These two 15 cm long capillaries were packed with 3 µm Zorbax Stable Bond (Agilent, Palo Alto, CA) C18 particles.
Nano-RPLC separations were performed in parallel in which a dual-quaternary pump delivered two identical 2 h organic solvent gradients with an offset of 1 h. Peptides were eluted at a flow rate of 200 nL/min using a 5–45% linear ACN gradient over 100 min with the remaining 20 min for column regeneration and equilibration. The peptide eluants were monitored using a linear IT mass spectrometer (LTQ, ThermoFinnigan, San Jose, CA) operated in a data-dependent mode. Full scans were collected from 400 to 1400 m/z and five data-dependent MS/MS scans were collected with dynamic exclusion set to 30 s. A moving stage housing two nano-RPLC columns was employed to provide electrical contacts for applying ESI voltages, and most importantly to position the columns in-line with the ESI inlet at each chromatography separation and data acquisition cycle.
2.5 Data analysis
Raw LTQ data were converted to peak list files by msn_extract. exe (ThermoFinnigan). OMSSA [45] was used to search the peak list files against a decoyed Mus musculus subset of the UniProt sequence library (April 20, 2006). This database was constructed by reversing all 41 178 sequences and appending them to the end of the sequence library. Searches were performed using the following parameters: fully tryptic, 1.5 Da precursor ion mass tolerance, 0.4 Da fragment ion mass tolerance, 1 missed cleavage, alkylated Cys as a fixed modification and variable modification of Met oxidation. Searches were run in parallel on a 12 node, 24 CPU Linux cluster (Linux Networx, Bluffdale, UT).
FDRs were determined using the method of Elias et al. [46]. Briefly, FDRs were calculated by multiplying the number of false positive identifications (hits to the reversed sequences scoring below a given threshold) by 2 and dividing by the number of total identifications. Similar to those described and discussed in our previous work [47], an E-value threshold corresponding to a 1% FDR for total peptide identifications was used as the cutoff in this study.
3 Results and discussion
While CITP has been widely used for analyte preconcentration prior to electrophoretic separation [35–37], the application of CITP to selectively enrich trace amounts of proteins/peptides in complex mixtures presents an untapped strategy for maximizing proteome coverage. As demonstrated in our recent studies [38, 39], such selective enhancement toward low abundance proteins can drastically reduce the range of relative protein abundances and greatly improve the sequence analysis of low-abundance proteins in complex proteomes such as human saliva proteome [39]. Furthermore, on-column transition of CITP to CZE was employed in this study in order to optimize selective analyte enrichment while achieving excellent separation resolution.
To induce transient CITP/CZE separation [36, 38], the mobility of the co-ion of the BGE (0.1 Macetic acid at pH 2.8) was lower than the sample components (tryptic digest of mitochondrial proteins) during the transient CITP step so that it served as the terminating ion. The mitochondrial sample contained an additional co-ion (2% pharmalyte) [48, 49] with high electrophoretic mobility as the leading electrolyte. Under the influence of applied electric field, the higher mobility Pharmalyte ions rushed to the frontal boundary of the sample zone and sample stacked between the leading and terminating electrolytes. Transient CITP was followed by CZE of concentrated peptides in the BGE. Stacked peptides were resolved in CZE based on their differences in electrophoretic mobility.
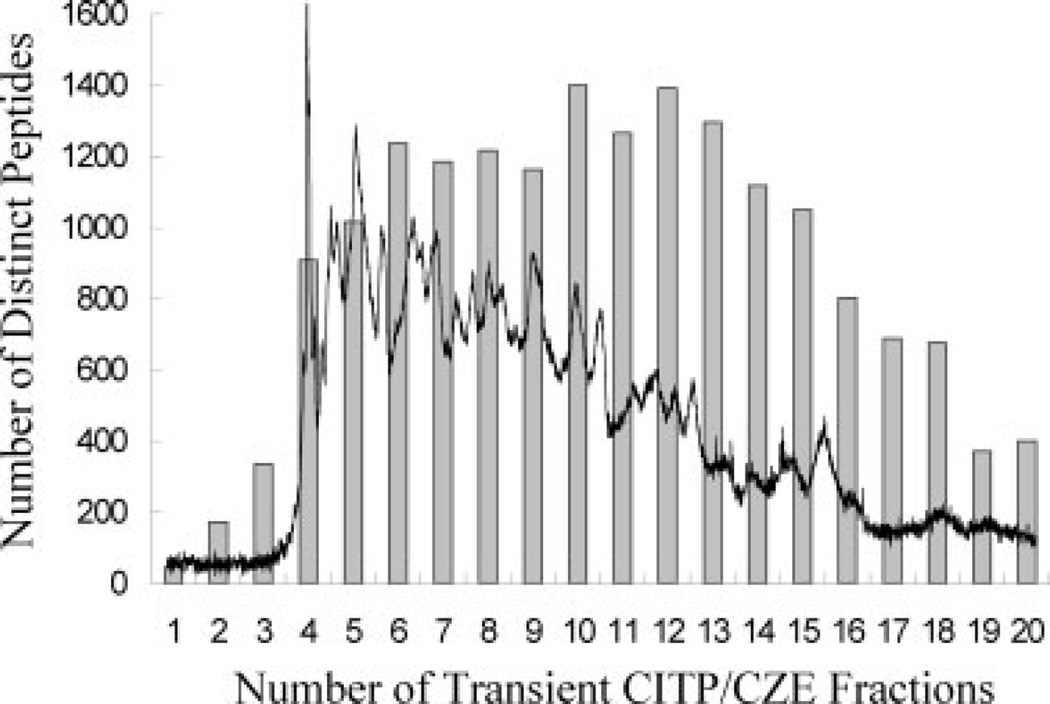
A representative transient CITP/CZE-UV trace is shown in Fig. 1. In all, 20 peptide fractions were sampled from the first dimension of the transient CITP/CZE separation with a total peptide loading of only 15 µg (injected sample volume of 4.0 µL × peptide concentration of 3.75 µg/µL). Each peptide fraction was further resolved by nano-RPLC as the second separation dimension and the chromatography eluants were analyzed using ESI-MS/MS. By using a target-decoy search strategy [46, 47], an E-value threshold of 0.0013, corresponding to 1% FDR of total peptide identifications, was chosen as the cutoff in this study and led to the identification of 12 110 fully tryptic peptides covering 1795 distinct mouse Swiss-Prot protein entries.
Figure 1.
Overlaid plots containing the transient CITP/CZE-UV trace monitored at 214 nm and the number of distinct peptides identified in each of the 20 CITP/CZE fractions.
In this study, MS/MS spectra were searched against a decoyed Mus musculus subset of the UniProt sequence library (April 20, 2006). The UniProt sequence library consists of entries from both Swiss-Prot and TrEMBL. Only protein hits mapping to the Swiss-Prot subset are reported here in order to reduce the redundancy of the protein search results. To highlight the relatively low degree of protein redundancy in the Swiss-Prot database employed in this study, these 1795 distinct mouse protein entries consisted of 1705 nonredundant proteins.
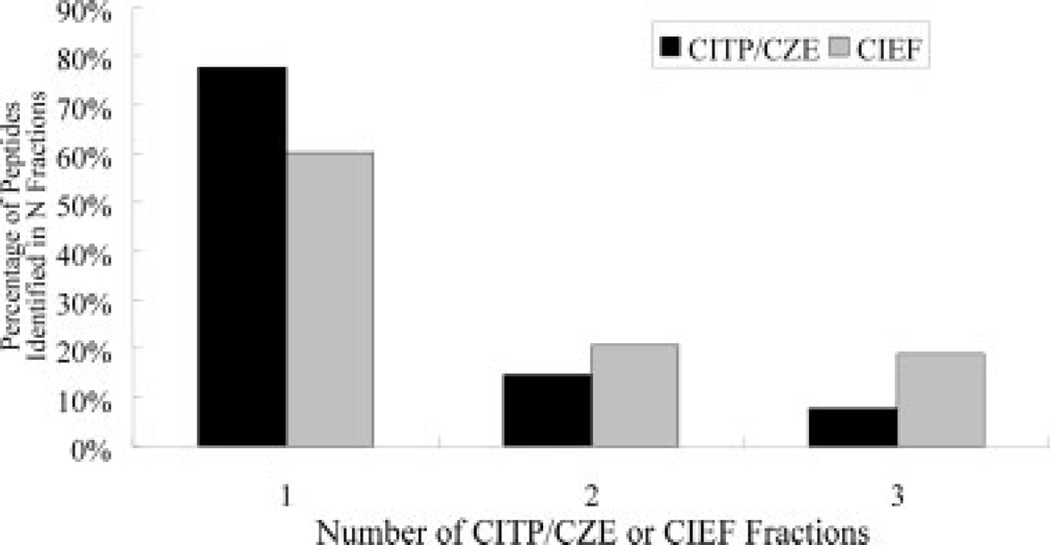
In addition to a representative transient CITP/CZE-UV trace, Fig. 1 also summarizes the number of distinct peptides identified from each of the 20 CITP/CZE fractions. The ultrahigh resolving power of transient CITP/CZE is clearly demonstrated by the large number of distinct peptide identifications measured from each CITP fraction together with significantly low peptide fraction overlapping shown in Fig. 2. For the analysis of tryptic peptides of mitochondrial proteins, approximately 78% of distinct peptides were identified in only a single CITP fraction. Of the remaining peptides, 15% were identified in two fractions and 7% were measured in three and more fractions.
Figure 2.
Degree of peptide overlapping among CITP/CZE or CIEF fractions evaluated as the percentage of peptides identified in one, two, and three fractions.
As shown in Fig. 2, the degree of peptide overlapping among CITP fractions is even lower than that achieved using combined CIEF/nano-RPLC separations [50–53] for the analysis of the same mitochondrial sample. As observed in our previous studies [50–53], the pI of basic peptides may not be well defined and the basic peptides do not focus as tightly as those of acidic counterparts during the CIEP separation. In comparison with the shotgun-based multidimensional LC system [54, 55], a high degree of peptide overlapping was typically observed with 40–80% of carry over peptides that were identified in the previous salt steps in the first dimension of strong-cation-exchange chromatography.
When evaluating the protein sequence coverage by the number of distinct peptides mapping to each mitochondrial protein identification, CITP/CZE similarly achieved superior performance with 1041 proteins (58%) having three or more distinct peptides, 233 (13%) having two distinct peptides, and 521 (29%) having a single distinct peptide. The CIEF-based mitochondrial proteome analysis returned 53% of proteins with three or more distinct peptides, 16% with two distinct peptides, and 31% with single peptide hits. Another measure of proteome data quality includes the ratio of total peptide hits to distinct protein identifications which were 22.4 (40 116 total peptide hits/1795 distinct protein) for the CITP/CZE-based proteome platform. This ratio becomes increasingly important when implementing the spectral counting-based protein quantification approach [56], as the expression levels of each protein are determined by the number of MS/ MS events.
As reported by the common observation in the literature, most false peptide identifications tend to be ones in which the corresponding protein is only identified by a single peptide. Thus, many proteomic research laboratories routinely discard single peptide identifications to significantly reduce the FDR of distinct protein identifications. However, as pointed out by the work of Elias and Gygi [57] and our laboratories [47], these single-protein identifications after filtering are mostly correct and often represent 30–50% of a proteome dataset. The removal of these protein identifications greatly and negatively impacts the coverage and the sensitivity of overall proteome analysis. As advocated by Elias and Gygi [57] and also implemented in this study, the targetdecoy search strategy is employed as the routine practice to design more stringent criteria for single-peptide identifications.
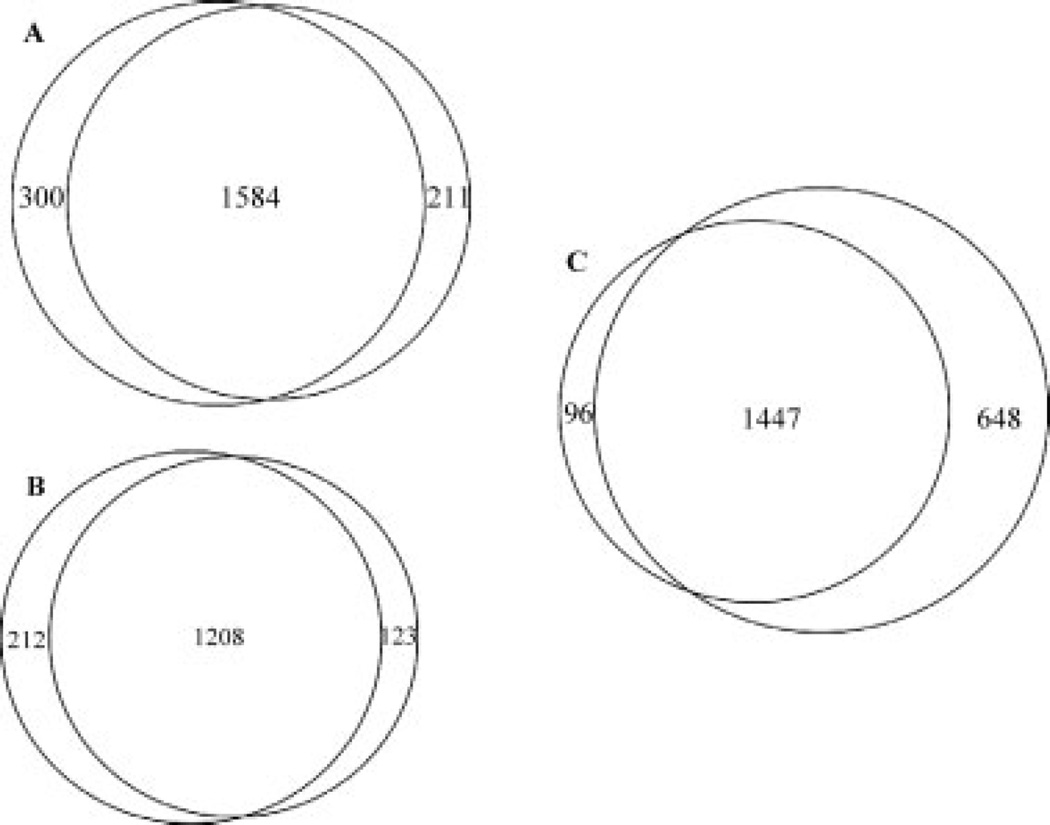
The same protein digest obtained from synaptic mouse brain mitochondria was repeatedly analyzed by both the CITP/CZE and CIEF-based multidimensional separation platforms equipped with ESI-MS/MS. The percentage of overlapping proteins obtained from repeated CITP/CZE-nano-RPLC runs was around 86% as illustrated by the Venn diagram shown in Fig. 3A. A total of 2095 distinct mouse Swiss-Prot protein entries (or 1992 nonredundant proteins) were identified from combined CITP/CZE-nano-RPLC runs of a single mouse brain mitochondria sample. On the other hand, the repeated CIEF-nano-RPLC proteomic studies returned a total of 1543 distinct protein identifications (or 1465 nonredundant proteins) with greater than 87% of protein overlapping among replicates (Fig. 3B). As shown in Fig. 3C, more than 93% of CIEF-cataloged mitochondrial proteins were inclusive in the results of the CITP/CZE proteomic studies. There were 96 and 648 proteins uniquely identified by the CIEF and CITP/CZE-based proteomic platforms, respectively.
Figure 3.
Venn diagrams comparing the mouse mitochondrial proteome results obtained from repeated (A) CITP/CZE and (B) CIEF analyses. (C) Comparing the combined proteomic results obtained from repeated CITP/CZE runs with those achieved by CIEF replicates.
Due to the use of electrokinetic migration/mobilization of charged analytes in transient CITP/CZE, the collected CITP fractions for subsequent nano-RPLC separations are less prone to contamination such as nonionic surfactants or polymers employed during various sample storage and preparation processes. Significant enhancement in the overall peak capacity of the CITP-based proteomic platform can be realized by increasing the number of CITP fractions. The intrinsic high resolution of transient CITP-CZE allows the number of fractions sampled in the first separation dimension to be further increased by simply increasing the number of deposits collected in a microtiter plate. The excellent reproducibility of transient CITP-CZE together with straightforward CITP fractionation using a robust sheath liquid interface [44] enables user discretion as to the number of fractions to be gathered and analyzed, and which interesting fractions may be revisited (reanalyzed) or repeatedly accumulated for the identification of extremely low abundance peptides and proteins.
Combined proteomic results obtained from two CITP/ CZE-nano-RPLC runs of a single mouse brain mitochondria sample (Fig. 3A) were compared to the mitochondrial protein reference set predicted by Maestro [34]. By using a threshold score of 4.69 (corresponding to a 10% FDR), the Maestro reference set contained a list of 1207 mouse mitochondrial proteins. Among these 1207 proteins, a total of 198 proteins were no longer listed in the updated UniProt sequence library (April 20, 2006) and were subtracted from the reference dataset. Combined CITP/CZE analyses covered 59% (598 proteins) and 41% (413 proteins) of the updated Maestro mitochondrial reference set on the basis of proteins identified by a single and at least two distinct peptides, respectively.
In contrast, only 178 out of 1075 mouse brain mitochondrial proteins identified by Kislinger et al. [29] overlapped with the updated Maestro mitochondrial reference set, corresponding to less than 18% coverage. Besides significant increase in the coverage of the Maestro reference set, the ratios of mitochondrial proteins (included in Maestro) to total protein identifications in our proteomic results ranged from 0.26 (413/1571) to 0.29 (598/2095) on the basis of proteins identified by a single and at least two distinct peptides, respectively. These ratios were again higher than 0.16 (178/ 1075) achieved by Kislinger et al. [29].
The combined CITP/CZE and CIEF dataset was compared to the mitochondrial protein reference set of the MitoP2-database [58] containing a list of 731 mouse mitochondrial proteins. Distinct proteins (553 out of 2191; or 2082 nonredundant proteins) presented in this study overlapped with the MitoP2-database, corresponding to 76% mouse mitochondrial proteome coverage. On the other hand, approximately 45% of the proteins identified by Forner et al. [30] (a total of 887 proteins collected from rat tissues of muscle, heart, and liver) had an apparent orthologue against the 2004 mouse MitoP database [59]. The proteomic results of mouse brain mitochondria achieved by Kislinger et al. [29] were also compared to the mitochondrial protein reference set of the MitoP2-database. Only 146 out of 1075 cataloged proteins overlapped with the MitoP2-database, corresponding to less than 20% coverage. It is interesting to note that the entirety of these 146 proteins and 90% of proteins collected from the work of Kislinger et al. [29] were included in the combined CITP/ CZE and CIEF dataset.
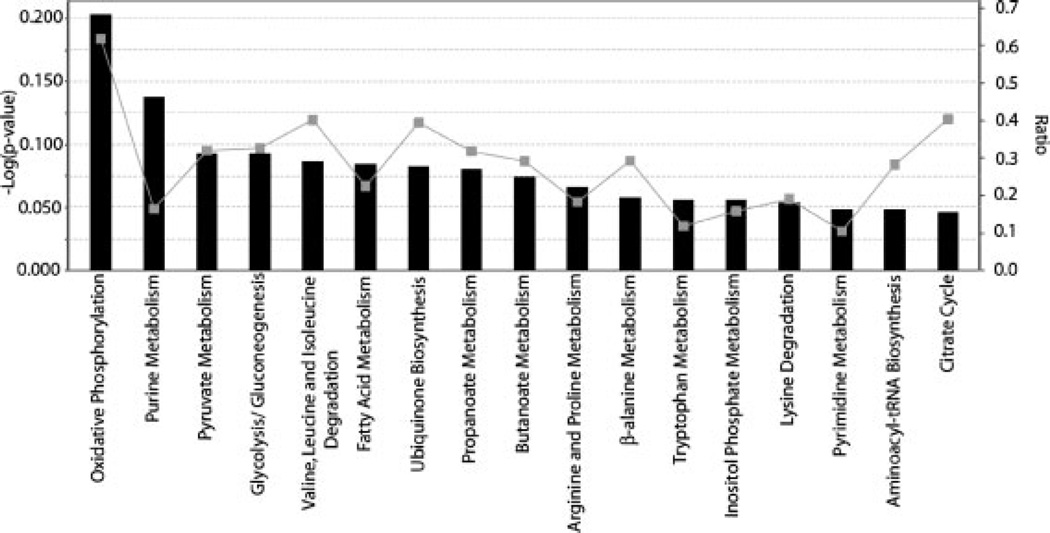
By employing the mitochondrial proteome dataset obtained from combined CITP/CZE and CIEF analyses, the top 17 biosynthetic and metabolic pathways were mapped out by the Ingenuity Pathway Analysis™ and are shown in Fig. 4. The ratio is calculated as the number of proteins in a given pathway which meet cutoff criteria divided by total number of proteins which make up that pathway. The significance value associated with the functional analysis for a dataset is a measure for how likely the proteins from the dataset under investigation participate in that function. The significance is expressed as a p-value, which is calculated using the right-tailed Fisher’s exact test. The p-value is calculated by comparing the number of user-specified proteins of interest that participate in a given function or pathway, relative to the total number of occurrences of these proteins in all functional/pathway annotations stored in the Ingenuity Pathway Knowledge Base.
Figure 4.
Top 17 biosynthetic and metabolic pathways constructed from combined mitochondrial proteome dataset using the Ingenuity Pathway Analysis™. The significance and the ratio of the proteome dataset associated with individual pathways are represented by the bar and the line, respectively.
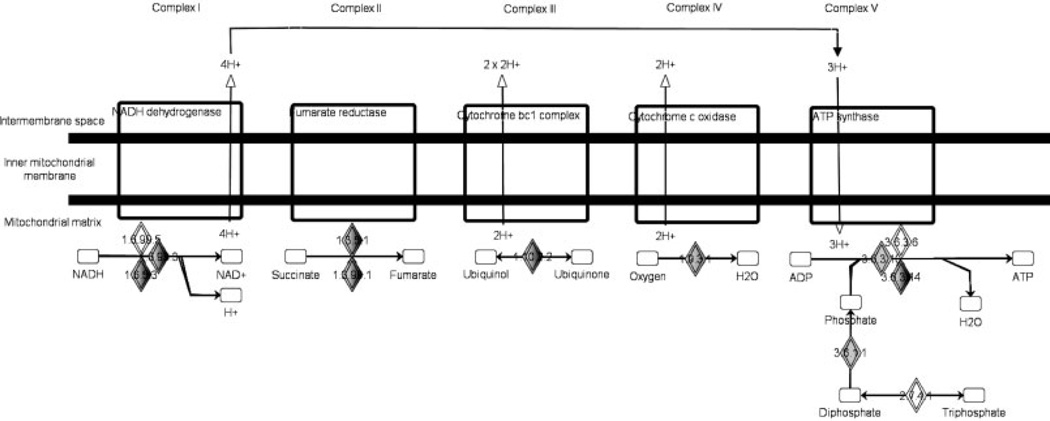
The most significant metabolic pathway revealed by our mitochondrial dataset is clearly the oxidative phosphorylation pathway. As energy producers to sustain the living cell activities, mitochondria constantly convert the glycolysis products, pyruvate, and NADH, into energy in the form of ATP through the cellular respiration process1. In order to generate ATP in the efficient way, mitochondria require numerous transport proteins and enzymes to perform the oxidation reactions of the respiratory chain, the ATP synthesis, and the regulations of metabolites and substance transportations.
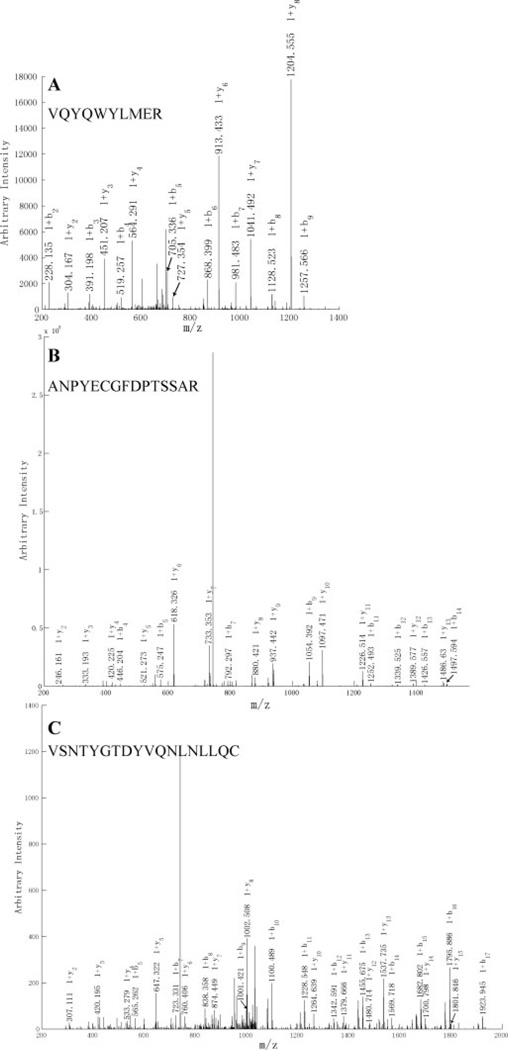
A total of 100 proteins engaged in the oxidative phosphorylation pathway, corresponding to approximately 62% pathway coverage, were identified in this study. Five complexes involved in the oxidative phosphorylation pathway are shown in Fig. 5, including NADH dehydrogenase, fumarate reductase, cytochrome bc1 complex, cytochrome c oxidase, and ATP synthase families. The coverage of different complexes were analyzed as 87% (40:46) for complex I, 80% (4:5) for complex II, 73% (8:11) for complex III, 85% (11:13) for complex IV, and 94% (15:16) for complex V. The overall complex coverage was around 86% (78:91) and higher than 62% pathway coverage. As shown in Fig. 6, MS/MS spectra of single unique peptide hits leading to the identifications of NDUA1, NU3M, and NU4LM as representative subunits of complex I exhibited excellent E-values of 5.8 × 10⁻¹⁰, 6.6 × 10⁻¹², and 8.3 × 10⁻¹⁶, respectively, from a target-decoy OMSSA search.
Figure 5.
Simplified illustration of the oxidative phosphorylation pathway containing five complexes.
Figure 6.
MS/MS spectra of single unique peptide hits leading to the identifications
4 Concluding remarks
Mitochondria are a major source and target of free radicals [2–7], and the collapse of the mitochondrial transmembrane potential can initiate the signaling cascades involved in programmed cell death or apoptosis [1, 60–62]. Mitochondria play a crucial role in the regeneration of antioxidants through the production of reducing equivalents [63], and are responsible for the vast majority of ATP production within most cells and higher organisms1. Mitochondria also infer a major role in cell signaling, as well as biosynthesis (e.g., heme) and degradation (e.g., urea cycle) [64]. Mitochondrial mutations and dysfunction have been implicated in numerous diseases including aging, cancer, heart disease, neurological diseases such as Parkinson, Alzheimer, and Huntington, and various neuromuscular syndromes [6, 65–67]. The mitochondrial connection to these major degenerative diseases has consequently driven significant research efforts to define the mitochondrial proteome and to discover new molecular targets for drug development and therapeutic intervention.
The work presented in this study highlights our continuous efforts toward the development and characterization of electrokinetic-based proteome technologies for mining deeper into complex proteomes such as the mouse mitochondria proteome. Transient CITP/CZE not only contributed to selective enrichment of low abundance peptides/ proteins [38, 39], but also resolved peptides/proteins based on their differences in electrophoretic mobility. The ultrahigh resolving power of transient CITP/CZE was evidenced by the large number of distinct peptide identifications measured from each CITP/CZE fraction and the low peptide fraction overlapping among identified peptides. In addition to selective analyte enrichment, total peak capacity improvements in combined CITP/CZE-nano-RPLC separations greatly increased the number of detected peptides and proteins identified due to better use of the MS dynamic range and reduced discrimination during ionization.
A total of 12 110 fully tryptic peptides were detected at a 1% FDR, leading to the identification of 1795 distinct mouse Swiss-Prot protein entries (or 1705 nonredundant proteins) from a single CITP/CZE-based proteomic study of synaptic mouse brain mitochondria. The reproducibility of protein identifications was evaluated and was found to be around 86% by comparing proteins identified from repeated runs of the same mitochondrial sample. The analysis of the mouse mitochondrial proteome by two CITP/CZE runs led to the detection of 2095 distinct protein entries (or 1992 nonredundant proteins), corresponding to 59% coverage of the updated Maestro mitochondrial reference set. By combining the results obtained from the CITP/CZE and CIEF-based proteomic studies, the collective analysis yielded the identification of 2191 distinct protein entries (or 2082 nonredundant proteins), corresponding to 76% coverage of the MitoP2-database reference set. The increased coverage of mouse mitochondrial proteome further revealed the top 17 biosynthetic and metabolic pathways in synaptic mitochondria isolated from mouse brain using the Ingenuity Pathway Analysis™.
Acknowledgments
This work was supported by NIH grants NS050653 to K. C. and T. K., RR022667, AG 026859 to B. M. B., and GM073723 to C. S. L.
Abbreviations
- FDR
false discovery rate
- IAM
iodoacetamide
- ROS
reactive oxygen species
Footnotes
The authors have declared no conflict of interest.
References
- 1.Green DR, Reed JC. Science. 1998;281:1309–1312. doi: 10.1126/science.281.5381.1309. [DOI] [PubMed] [Google Scholar]
- 2.Lenaz G. Biochim. Biophys. Acta. 1998;1366:53–67. doi: 10.1016/s0005-2728(98)00120-0. [DOI] [PubMed] [Google Scholar]
- 3.Schapira AH. Biochim. Biophys. Acta. 1999;1410:99–102. doi: 10.1016/s0005-2728(98)00160-1. [DOI] [PubMed] [Google Scholar]
- 4.Leonard JV, Schapira AH. Lancet. 2000;355:299–304. doi: 10.1016/s0140-6736(99)05225-3. [DOI] [PubMed] [Google Scholar]
- 5.Melov S. Ann. N. Y. Acad. Sci. 2000;908:219–225. doi: 10.1111/j.1749-6632.2000.tb06649.x. [DOI] [PubMed] [Google Scholar]
- 6.Hirano M, Davidson M, DiMauro S. Curr. Opin. Cardiol. 2001;16:201–210. doi: 10.1097/00001573-200105000-00008. [DOI] [PubMed] [Google Scholar]
- 7.Lopez MF, Melov S. Circ. Res. 2002;90:380–389. doi: 10.1161/hh0402.105757. [DOI] [PubMed] [Google Scholar]
- 8.Boveris A, Cadenas E, Stoppani AOM. Biochem. J. 1976;156:435–444. doi: 10.1042/bj1560435. [DOI] [PMC free article] [PubMed] [Google Scholar]
- 9.Raha S, McEachern GE, Myint AT, Robinson BH. Free Radic. Biol. Med. 2000;29:170–180. doi: 10.1016/s0891-5849(00)00338-5. [DOI] [PubMed] [Google Scholar]
- 10.Harman DJ. Am. Geriatr. Soc. 1972;20:145–147. doi: 10.1111/j.1532-5415.1972.tb00787.x. [DOI] [PubMed] [Google Scholar]
- 11.Chang J, Van Remmen H, Cornell J, Richardson A, Ward WF. Mech. Aging Dev. 2003;124:33–41. doi: 10.1016/s0047-6374(02)00167-7. [DOI] [PubMed] [Google Scholar]
- 12.Lithgow T. FEBS Lett. 2000;476:22–26. doi: 10.1016/s0014-5793(00)01663-x. [DOI] [PubMed] [Google Scholar]
- 13.Koehler CM. FEBS Lett. 2000;476:27–31. doi: 10.1016/s0014-5793(00)01664-1. [DOI] [PubMed] [Google Scholar]
- 14.McDonald TG, Van Eyk JE. Basic Res. Cardiol. 2003;98:219–227. doi: 10.1007/s00395-003-0417-8. [DOI] [PubMed] [Google Scholar]
- 15.Lopez MF, Kristal BS, Chernokalskays E, Lazarev A, et al. Electrophoresis. 2000;21:3427–3440. doi: 10.1002/1522-2683(20001001)21:16<3427::AID-ELPS3427>3.0.CO;2-L. [DOI] [PubMed] [Google Scholar]
- 16.Hanson BJ, Schulenberg B, Patton WF, Capaldi RA. Electrophoresis. 2001;22:950–959. doi: 10.1002/1522-2683()22:5<950::AID-ELPS950>3.0.CO;2-D. [DOI] [PubMed] [Google Scholar]
- 17.Sickmann A, Reinders J, Wagner Y, Joppich C, et al. Proc. Natl. Acad. Sci. USA. 2003;100:13207–13212. doi: 10.1073/pnas.2135385100. [DOI] [PMC free article] [PubMed] [Google Scholar]
- 18.Reinders J, Zahedi RP, Pfanner N, Meisinger C, Sickmann A. J. Proteome Res. 2006;5:1543–1554. doi: 10.1021/pr050477f. [DOI] [PubMed] [Google Scholar]
- 19.McDonald T, Sheng S, Stanley B, Chen D, et al. Mol. Cell. Proteomics. 2006;5:2392–2411. doi: 10.1074/mcp.T500036-MCP200. [DOI] [PubMed] [Google Scholar]
- 20.Pflieger D, Le Caer J-P, Lemaire C, Bernard BA, et al. Anal. Chem. 2002;74:2400–2406. doi: 10.1021/ac011295h. [DOI] [PubMed] [Google Scholar]
- 21.Taylor SW, Warnock DE, Glenn GM, Zhang B, et al. J. Proteome Res. 2002;1:451–458. doi: 10.1021/pr025533g. [DOI] [PubMed] [Google Scholar]
- 22.Taylor SW, Fahy E, Zhang B, Glenn GM, et al. Nat. Biotechnol. 2003;21:281–286. doi: 10.1038/nbt793. [DOI] [PubMed] [Google Scholar]
- 23.Mootha VK, Bunkenborg J, Olsen JV, Hjerrild M, et al. Cell. 2003;115:629–640. doi: 10.1016/s0092-8674(03)00926-7. [DOI] [PubMed] [Google Scholar]
- 24.Gaucher SP, Taylor SW, Fahy E, Zhang B, et al. J. Proteome Res. 2004;3:495–505. doi: 10.1021/pr034102a. [DOI] [PubMed] [Google Scholar]
- 25.Prokisch H, Scharfe C, Camp DG, II, Xiao W. PLoS Biol. 2004;2:e160. doi: 10.1371/journal.pbio.0020160. [DOI] [PMC free article] [PubMed] [Google Scholar]
- 26.Arnold RJ, Hrncirova P, Annaiah K, Novotny MV. J. Proteome Res. 2004;3:653–657. doi: 10.1021/pr034110r. [DOI] [PubMed] [Google Scholar]
- 27.Rezaul K, Wu L, Mayya V, Hwang SI, Han D. Mol. Cell. Proteomics. 2005;4:169–181. doi: 10.1074/mcp.M400115-MCP200. [DOI] [PMC free article] [PubMed] [Google Scholar]
- 28.Jiang XS, Dai J, Sheng QH, Zhang L, et al. Mol. Cell. Proteomics. 2005;4:12–34. doi: 10.1074/mcp.M400079-MCP200. [DOI] [PubMed] [Google Scholar]
- 29.Kislinger T, Cox B, Kannan A, Chung C, et al. Cell. 2006;125:173–186. doi: 10.1016/j.cell.2006.01.044. [DOI] [PubMed] [Google Scholar]
- 30.Forner F, Foster LJ, Campanaro S, Valle G, Mann M. Mol. Cell. Proteomics. 2006;5:608–619. doi: 10.1074/mcp.M500298-MCP200. [DOI] [PubMed] [Google Scholar]
- 31.Johnson DT, Harris RA, French S, Blair PV, et al. Am. J. Physiol. Cell Physiol. 2007;292:C698–C707. doi: 10.1152/ajpcell.00109.2006. [DOI] [PubMed] [Google Scholar]
- 32.DiMauro S, Schon EA. Nat. Genet. 1998;19:214–215. doi: 10.1038/883. [DOI] [PubMed] [Google Scholar]
- 33.Taylor SW, Fahy E, Ghosh SS. Trends Biotechnol. 2003;21:82–88. doi: 10.1016/S0167-7799(02)00037-9. [DOI] [PubMed] [Google Scholar]
- 34.Calvo S, Mohit J, Xie X, Sheth SA, et al. Nat. Genet. 2006;38:576–582. doi: 10.1038/ng1776. [DOI] [PubMed] [Google Scholar]
- 35.Stegehuis DS, Irth H, Tjaden UR, Van Der Greef J. J. Chromatogr. 1991;538:393–402. doi: 10.1016/s0021-9673(01)88860-9. [DOI] [PubMed] [Google Scholar]
- 36.Foret F, Szoko E, Karger BL. Electrophoresis. 1993;14:417–428. doi: 10.1002/elps.1150140167. [DOI] [PubMed] [Google Scholar]
- 37.Gebauer P, Boček P. Electrophoresis. 2000;21:3898–3904. doi: 10.1002/1522-2683(200012)21:18<3898::AID-ELPS3898>3.0.CO;2-B. [DOI] [PubMed] [Google Scholar]
- 38.An Y, Cooper JW, Balgley BM, Lee CS. Electrophoresis. 2006;27:3599–3608. doi: 10.1002/elps.200600093. [DOI] [PubMed] [Google Scholar]
- 39.Fang X, Yang L, Wang W, Song T, et al. Anal. Chem. 2007;79:5785–5792. doi: 10.1021/ac070611a. [DOI] [PubMed] [Google Scholar]
- 40.Chandrasekaran K, Hazelton JL, Wang Y, Fiskum G, Kristian T. J. Neurosci. 2006;26:13123–13127. doi: 10.1523/JNEUROSCI.4191-06.2006. [DOI] [PMC free article] [PubMed] [Google Scholar]
- 41.Dunkley PR, Heath JW, Harrison SM, Jarvie PE, et al. Brain Res. 1988;441:59–71. doi: 10.1016/0006-8993(88)91383-2. [DOI] [PubMed] [Google Scholar]
- 42.Brown MR, Sullivan PG, Dorenbos KA, Modafferi EA, et al. J. Neurosci. Methods. 2004;137:299–303. doi: 10.1016/j.jneumeth.2004.02.028. [DOI] [PubMed] [Google Scholar]
- 43.Kristian T, Hopkins IB, McKenna MC, Fiskum G. J. Neurosci. Methods. 2006;152:136–143. doi: 10.1016/j.jneumeth.2005.08.018. [DOI] [PMC free article] [PubMed] [Google Scholar]
- 44.Yang L, Lee CS, Hofstadler SA, Pasa-Tolic L, Smith RD. Anal. Chem. 1998;70:3235–3241. doi: 10.1021/ac980224o. [DOI] [PubMed] [Google Scholar]
- 45.Geer LY, Markey SP, Kowalak JA, Wagner L, et al. J. Proteome Res. 2004;3:958–964. doi: 10.1021/pr0499491. [DOI] [PubMed] [Google Scholar]
- 46.Elias JE, Haas W, Faherty BK, Gygi SP. Nat. Methods. 2005;2:667–675. doi: 10.1038/nmeth785. [DOI] [PubMed] [Google Scholar]
- 47.Balgley BM, Laudeman T, Yang L, Song T, Lee CS. Mol. Cell. Proteomics. 2007;6:1599–1608. doi: 10.1074/mcp.M600469-MCP200. [DOI] [PubMed] [Google Scholar]
- 48.Mohan D, Shen Y, Smith RD, Lee CS. Electrophoresis. 2002;23:3160–3167. doi: 10.1002/1522-2683(200209)23:18<3160::AID-ELPS3160>3.0.CO;2-L. [DOI] [PubMed] [Google Scholar]
- 49.Mohan D, Pasa-Tolic L, Masselon CD, Tolic N, et al. Anal. Chem. 2003;75:4432–4440. doi: 10.1021/ac0342572. [DOI] [PubMed] [Google Scholar]
- 50.Chen J, Balgley BM, DeVoe DL, Lee CS. Anal. Chem. 2003;75:3145–3152. doi: 10.1021/ac034014+. [DOI] [PubMed] [Google Scholar]
- 51.Wang Y, Rudnick PA, Evans EL, Zhuang Z, et al. Anal. Chem. 2005;77:6549–6556. doi: 10.1021/ac050491b. [DOI] [PubMed] [Google Scholar]
- 52.Guo T, Rudnick PA, Wang W, Lee CS, et al. J. Proteome Res. 2006;5:1469–1478. doi: 10.1021/pr060065m. [DOI] [PubMed] [Google Scholar]
- 53.Wang W, Guo T, Rudnick PA, Song T, et al. Anal. Chem. 2007;79:1002–1009. doi: 10.1021/ac061613i. [DOI] [PubMed] [Google Scholar]
- 54.Wolters DA, Washburn MP, Yates JR., III Anal. Chem. 2001;73:5683–5690. doi: 10.1021/ac010617e. [DOI] [PubMed] [Google Scholar]
- 55.Motoyama A, Venable JD, Ruse CI, Yates JR., III Anal. Chem. 2006;78:5109–5118. doi: 10.1021/ac060354u. [DOI] [PubMed] [Google Scholar]
- 56.Liu H, Sadygov RG, Yates JR., III Anal. Chem. 2004;76:4193–4201. doi: 10.1021/ac0498563. [DOI] [PubMed] [Google Scholar]
- 57.Elias JE, Gygi SP. Nat. Methods. 2007;4:207–214. doi: 10.1038/nmeth1019. [DOI] [PubMed] [Google Scholar]
- 58.Prokisch H, Andreoli C, Ahting U, Heiss K, et al. Nucleic Acids Res. 2006;34:D705–D711. doi: 10.1093/nar/gkj127. [DOI] [PMC free article] [PubMed] [Google Scholar]
- 59.Andreoli C, Prokisch H, Hortnagel K, Mueller JC, et al. Nucleic Acids Res. 2004;32:D459–D462. doi: 10.1093/nar/gkh137. [DOI] [PMC free article] [PubMed] [Google Scholar]
- 60.Kuwana T, Smith JJ, Muzio M, Dixit V, et al. J. Biol. Chem. 1998;273:16589–16594. doi: 10.1074/jbc.273.26.16589. [DOI] [PubMed] [Google Scholar]
- 61.Susin SA, Lorenzo HK, Zamzami NI, Marzo A, et al. Nature. 1999;397:441–446. doi: 10.1038/17135. [DOI] [PubMed] [Google Scholar]
- 62.Nicholls DG, Budd SL. Physiol. Rev. 2000;80:315–360. doi: 10.1152/physrev.2000.80.1.315. [DOI] [PubMed] [Google Scholar]
- 63.Kagan VE, Tyurina YY. Ann. NY. Acad. Sci. 1998;854:425–434. doi: 10.1111/j.1749-6632.1998.tb09921.x. [DOI] [PubMed] [Google Scholar]
- 64.Gunter TE, Buntinas L, Sparagna GC, Gunter KK. Biochim. Biophys. Acta. 1998;1366:5–15. doi: 10.1016/s0005-2728(98)00117-0. [DOI] [PubMed] [Google Scholar]
- 65.Beckman KB, Ames BN. Physiol. Rev. 1998;78:547–581. doi: 10.1152/physrev.1998.78.2.547. [DOI] [PubMed] [Google Scholar]
- 66.Kovacic P, Jacintho JD. Curr. Med. Chem. 2001;8:773–796. doi: 10.2174/0929867013373084. [DOI] [PubMed] [Google Scholar]
- 67.Verma M, Kagan J, Sidransky D, Srivastava S. Nat. Rev. Cancer. 2003;3:789–795. doi: 10.1038/nrc1192. [DOI] [PubMed] [Google Scholar]


