Significance
The bromodomain and extraterminal domain (BET) proteins regulate transcription of subset-specifying genes during lineage-specific T-helper-cell differentiation in adaptor immunity and are also implicated in inflammatory disorders. The available pan-BET bromodomain inhibitors such as JQ1 indiscriminately block the tandem bromodomains (BD1 and BD2) of the BET proteins, broadly render differentiation of different Th subsets, and have limited therapeutic potential. Here we report a small molecule, MS402, that can selectively inhibit BD1 over BD2 of the BET proteins and block Th17 maturation from mouse naive CD4+ T cells, with limited or no effects on Th1, Th2, or Treg cells. MS402 effectively prevents and ameliorates T-cell transfer-induced colitis in mice by disrupting Th17 cell development, thus representing a therapeutic approach for inflammatory bowel diseases.
Keywords: Th17 cell differentiation, gene transcription, Brd4, bromodomain, chemical inhibitor
Abstract
T-helper 17 (Th17) cells have important functions in adaptor immunity and have also been implicated in inflammatory disorders. The bromodomain and extraterminal domain (BET) family proteins regulate gene transcription during lineage-specific differentiation of naïve CD4+ T cells to produce mature T-helper cells. Inhibition of acetyl-lysine binding of the BET proteins by pan-BET bromodomain (BrD) inhibitors, such as JQ1, broadly affects differentiation of Th17, Th1, and Th2 cells that have distinct immune functions, thus limiting their therapeutic potential. Whether these BET proteins represent viable new epigenetic drug targets for inflammatory disorders has remained an unanswered question. In this study, we report that selective inhibition of the first bromodomain of BET proteins with our newly designed small molecule MS402 inhibits primarily Th17 cell differentiation with a little or almost no effect on Th1 or Th2 and Treg cells. MS402 preferentially renders Brd4 binding to Th17 signature gene loci over those of housekeeping genes and reduces Brd4 recruitment of p-TEFb to phosphorylate and activate RNA polymerase II for transcription elongation. We further show that MS402 prevents and ameliorates T-cell transfer-induced colitis in mice by blocking Th17 cell overdevelopment. Thus, selective pharmacological modulation of individual bromodomains likely represents a strategy for treatment of inflammatory bowel diseases.
CD4+ T cells are important immune cells in biology and have been implicated in the pathology of autoimmune diseases and cancer (1–5). They develop in thymus to different T-helper (Th) cells to guide immune effector functions (6). The known Th effector subsets including Th1, Th2, Th17, and Treg produce signature genes and perform different immune functions (7, 8). Particularly, Th17 cells produce IL-17a and IL-17f and protect mucosa from bacterial and fungal infection (9, 10). Th17 cell development is linked to inflammatory disorders including multiple sclerosis, rheumatoid arthritis, and inflammatory bowel disease (11–13).
Lineage-specific differentiation of naïve CD4+ T cells to Th17 cells is tightly controlled by gene transcription in chromatin (14–16)—a complex process that involves collective activities of key transcription factors Stat3, Batf, and Irf4, as well as Th17-specific orphan nuclear receptor RORγT (17–20). These transcription factors work with chromatin modifying enzymes and effector proteins to ensure proper timing, duration, and amplitude for ordered gene transcription in Th17 cell differentiation (15, 21). Of these are a family of bromodomain (BrD) and extraterminal domain (BET) proteins consisting of Brd2, Brd3, Brd4, and testis-specific Brdt (22, 23). BET proteins play a multifaceted role in gene transcription through their tandem bromodomains binding to lysine-acetylated histones and transcription factors during chromatin opening, transcription factor recruitment to target gene promoter and enhancer sites, and activation of paused RNA polymerase II (PolII) transcriptional machinery for productive gene activation (24, 25). Consistent with their role in T-helper-cell differentiation (26), inhibition of acetyl-lysine binding of the BET proteins by pan-BET BrD inhibitors, such as JQ1, affects differentiation of not only Th17 but also of Th1 and Th2 cells (27, 28). Because of such broad activities, unfortunately, pan-BET BrD inhibitors are thought to have limited therapeutic potential. Whether these BET proteins represent viable new epigenetic drug targets for inflammatory disorders has remained an unanswered question to this day.
Growing evidence shows that the two BrDs of BET proteins have distinct functions in gene transcription in that the second BrD (BD2) of Brd4 is dedicated to interaction with lysine-acetylated transcription factors and p-TEFb, whereas the first BrD (BD1) functions to anchor the activated Brd4/transcription protein complex to target genes in chromatin through binding to lysine-acetylated histone H4 (26, 29). We sought to investigate how selective BET BrD inhibition modulates gene transcription in lineage-specific differentiation of different Th subsets. In this study, we have developed a BD1-selective BET BrD inhibitor, MS402, and showed that it can selectively render differentiation of Th17 cells over other Th cells from murine primary naïve CD4+ T cells. We further demonstrated the therapeutic potential of MS402 in preventing and ameliorating adaptive T-cell transfer-induced colitis in mice through the disruption of Brd4 functions in gene transcription and Th17 cell development.
Results and Discussion
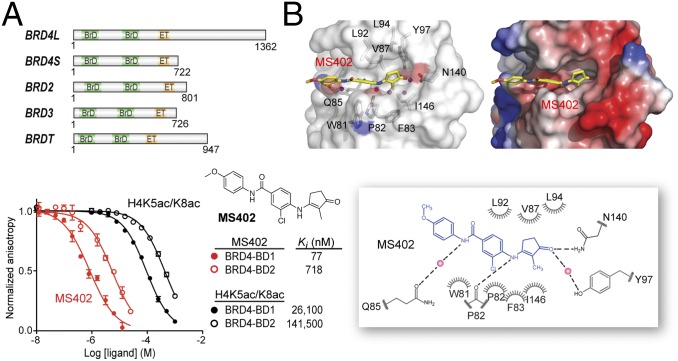
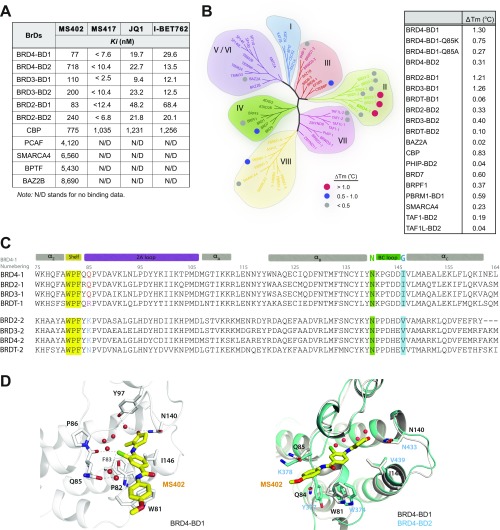
Given that the BD1 of the BET proteins is dedicated for binding to lysine-acetylated histone H4 for gene transcriptional activation (30), we reasoned that a small molecule that selectively targets the BD1 could effectively block BET functions in gene activation in chromatin. Using structure-guided design, we developed a cyclopentanone-based BrD inhibitor, MS402 (see its synthesis in Scheme S1), that displays nanomolar inhibitory activity against the BD1 (Ki of 77 nM) with a ninefold selectivity over BD2 of BRD4 (Fig. 1A). This selectivity is consistently seen with the BrDs of BRD2 or BRD3, albeit to a lesser extent (Fig. S1A). The BrD of CREB-binding protein (CBP) binds MS402 with Ki of 775 nM, 10-fold weaker than BRD4-BD1, and other representative BrDs from different subgroups of the BrD family including PCAF, SMARCA4, BPTF, and BAZ2B show very weak binding to MS402 with 50-fold or more less affinity than BRD4-BD1 (Fig. S1 A and B). MS402 is 200–300 times more potent than K5ac/K8ac-di-acetylated H4 peptide in binding to BRD4 BrDs (Fig. 1A).
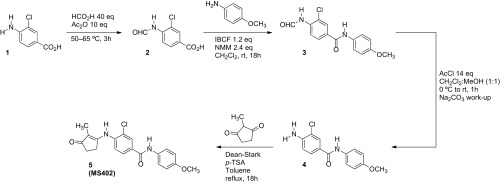
Scheme S1.
Synthetic scheme of MS402.
Fig. 1.
Structure-guided development of MS402, a BD1-selective BET BrD inhibitor. (A) (Upper) Domain organization of mammalian BET family proteins. (Lower) Binding affinity of MS402 or an H4K5ac/K8ac peptide (residues 1–13) to the BrDs of BRD4 as measured in a fluorescence anisotropy binding assay using an FITC-labeled BrD inhibitor as a probe. (B) (Left) The crystal structure of MS402 (yellow) bound to the BRD4-BD1. (Right) Electrostatic potential surface representation of the BRD4-BD1/MS402 complex. Side chains of key residues at the ligand-binding site in the protein are shown, and bound water molecules are depicted as red spheres. (Lower) Schematic diagram highlights key interactions in MS402 recognition by the BRD4-BD1. Two key water molecules are shown in magenta spheres, and hydrogen bonds are drawn as dashed lines. The figure was generated using LIGPLOT (43).
Fig. S1.
MS402, a BD1-selective BET bromodomain inhibitor. (A) Binding affinity of MS402 to BrDs that represent different subgroups of the human BrD family, as determined in a fluorescence anisotropy assay. See experimental details in SI Materials and Methods. (B) Characterization of MS402 binding to representative human BrDs, as assessed by measuring protein thermal stability with and without the presence of the chemical ligand. The results are depicted in the phylogenetic tree of the human BrD family with dots that are color-coded for high affinity (red), modest affinity (blue), or low or no binding (gray). PCAF is also known as histone acetyltransferase KAT2B. (C) Sequence alignment of BET-BD1 and BD2 using the UniProt database and the PROMALS3D server. The conserved Asn and the gatekeeper residue in αC are highlighted with green and blue background, respectively. The WPF shelf residues are highlighted in yellow and the key residue Gln85 is colored in red for BRD4-BD1 and its counterpart Lys in BRD4-BD2 is in blue. (D) (Left) A detailed view of the polar interactions engaged by MS402 with binding site residues of BRD4-BD1. Hydrogen bonds are shown by dashed lines. (Right) Superimposition of MS402 bound to BRD4-BD1 (5E87, colored in white) with BRD4-BD2 (2YEM, colored in cyan).
Our 1.5-Å-resolution crystal structure of the BRD4 BD1 revealed that MS402 is bound across the ZA channel, establishing interactions with Val87, Leu92, and Leu94 on one side and Trp81, Pro82, Phe83, and Ile146 on the other (Fig. 1B and Table S1). The carbonyl oxygen of its cyclopentanone moiety forms two key hydrogen bonds, one with the side-chain amide of the conserved Asn140 and the other mediated by a bound water molecule to the phenoxyl group of Tyr97. In addition, this moiety makes van der Waals contacts with a gatekeeper residue Ile146. The amino group connecting cyclopentanone and chlorobenzene forms another hydrogen bond to the backbone carbonyl oxygen of Pro82 of the WPF shelf. Further, the amide nitrogen linking the two aromatic rings of MS402 forms a water-mediated hydrogen bond to the side-chain carbonyl oxygen of Gln85. The latter is unique in the BD1, corresponding to a Lys in the BD2 that is not engaged in hydrogen bond binding to MS402 as does Gln85 in BD1; point mutation of Gln85 to a Lys or Ala nearly abolished the preferred MS402 binding by BD1 over BD2 (Fig. S1 B–D). Further, change of Ile146 in BD1 to smaller Val439 in BD2 likely weakens van der Waals contacts between the protein and cyclopentanone, thus explaining MS402 selectivity for the BD1 over BD2 of BRD4.
Table S1.
Crystallography data and refinement statistics of the BRD4-BD1/MS402 complex structure
| Parameters | BRD4-BD1/MS402 |
| Data collection | |
| Space group | P32 |
| Cell dimensions | |
| a, b, c, Å | 47.66, 47.66, 124.21 |
| α, β, γ , ° | 90, 90, 120 |
| Resolution, Å (highest-resolution shell) | 23.8–1.5 (1.54–1.5) |
| Measured reflections | 276,330 |
| Unique reflections | 48,479 |
| Rmerge | 6.0 (43.9) |
| I/σ | 40.1 (3.1) |
| Completeness, % | 96.3 (90.9) |
| Redundancy | 5.7 (5.6) |
| Refinement | |
| Resolution, Å | 23.8–1.5 |
| No. of reflections | 45,565 |
| Rwork/ Rfree, % | 14.1/18.1 |
| No. of atoms | |
| Protein | 1,043 |
| Compound | 26 |
| Water | 217 |
| B-factors, Å2 | |
| Protein | 20.2 |
| Compound | 17.6 |
| Water | 40.6 |
| Rmsd | |
| Bond lengths, Å | 0.021 |
| Bond angles, ° | 1.97 |
| Ramachandran plot, % residues | |
| Favored | 99.2 |
| Additional allowed | 0.8 |
| Generously allowed | 0 |
| Disallowed | 0 |
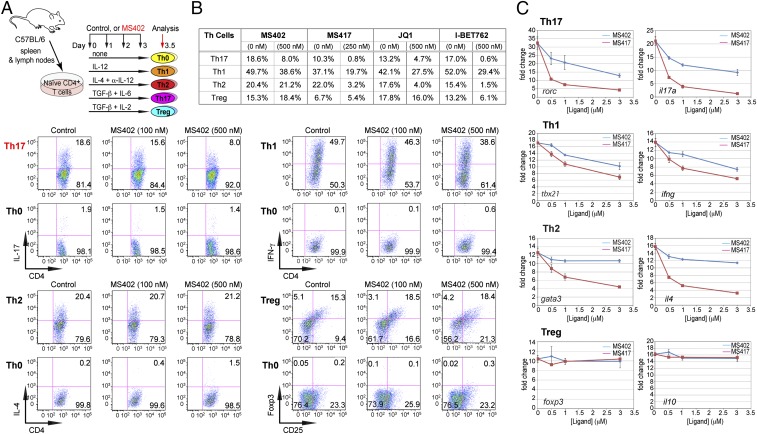
To study the role of BET proteins in Th cell differentiation we isolated murine primary naïve CD4+ T cells from mouse spleen and lymph nodes and treated them with IL-12, IL-4 plus α-IL-12, TGF-β plus IL-6, or TGF-β plus IL-2, respectively, to promote Th1, Th2, Th17, or Treg linage-specific differentiation over 3.5 d with or without MS402 added daily to cell culture (Fig. 2A). Strikingly, as shown by flow cytometry analysis, MS402, in a dose-dependent manner, inhibited IL-17 release from 18.6 to 8.0% in the Th17 polarizing condition and to a lesser extent IFN-γ production from 49.7 to 38.6% in the Th1 condition; it had little, if any, effect on IL-4 and Foxp3 expression during Th2 and Treg cell differentiation, respectively (Fig. 2B). MS402 did not affect T-cell proliferation as assessed in a carboxy-fluorescein succinimidyl ester dilution assay (Fig. S2A).
Fig. 2.
MS402, a bromodomain inhibitor, renders Th17 cell differentiation. (A) (Upper) A schematic illustration of the T-helper-cell differentiation study. (Lower) Flow cytometry analysis of mouse primary naïve CD4+ T cells purified from spleens and lymph nodes of C57BL/6 mice and differentiated under Th0, Th1, Th2, Th17, and Treg polarization conditions with and without the presence of MS402 added daily at 100 nM or 500 nM. (B) Table summarizing the effects of MS402 or pan-BET BrD inhibitors including MS417, JQ1, and I-BET762 on T-helper-cell differentiation. (C) Effects of MS402 or MS417 treatment on mRNA expression levels of key Th17, Th1, Th2, or Treg subset-specific signature genes (transcription factors and cytokines) after 3-d lineage-specific cell differentiation from mouse primary naïve CD4+ T cells in a dose-dependent manner.
Fig. S2.
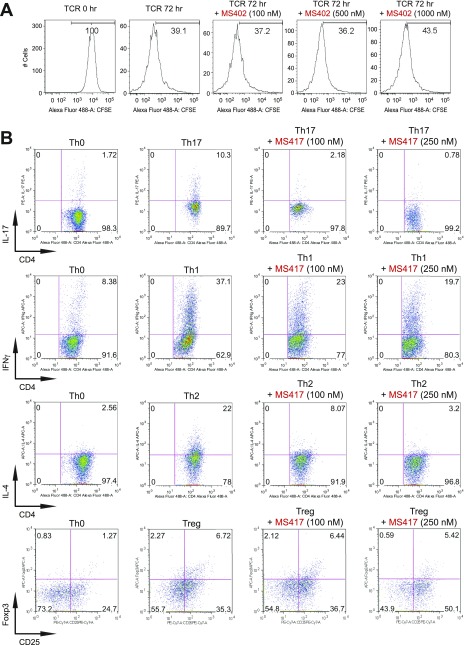
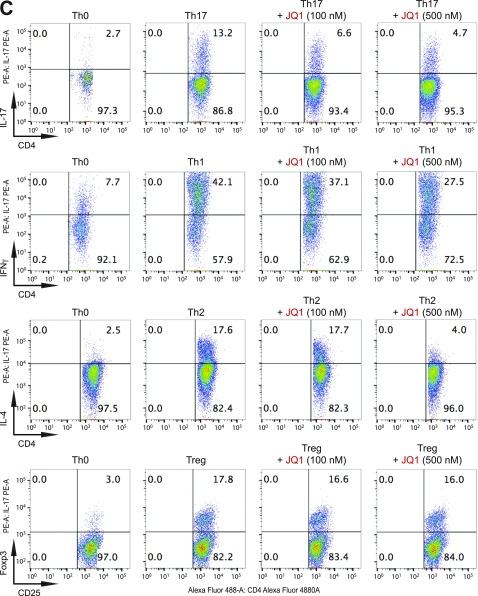
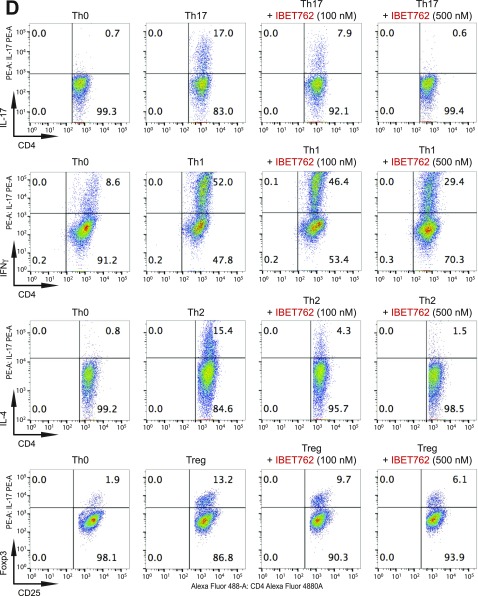
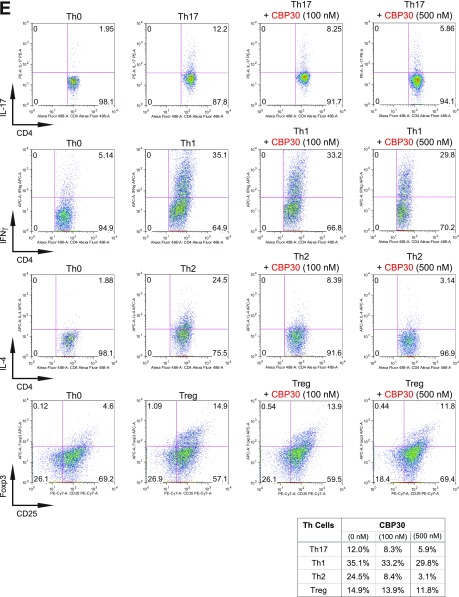
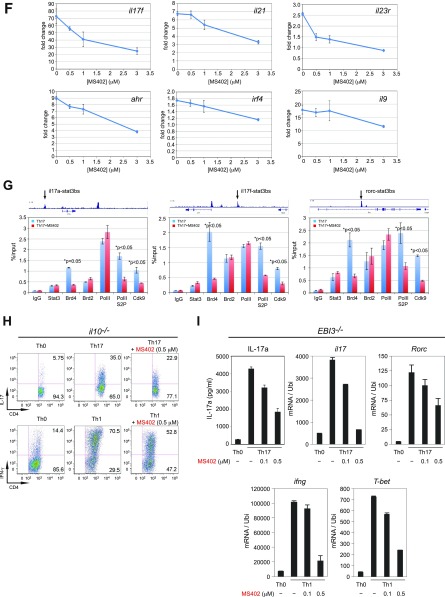
BET proteins control gene transcriptional programs in cell differentiation of T-helper cells. (A) Naive CD4+ T cells isolated from spleen and lymph nodes and stimulated to proliferate with plant-bound anti-CD3 plus anti-CD28 for 72 h under different concentrations of MS402. (B) Flow cytometry analysis of mouse primary naïve CD4+ T cells purified from spleens and lymph nodes of C57BL/6 mice and differentiated under Th0, Th1, and Th17 polarization conditions after 3 d with and without MS417 added daily at 100 nM or 250 nM. (C) Flow cytometry analysis of mouse primary naïve CD4+ T cells purified from spleens and lymph nodes of C57BL/6 mice and differentiated under Th0, Th1, and Th17 polarization conditions after 3 d with and without JQ1 added daily at 100 nM or 500 nM. (D) Flow cytometry analysis of mouse primary naïve CD4+ T cells purified from spleens and lymph nodes of C57BL/6 mice and differentiated under Th0, Th1, and Th17 polarization conditions after 3 d with and without IBET762 added daily at 100 nM or 500 nM. (E) Flow cytometry analysis of mouse primary naïve CD4+ T cells purified from spleens and lymph nodes of C57BL/6 mice and differentiated under Th0, Th1 and Th17 polarization conditions after 3 d with and without a selective CBP BrD inhibitor, SGC-CBP30 added daily at 100 nM or 500 nM. (F) Effects of MS402 treatment on mRNA expression levels of additional Th17-specifying transcription factors and cytokines after 3-d Th17-specific cell differentiation from mouse primary naïve CD4+ T cells in a dose-dependent manner. (G) ChIP-seq tracks of Stat3 on il17a-f and rorc gene loci in Th17 cells (Upper) and ChIP-qPCR analysis of Stat3, Brd4, Brd2, PolII, PolIIS2P, and Cdk9 in Th17 cells treated with and without MS402 (3 μM) (Lower). Statistically significant (*P < 0.05) results are annotated. All results are representative of more than two independent experiments. (H) (Upper) Naïve CD4+ T cells of il10−/− mice were differentiated under Th0 and Th17 polarizing conditions. Th17 cells were treated with or without MS402 (500 nM). After in vitro culturing for 3 d the cells were restimulated with PMA/ionomycine for 6 h, stained for intracellular IL-17 for flow cytometry analysis. (Lower) A similar experiment was performed under Th1 polarizing conditions to assess MS402’s effect on IFN-γ–producing CD4+ cells. (I) Naive CD4+ T cells isolated from EBI3−/− mice were differentiated under Th1 or Th17 polarizing conditions. Th17 cells were treated with or without MS402 added daily at concentration of 100 or 500 nM. After in vitro culturing for 3 d the cells were restimulated with PMA/ionomycine for 6 h, and real-time PCR was performed for detection of mRNA expression of Th17 and Th1 cytokines and transcription factors. In addition, supernatants were harvested and IL-17 production was analyzed by ELISA.
Notably, MS417, a potent pan-BET BrD inhibitor (Ki <10 nM) (26), and JQ1 (31) and I-BET762 (32) that share the diazepine scaffold, block broadly differentiation of murine primary naïve CD4+ T cells to Th17, Th1, Th2, and, to a lesser extent, Treg cells under the conditions similar to those used for MS402 (Fig. 2B and Fig. S2 B–D). Our data agree with a report of suppression of Th17-mediated pathology by JQ1 (28). Further, a potent, selective CBP BrD inhibitor, CBP30 (Kd = 26 nM), was reported to suppress Th17 cell differentiation (33). Using the same condition, however, we found that CBP30 inhibits Th17 and also Th2 cell differentiation and has limited effects on Th1 or Treg cells (Fig. S2E). These results argue that MS402’s modest activity on CBP BrD (Ki of 775 nM, 10-fold weaker than Brd4-BD1) likely does not contribute to its selective activity on Th17 cell differentiation, especially when used at submicromolar concentrations.
The selective activity of MS402 on inhibition of Th17 cell differentiation over Th1, Th2, or Treg cells is further supported by our observations that in a dose-dependent manner MS402 effectively inhibits transcriptional activation of rorc and il17a in Th17 cells, and to a lesser extent tbx21 and ifng in Th1 cells, and it has only small effects on gata3 and il4 expression in Th2 cells, and almost no effects on foxp3 and il10 in Treg cells (Fig. 2C). These results contrast sharply to the much more broad effects of MS417 on the signature genes of Th17 and Th1 as well as Th2 cells (Fig. 2C). We confirmed the inhibitory effects of MS402 on additional key Th17 genes il17f, il21, il23r, ahr, irf4, and il9 (Fig. S2F). We further observed that MS402 treatment resulted in a marked reduction of Brd4 and Cdk9 occupancy and RNA PolII Ser2 phosphorylation level at the Stat3 binding sites in il17a/f and rorc loci (Fig. S2G), which is required for transcription elongation (26). Notably, MS402 seems to have minimal effects on genomic occupancy of Brd2 (Fig. S2G). Further, MS402 inhibition is independent of IL-10 expression and does not involve IL-27 or IL-35, because it is still able to suppress Th17 and Th1 cell differentiation in il10−/− mice (Fig. S2H) and inhibit activation of il-17a, il17, rorc, ifng, and T-bet in EBI3−/− mice (Fig. S2I).
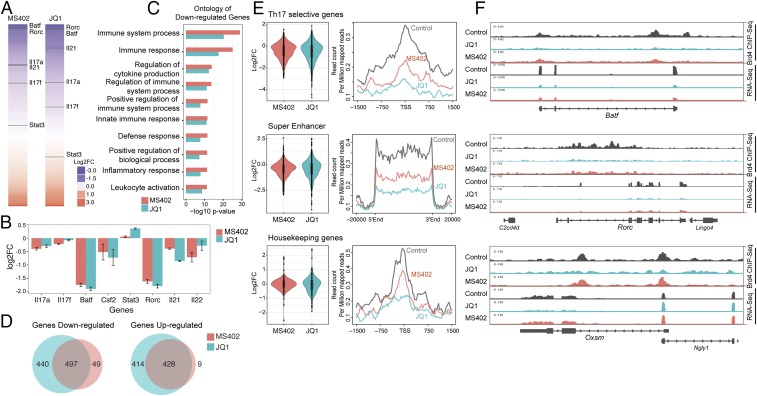
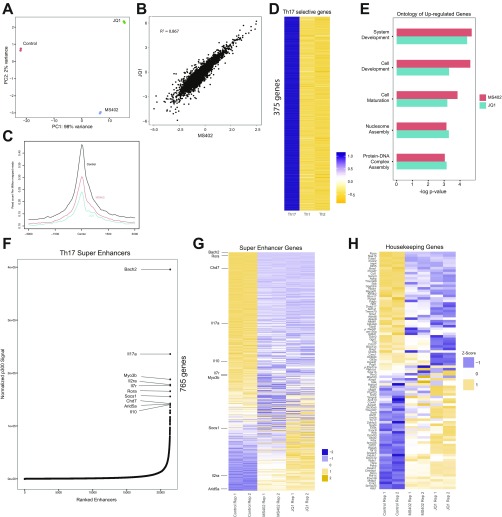
We next performed genomic sequencing analysis to better understand how MS402 and JQ1 affect gene transcription in Th17 cell differentiation. Specifically, we carried out chromatin immunoprecipitation sequencing (ChIP-seq) for Brd4 and RNA-seq experiments for mouse Th17 cells with and without MS402 or JQ1 treatment. Overall, MS402 and JQ1 treatments yielded a similar pattern of perturbation in gene transcription in Th17 cell differentiation (Fig. 3A and Fig. S3 A–D), albeit certain Th17 signature cytokine genes such as il17a,f and il22 are perturbed slightly even more by MS402 than by JQ1 (Fig. 3B). Immune and cytokine ontologies seem consistently more enriched in the set of genes down-regulated by MS402 compared with JQ1 (Fig. 3C), whereas genes up-regulated are clustered in cell development and maturation (Fig. S3E). Further, Venn diagram analyses reveal that a majority of MS402-altered genes, with up or down transcriptional expression upon compound treatment, are covered by JQ1, but almost half of JQ1-affected genes are unchanged by MS402 (Fig. 3D). Notably, violin plot analysis of the RNA-seq data and comparison of the ChIP-seq data show that MS402 is effective similarly to JQ1 in releasing Brd4 genomic occupancy at Th17 signature genes and super enhancers but has fewer effects than JQ1 at housekeeping genes (Fig. 3E and Fig. S3 F–H). This apparently selective effect of MS402 over JQ1 is illustrated by representative RNA-seq tracks showing Th17 signature genes Batf and Rorc whose transcription is effectively down-regulated by MS402 or JQ1, whereas a housekeeping gene Oxsm is down-regulated by JQ1 but much less by MS402 (Fig. 3F). Given that MS402 exhibited cellular inhibitory effects on the order of its affinity for the BD1 of BET proteins, our results collectively suggest that pharmacological inhibition of the BD1 of BET proteins by MS402, likely blocking Brd4 activity required for Th17 signature gene transcriptional activation, is sufficient to render Th17 cell differentiation.
Fig. 3.
Genomic analysis of BET inhibition effects on gene transcription during Th17 cell differentiation. (A) Effects of MS402 and JQ1 treatment on gene transcription in Th17 cell differentiation. Genes are ranked from most down-regulated to most up-regulated by compound treatment. Select Th17 signature genes whose transcriptional levels are affected by compound treatment are indicated. (B) MS402 and JQ1 show comparable (log2) fold change for select Th17 signature genes. (C) Immune and cytokine ontologies are among top-enriched down-regulated genes by MS402 or JQ1 treatment. (D) Venn diagram analysis of genes down- or up-regulated by MS402 and JQ1 treatment during Th17 differentiation. (E) Violin plots of the RNA-seq data and profiles of the ChIP-seq data showing patterns of perturbation across multiple gene sets of Th17 selective genes, genes with super enhancers, and housekeeping genes in Th17 cells upon treatment of MS402 or JQ1. (F) Select RNA-seq tracks illustrating changes of transcriptional expression of Brd4 target genes Batf and Rorc (Th17 selective genes) and Oxsm (housekeeping) upon the treatment of MS402 or JQ1.
Fig. S3.
Genomic analysis of BET inhibition effects on gene transcription in Th17 cell differentiation. (A) Principal component analysis plot showing the reproducibility of each RNA-seq experiment. JQ1 and MS402 samples also cluster together along the PC1 axis. (B) Scatter plot of log-fold change of genes altered by JQ1 and MS402 treatment illustrating a similar pattern of change for all affected genes. (C) TSS profiles of Brd4 occupancy at all genes before and after JQ1 and MS402 treatment showing Brd4 displacement by the compounds. (D) A group of 375 genes is up-regulated twofold in Th17 cells compared with Th1 and Th2 cells. This set is used in Fig. 3B. (E) Genes, up-regulated by MS402 and JQ1 treatment, are enriched for similar ontologies, including developmental genes as well as genes involved in chromatin maintenance. (F) Super enhancers discovered using a ROSE-type algorithm on p300 peaks in Th17 cells. Over 750 genes in proximity to super enhancers were discovered, with the top 10 labeled. (G) Treatment by JQ1 and MS402 demonstrates a similar pattern in down-regulation of the majority of super-enhancer genes, as identified in C. (H) Treatment by JQ1 alters a representative set of 100 housekeeping genes in greater fashion compared with MS402. Both compounds, however, demonstrate similar trends in up-regulation and down-regulation of these housekeeping genes. This set was used for analysis in Fig. 3B.
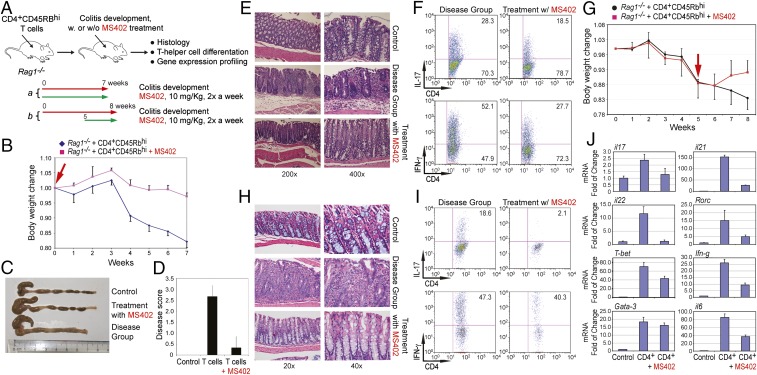
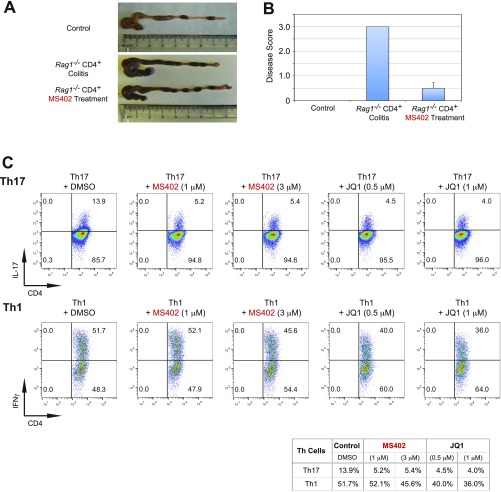
We next examined in vivo effects of MS402 in a T-cell transfer-induced colitis model in mice (Fig. 4A), in which Th17 cells are implicated in disease progression (11–13). After reconstitution with naïve CD4+CD45RBhi cells isolated from spleen and lymph nodes of C57BL/6 mice, Rag1−/− mice began losing weight after 4 wk, whereas the mice that received MS402 intraperitoneally twice a week at 10 mg/kg showed much less weight loss (Fig. 4B). Histology analysis revealed that 7 wk after reconstitution the colon of the T-cell transfer group mice was markedly shorter and inflamed compared with the control, whereas the colons of MS402-treated mice showed little difference in length or appearance (Fig. 4C). Notably, unlike the disease mice that exhibited severe inflammation at the end of the study with a disease score of 3, the MS402-treated mice displayed only mild or almost negative inflammation with a disease score of 0–1 (Fig. 4D). Histological study of colon sections from the disease mice confirmed more severe inflammatory cell infiltrates and significantly higher pathological scores than colons of those treated with MS402 (Fig. 4E). Finally, the MS402-treated mice showed a significantly lower percentage of IL-17- and IFN-γ–producing CD4+ T cells in colon than the disease mice (Fig. 4F). Taken together, these results showed that MS402 is effective in vivo, blocking Th17 cell development required for T-cell transfer-induced colitis in mice.
Fig. 4.
MS402 ameliorates adaptive T-cell transfer-induced colitis in mice. (A) Scheme illustrating the experimental colitis study. CD4+CD45RBhi T cells were purified from spleens and lymph nodes of wild-type or iNOS−/− mice and 5 × 10⁵ cells were injected (i.p.) into recipient Rag1−/− mice. Mice were treated with PBS in a control group or MS402 (10 mg/kg) twice a week starting either at week 0 (a), or week 5 (b) for 7 or 3 wk, respectively. Body weight change was monitored weekly, and mice were killed at the end of experiment for histology analysis. (B) Changes in body weight of Rag1−/− mice (n = 5–6 mice per group) after i.p. transfer of wild-type CD4+CD45RBhi T cells were recorded. MS402 treatment started at week 0 for 7 wk. Data are presented as the mean ± SD of the percentage of initial body weight and are representative of two similar experiments. (C) Changes of morphology of intestines of the Rag1−/− mice with and without MS402 treatment as in B. (D) Disease score assessing efficacy of MS402 treatment as in B on ameliorating inflammation of colitis in mice. The inflammation grading was graded on a scale of 0–3: negative (0), no inflammation; mild (1), mild and patchy; moderate (2), most crypts involved by inflammation; or severe (3), crypt abscess, ulceration, erosion, or submucosal involvement. The inflammation cells are most lymphocytes with some neutrophils. (E) Images showing H&E staining of large intestines of the Rag1−/− mice with or without MS402 treatment as in B. (F) Flow cytometry analysis of CD4+IL17+ and CD4+IFNγ+ T cells in large intestine from the Rag1−/− mice treated with or without MS402 treatment as in B. All results are statistically significant (P < 0.05) and are representative of more than two independent experiments. (G) Body weight change over time after CD4+ T cells injected into recipient Rag1−/− mice with and without MS402 treatment, as indicated by a red arrow (i.e., started at week 5 until week 8). (H) Images showing H&E staining of large intestines of the Rag1−/− mice with or without MS402 treatment as in G. (I) Flow cytometry analysis of CD4+IL17+ and CD4+IFNγ+ T cells in large intestine from the Rag1−/− mice treated with or without MS402 starting at week 5 as in G. All results are statistically significant (P < 0.05) and are representative of more than two independent experiments. (J) mRNA levels of Th17 and Th1-specific genes measured in the Rag1−/− mice treated with or without MS402 starting at week 5 as in G.
We conducted another in vivo experimental colitis study to explore therapeutic potential of MS402. In this study we started MS402 treatment at week 5 when the Rag1−/− mice had developed colitis, as judged by marked weight loss, with i.p. injections twice a week at 10 mg/kg for 3 wk (Fig. 4A). Notably, the mice treated with MS402 exhibited a reversal of weight loss after 1 wk (Fig. 4G). Consistently, the MS402-treated mice showed an almost minimal degree of inflammation in the colon, as demonstrated by much improved colon length and appearance (Fig. S4A), a lower disease score of 0–1 (Fig. S4B), and markedly reduced inflammatory cell infiltrates in colon sections as compared with those of the disease-group mice (Fig. 4H). Further, the MS402-treated mice also had a lower population of IFN-γ–producing CD4+ T cells and exhibited a much more dramatic reduction of IL-17–producing CD4+ T cells in colon than the group of T-cell-transfer disease mice (Fig. 4I). It is worth noting that the selectivity of MS402 for Th17 over Th1 cells is more profound in this therapeutic treatment model than that in the preventive model (Fig. 4I vs. Fig. 4F). This differential effect seems to be consistent with the selectivity of MS402 on the maintenance of Th17 over Th1 cells compared with broad effects by pan-BET inhibitor JQ1 after these Th cells are differentiated ex vivo from the mouse primary naïve CD4+ T cells (Fig. S4C). Finally, the MS402-treated mice had much lower mRNA expression levels of key cytokines and Th17- and Th1-specific transcription factors including il17, il21, il22, il6, rorc, Tbet, and ifng compared with the disease-group mice (Fig. 4J). Collectively, these results show that MS402 is an effective inhibitor of Th17 cell development and ameliorates adaptive T-cell transfer-induced colitis in mice.
Fig. S4.
MS402 ameliorates adoptive T-cell transfer-induced colitis in mice. (A) Changes of morphology of intestines of the Rag1−/− mice with and without MS402 treatment started at week 5 until week 8, as indicated in Fig. 4A. (B) Disease score assessing efficacy of MS402 treatment as in A on ameliorating inflammation of colitis in mice. The inflammation grading was graded on a scale of 0–3: negative (0), no inflammation; mild (1), mild and patchy; moderate (2), most crypts involved by inflammation; or severe (3), crypt abscess, ulceration, erosion, or submucosal involvement. The inflammation cells are most lymphocytes with some neutrophils. (C) Flow cytometry analysis assessing the effects of MS402 or JQ1 treatment (24 h at the indicated concentrations) on the maintenance of Th17 and Th1 cells after being differentiated from mouse primary naïve CD4+ T cells purified from spleens and lymph nodes of C57BL/6 mice under Th17 and Th1 polarization conditions after 3 d. These results are statistically significant (P < 0.05) and are representative of more than two independent experiments.
Notably, it was recently reported that BET inhibition by JQ1 caused an increased progression of dextran sodium sulfate (DSS)-induced colitis in mice (34). Although the acute DSS colitis model is useful for study of the innate immune system in the development of intestinal inflammation, T and B cells are not required for the colitis development in this model (35). Nevertheless, these results highlight multifaceted functions of the BET proteins in adaptive and innate immunity and inflammatory pathology. Further investigation is warranted to determine the mechanistic details of the BET proteins in different functional contexts.
In summary, in this study we show that the BrDs of the BET proteins likely have distinct functions in gene transcription during differentiation of naïve CD4+ T cells to different T-helper cells, and that the BD1 of Brd4 is central to Th17 cell differentiation and both BD1 and BD2 are important for Th1 and Th2 cell differentiation, whereas neither is essential for Treg cell differentiation. Notably, the BET proteins likely function differently in Th17 cells. Unlike Brd4, Brd2 genomic occupancy is minimally affected by BET inhibition, whereas as reported Brd3 has little expression in Th17 cells (28). Accordingly, our newly designed BD1-specific inhibitor MS402 is effective and sufficient to render Th17 cell differentiation likely through blocking Brd4 binding to Th17 signature gene loci whose transcriptional activation is required for Th17 cell differentiation. We further showed that selective chemical inhibition of the BD1 of Brd4 by MS402 can effectively prevent and ameliorate T-cell transfer-induced colitis in mice by blocking Th17, and to lesser extent Th1 cell development. Collectively, our study suggests a therapeutic strategy of selective targeting the BD1 of the BET proteins as a promising targeted therapy for inflammatory bowel diseases including colitis that lack a safe and effective treatment.
Materials and Methods
Methods and associated references are available in SI Materials and Methods.
Mice.
C57BL/6 wild-type, il10−/−, and EBI3−/− mice were obtained from Jackson Laboratory.
Compound.
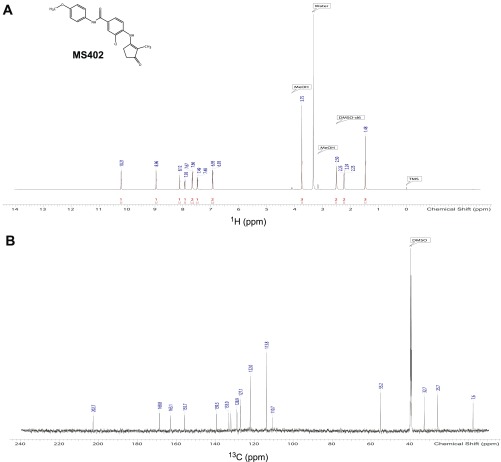
The chemical synthesis and characterization of MS402 is provided in Scheme S1 and Fig. S5.
Fig. S5.
NMR spectra of compound 5, MS402. (A) The 1H and (B) 13C NMR spectra of MS402 in d6-DMSO, collected on a 600-MHz Bruker NMR spectrometer at room temperature.
Cell Sorting and T-Helper-Cell Differentiation.
CD4+ T cells were purified from mouse spleen and lymph nodes using anti-CD4 microbeads (Miltenyi Biotech). Naïve CD4+ T cells were activated with plate-bound anti-CD3 (1.5 μM/mL) and anti-CD28 (1.5 μM/mL) plus cytokines IL-12 (20 ng/mL) and anti-IL4 (10 μM/mL) for Th1 conditions, IL4 (20 ng/mL), anti-IL12 (10 μM/mL), and anti–IFN-γ (10 μM/mL) for Th2 conditions, IL6 (20 ng/mL) and TGF-β (2.5 ng/mL) for Th17 conditions, and TGF-β (2.5 ng/mL) for Treg conditions. The cells were cultured for 2–3 d before harvesting for analysis. All cytokines were purchased from R&D, and neutralizing antibodies were purchased from BD Pharmigen.
Intracellular Staining and Flow Cytometry.
Cells were stimulated with phorbol myristate acetate (PMA) and ionomycin for 5 h in the presence of brefeldin A before intracellular staining. Cells were fixed with IC Fixation Buffer (BD Biosciences), incubated with permeabilization buffer, and stained with PE-anti-mouse IL-17, APC-anti-IFN-γ, and PE-Cy 5.5 anti-mouse CD4 antibodies. Flow cytometry was performed on a FACSCalibur and BD LSR Fortessa (BD Biosciences).
Real-Time Quantitative PCR (qPCR).
Total RNA was extracted with RNeasy Mini Kit (Qiagen) and reverse-transcribed using the SuperScript III Reverse Transcriptase (Life Technologies). All qPCR analyses were performed using Brilliant III Ultra Fast SYBR Green QPCR Master Mix (Agilent Technologies). In gene expression analysis all data were normalized with Actin/Gapdh and represented relative to the control sample (fold change). For ChIP-qPCR relative occupancies were calculated as ratio of the amount of immunopreciptated DNA to that of the input sample (percent input). Measurements were performed in duplicate, and error bars denote experimental SDs. Results are representative of more than two independent experiments. Primer sequences are available in Table S2.
Table S2.
Primers used for RT-qPCR analysis
| Primers | Forward | Reverse |
| RT-PCR primers | ||
| GAPDH | AACTTTGGCATTGTGGAAGG | GGATGCAGGGATGATGTTCT |
| Brd2 | Qiagen Mm_brd2_1_SG | |
| Brd3 | Qiagen Mm_brd3_1_SG | |
| Brd4 | Qiagen Mm_brd4_var1_SG | |
| IL17a | CTTCATCTGTGTCTCTGATGCTGTT | TCGCTGCTGCCTTCACTGT |
| IL17f | CAAAACCAGGGCATTTCTGT | ATGGTGCTGTCTTCCTGACC |
| IL21 | CGCCTCCTGATTAGACTTCG | GCCCCTTTACATCTTGTGGA |
| Rorc | TGCAAGACTCATCGACAAGG | AGGGGATTCAACATCAGTGC |
| IFNg | CAACAGCAAGGCGAAAAAGG | GGACCACTCGGATGAGCTCA |
| Tbx21 | CAACAACCCCTTTGCCAAAG | TCCCCCAAGCAGTTGACAGT |
| IL4 | GGCATTTTGAACGAGGTCACA | AGGACGTTTGGCACATCCA |
| ChIP-qCPR primers | ||
| IL17-p1 | CAGGTATTATTCTCAGGGCTTTGG | TGGCAATGGTGTCTTTTCTTTG |
| IL17-p2 | CACCTCACACGAGGCACAAG | ATGTTTGCGCGTCCTGATC |
| IL17-p3 | GGATTAAGGGCACACGTGTTG | TTTCCCCACTCTGTCTTTCCA |
| IL17-p4 | TCATCGGCTCCCACACAGA | GGCAGTACCGAAGCTGTTTCA |
| IL17-p5 | CCCACAAAGCAACACTCTTGTC | ACTGCATGACCCGAAAGCA |
| IL17-p6 | GCATCGCATCTTTCAAACCA | TTAGGATAAGCGCCCAGTGAAT |
| rorc-p4 | CCCTGGGAGGAAAGCGAGTCAGAATGA | AGCTTGGGAATTGGACATTGGATGGATGAG |
| rorc-bs1 | AGCTTTGCTGTGGAAGATGTTTC | GAAGGGCTGGTAGGGAAGTCA |
| rorc-nonstat | GCCAACAGGACTTTTGCCCAGC | TGGAGGGTGAGGCTCTGCTAACT |
| tbx21-p1 | CACCATCTCGCTTTCCGCT | TCCCCCTGGCTGACTTTTC |
| tbx21-p2 | CCCCGGGGTCTGGGATATAGTTCA | GGGGGTGGAACCAGAAGCGT |
| tbx21-p3 | CACCCAAAGCAGCCCACGG | CGCTAGCTGTTACGCTGCCAC |
| tbx21-p4 | CCGCCCCCTCGTGGCTAATAC | GGGTCGGGGCTTCAGTCCTC |
| tbx21-p5 | AGCGCGACTCTCAGCTTCCC | CGCGCGAGGACTACGCATTG |
| tbx21-p6 | TGACCTCAGGCCACAGCGAG | TTCCGGCCCATGCGAACTCT |
| ifng-p1 | GGGCTTCCTCACCACATTGGCT | TGCAATGGGGGAAGCCTTTTCAAAC |
| ifng-p2 | AAGGCTCCCTGTGCTGTGC | GTCTCCCCCTTTTTGCCCT |
| ifng-p3 | ACCCCAAATGGTGTGAAGTAAAA | CCCACCTGTGCCATTCTTGT |
| ifng-p4 | TCCTCCTGCGGCCTAGCTCT | AGCCAAGATGCAGTGTGTAGCGT |
| ifng-p5 | TGCCTCCCGTATGTGTTTGGAGC | CTGCCCCCTTATGGTCCAGGC |
| ifng-p6 | CCTTCTTCAGCAACAGCAAGGCG | GCCGTCTCACCTCAAACTTGGC |
| ifng-p7 | ACAGGTCCAGCGCCAAGCAT | CAGCTGGTGGACCACTCGGA |
ELISA.
All ELISA kits were purchased from eBioscience and experiments were performed according to protocols provided by the manufacturer. Briefly, supernatants of samples were incubated in plates coated with capture antibody. Detection antibody was added after a total of five washes. Avidin-HRP was then added after a total of five washes. Plates were read at 450 nm after addition of substrate solution and stop solution. Concentration of the cytokines in samples was calculated with reference to the absorbance value obtained from the standard curve.
ChIP.
Cells were chemically cross-linked with 1% formaldehyde solution for 10 min at room temperature followed by the addition of 2.5 M glycine (to a final concentration of 125 mM) for 5 min. Cells were rinsed twice with cold 1× PBS and then lysed in Szak’s RIPA buffer [150 mM NaCl, 1% Nonidet P-40, 0.5% deoxycholate, 0.1% SDS, 50 mM Tris⋅HCl, pH 8, 5 mM EDTA, Protease Inhibitor mixture (Roche), and 10 mM PMSF]. Cells were then sonicated using sonicator (QSonica) for 10 pulses of 15 s at a voltage of 70 V, followed by a 1-min rest on ice. Sonicated chromatin was cleared by centrifugation. The resulting chromatin extract was incubated overnight at 4 °C with appropriate primary antibody (anti-Brd4 or IHC-00396) and 25 μL of Protein G and 25 μL of Protein A magnetic beads (Dynabeads; Life Technologies). Beads were washed two times with incomplete Szak’s RIPA buffer (without PMSF and Protease Inhibitor mixture), four times with Szak’s IP Wash Buffer (100 mM Tris⋅HCl, pH 8.5, 500 mM LiCl, 1% Nonidet P-40, and 1% deoxycholate), then twice again with incomplete RIPA buffer and twice with cold 1× Tris-EDTA. Complexes were eluted from beads in Talianidis Elution Buffer by heating at 65 °C for 10 min and then by adding NaCl to a final concentration of 200 mM and reverse cross-linking was performed overnight at 65 °C. Input DNA was concurrently treated for cross-link reversal. Samples were then treated with RNaseA and proteinase K for an hour, extracted with phenol/chloroform, and ethanol-precipitated. The pellet was resuspended in water and used for subsequent ChIP-seq library preparation or analyzed by qPCR as described above.
T-Cell-Transfer Colitis Studies and Histopathology.
T-cell-transfer colitis was performed as previously described (36, 37). Briefly, purified CD4+CD45RBhi T cells from C57/B6 mice were injected i.p. into Rag1−/− recipients (5 × 10⁵ cells per mouse in 200 μL sterile PBS per injection). Mice were weighed every week throughout the course of experiments. After 5–7 wk, mice were killed and colon tissues were excised. Tissues were fixed in 10% (vol/vol) buffered formalin and paraffin-embedded. The sections (5 μm) of tissue samples were stained with H&E. All of the slides were read and scored by an experienced pathologist without previous knowledge of the type of treatment. The degree of inflammation in the epithelium, submucosa, and muscularis propria was scored separately.
Sequencing Library Preparation and Sequencing.
ChIPed-DNA was end-repaired with T4 DNA polymerase and polynucleotide kinase. An A-base was added to the end-repaired DNA fragments. Solexa adaptors were ligated to the DNA fragments and 200- to 300-bp size fractions were obtained using E-gel (Life Technologies). Adaptor-modified fragments were enriched by 18 cycles of PCR amplification. The DNA library prep was validated in Bioanalyzer for quantity and size. The input- and ChIPed-DNA libraries were sequenced on the Illumina HiSeq2000 platform with 50-bp read length in a single end mode. RNA-seq libraries were prepared from TRIzol-extracted RNA samples from which rRNA was removed using Ribo-ZeroTM and following the TruSeq Stranded Total RNA Sample Prep kit protocol (Illumina). The input- and ChIP-DNA libraries were sequenced on the Illumina HiSEq. 2000 platform with 50-bp read length in a single end mode. Sequencing of RNA libraries was performed on the Illumina HiSEq. 2000 platform with 100-bp read length in a paired end mode. All ChIP-seq and RNA-seq data in this study are deposited in the Gene Expression Omnibus under the accession nos. GSE90788 and GSE95052, respectively.
Bioinformatics Analysis.
For ChIP-seq analysis the input and ChIP samples were sequenced by Illumina HiSeq200. After QC filtering by FASTAX (hannonlab.cshl.edu/fastx_toolkit/), only the reads with a quality score Q20 in at least 90% bases were included for analysis. The reads from both input and ChIP samples were filtered and trimmed using Trimmomatic (38) and then aligned to mm9 reference genome using Bowtie. The peaks in the ChIP sample in reference to the input sample were called from read alignments by MACS algorithm (v1.4) and then the distance to the closest transcription start site (TSS) was annotated from genome mapping information of RefSeq transcripts. Genes associated with peaks were annotated (amp.pharm.mssm.edu/Enrichr/). Peaks were chosen with the criteria false discovery rate (FDR) <0.01 and P value <0.005. ChIP-seq from published work was taken from GSE60482 (Th17 p300) (15, 39). This was treated the same as in-house-generated ChIP-Seq. Finally, the alignment and coverage of ChIPseq data were visualized by Integrative Genomics Viewer (software.broadinstitute.org/software/igv/). Gene annotation and pathway analysis of the identified genes was performed using the Database for Annotation, Visualization and Integrated Discovery (https://david.ncifcrf.gov/). For RNA-Seq analysis the reads were filtered and trimmed using Trimmomatic (38) and aligned to the mm9 mouse reference genome and indexes based on UCSC annotations using TopHat (40). HTSeq (41) was used to find the read counts across the UCSC reference genome. Differentially expressed genes were identified by the R package DESeq2 (42) using an FDR <0.1 and fold change >1.5. RNA-Seq from Th1 and Th2 cells was taken from GSE40463. These data were analyzed in the same way as in-house-generated data. Heat maps were derived by sorting all genes with counts ≥5 by log-fold change for each compound treatment.
Statistical Analysis.
Statistical analysis was performed using Student’s t test. P values <0.05 were considered statistically significant.
Data Deposition.
Structure factors and coordinates for the BRD4-BD1/MS402 complex have been deposited in the Protein Data Bank (PDB ID code 5ULA).
Study Approval.
Mouse experiments were approved by the Institutional Animal Care and Use Committees of the Icahn School of Medicine at Mount Sinai.
SI Materials and Methods
Protein Preparation.
Expression and purification of the recombinant human bromodomains of BAZ2B, BPTF, BRD4, BRD7, PCAF, and SMARCA4 in poly-His-tag form were carried out using a previously described procedure (44, 45). Isotope-labeled protein samples of the BrDs were prepared from HeLa cells grown in a minimal medium containing 15NH4Cl with or without 13C6-glucose in either H2O or 75% 2H2O. The protein was purified by affinity chromatography on a nickel-IDA column (Life Technolgies), followed by the removal of poly-His tag by thrombin cleavage.
Fluorescence Anisotropy Binding Assay.
Binding affinity of MS402 for various human BrDs was assessed in a fluorescence anisotropy competition assay using an FITC-labeled MS417 as an assay probe as described previously (45). Competition experiments were performed with a BrD protein (0.25–1 μM) and the fluorescent probe (80 nM) and increasing concentration of unlabeled competing ligand in a PBS buffer (pH 7.4) in total volume of 80 µL. Measurements were obtained after a 1-h incubation of the fluorescent ligand and the protein at 25 °C with a Safire 2 microplate reader (Tecan). In a competition-binding assay, fluorescent ligand concentration was ≤2 Kd, and protein concentration was set at which 50–80% of fluorescent ligand is bound. The dissociation constant of a competing ligand was calculated with the correction to the Cheng–Prussoff equation introduced by Nicolovska-Coleska et al. (46). Assuming one-site competitive binding model, the equation used to calculate Ki’s from IC50 values recovered from fitting data using Prism is
where [I50] is the concentration of free inhibitor at 50% inhibition, [L50] is the concentration of free labeled ligand at 50% inhibition, and [P0] is the concentration of free protein at 0% inhibition. Note that Kd for each protein–probe pair is the limit of resolvable Ki in a competition assay.
Thermal Shift Assay Assessing Protein/Ligand Binding.
Thermal melting experiments were carried out using a reported procedure (47) in an Mx3005p Realtime PCR machine (Agilent). The protein sample (10 μM) was mixed with MS402 (10 μM) in 20 μL of Hepes buffer (10 mM) of pH 7.5 containing 500 μM NaCl, and the assay was carried out in a 96-well plate. SYPRO Orange (Sigma Aldrich) was added as fluorescence probe at a dilution of 1:1,000. Excitation and emission filters for SYPRO Orange dye were set to 465 nM and 590 nM, respectively. The temperature was raised with a step of 3 °C/min from 25 °C to 95 °C and a fluorescence reading was taken at each interval. The fluorescent data were fitted to a Boltzmann sigmoidal equation (47) using Prism: y = bottom + (top − bottom)/[1 + exp(Tm − x/slope)], where y is fluorescence emission in arbitrary units, x is temperature, bottom is baseline fluorescence at low temperature, top is maximal fluorescence at the top of the dataset, slope describes the steepness of the curve, and Tm is the melting temperature of the protein. The observed temperature shifts, ΔTm, were recorded as Tm difference without or with MS402 in the protein sample.
Protein Crystallization and X-Ray Diffraction Data Collection.
Purified BRD4-BD1 (16 mg/mL) was mixed with MS402 at 1:5 molar ratio of protein:ligand. The complex was crystallized using the sitting drop vapor diffusion method at 20 °C by mixing 1 µL of protein solution with 1 µL of the reservoir solution that contains 4.3 M of sodium chloride and Hepes-NaOH, pH 7.5. Crystals were soaked in the corresponding mother liquor supplemented with 20% ethylene glycerol as cryoprotectant before freezing in liquid nitrogen. X-ray diffraction data were collected at 100 K at beamline X6A of the National Synchrotron Light Source at Brookhaven National Laboratory. Data were processed using the HKL-2000 suite (48). The BRD4-BD1 structure was solved by molecular replacement using the program MOLREP (49), and the structure refinement was done using the program Refmac (50). The graphics program Coot (51) was used for model building and visualization. Crystal diffraction data and refinement statistics for the structure are displayed in Table S1.
Chemical Synthesis.
All reactions were carried out in oven-dried glassware under an atmosphere of argon. Liquid chromatography mass spectra (LCMS) analysis was conducted from a computer running Agilent Technologies MassHunter A02.02 software interfaced to a 1200 HPLC system and G1969A high-resolution atmospheric pressure interface time-of-flight mass spectrometer. HPLC conditions are as follows: Zorbax 300SB-C18 narrow-bore column (2.1 × 150 mm, 5 μm), held constant at 45 °C; flow rate = 0.4 mL/min; solvent (A) = H2O:acetonitrile (9:1) containing formic acid (0.1%); solvent (B) = H2O:acetonitrile (1:9) containing formic acid (0.1%); solvent B % (time) = 1% (0–1 min), 1–99% (1–4 min), 99% (4–8 min). Sample ionization: Electrospray ionization, positive mode; gas temperature = 350 °C; drying gas = 11.0 L/min; nebulizer = 45 psig; capillary = 4.0 kV. Mass spectra data processing was conducted using Analyst QS 1.1 software. Theoretical mass to charge ratios were calculated using ChemDraw software. In relevant cases identifiable, radical cation of mass plus hydrogen, [M+H]+; mass plus sodium, [M+Na]+; two masses plus hydrogen, [2M+H]+; and two masses plus sodium, [2M+Na]+ data were recorded. Proton (1H) and carbon (13C) NMR spectra were acquired on a Bruker DRX-600 spectrometer at 600 and 125 MHz, respectively. Chemical shifts were expressed in parts per million downfield from tetramethylsilane (TMS 0.03%, 1H = 0 ppm), or the solvent resonance as an internal standard D6-DMSO (13C = 39.5 ppm). Signals were reported as chemical shift [multiplicity (s, singlet; d, doublet; m, multiplet; and br, broad), coupling constant, integration]. The high-resolution mass spectrometer (HRMS) result was obtained from the Mass Spectrometer Core Facility at Columbia University using a HX-110 double-focusing high-resolution mass spectrometer (JEOL Ltd.) with 10-kV acceleration voltage, fast atom bombardment ionization Xe, and 3-kV collision energy.
The synthesis of 5 (MS402) [3-chloro-N-(4-methoxyphenyl)-4-((2-methyl-3-oxocyclopent-1-en-1-yl)amino)benzamide] was carried out by following the reaction steps outlined in Scheme S1.
Synthesis of 3-Chloro-4-Formamidobenzoic Acid (2).
Formic acid (18.1 mL, 40 eq) and acetic anhydride (11.3 mL, 10 eq) were mixed and heated to 50 °C for 1 h. Then 4-amino-3-chlorobenzoic acid (1, 2.06 g, 12.0 mmol, 1 eq) was added and the whole was heated to 65 °C for 2 h. The reaction mixture was allowed to cool to room temperature and then poured into ice-cold H2O. The precipitate was collected by filtration, washed with H2O, and dried on the frit. This method yielded 2.2 g (92% yield) of white microcrystals from precipitate.
Melting point (m.p.): 227–229 °C; 1H-NMR (600 MHz, d6-DMSO) δ 13.19 ppm (s, 1H), 10.15 (d, J = 2.1 Hz, 1H), 8.43 (d, J = 0.6 Hz, 1H), 8.38 (d, J = 8.6 Hz, 1H), 7.96–7.97 (m, 1H), 7.90 (dd, J = 8.5, 1.4 Hz, 1H); 13C-NMR (125 MHz, d6-DMSO) δ 166.2, 161.3, 138.6, 130.7, 129.4, 127.5, 122.8, 122.0; LCMS t = 3.0 min, (m/z): [M+H]+ calculated for C8H7ClNO3, 200.0114; found, 200.0115; [2M+H]+ calculated for C16H13Cl2N2O6, 399.0151; found, 399.0149; [2M+Na]+ calculated for C16H12Cl2N2NaO6, 420.9970; found, 420.9963.
Synthesis of 3-Chloro-4-Formamido-N-(4-Methoxyphenyl)Benzamide (3).
N-methylmorpholine (0.95 mL, 1.2 eq) and isobutylchloroformate (1.12 mL, 1.2 eq) were added to 2 (1.44 g, 7.2 mmol) stirring in CH2Cl2 (30 mL), in a screw-capped vial. After stirring for 30 min, p-anisidine (1.06 g, 1.2 eq) and a second aliquot of N-methylmorpholine (0.95 mL) were added. The vial was sealed and stirred at room temperature for 18 h. The precipitate was filtered and rinsed with CH2Cl2, H2O and diethyl ether. The method yielded 1.75 g (80% yield) of white microcrystals from precipitate.
m.p.: 238–240 °C; 1H-NMR (600 MHz, d6-DMSO) δ 10.16 ppm (s, 1H), 10.11 (s, 1H), 8.43 (s, 1H), 8.34 (d, J = 8.4 Hz, 1H), 8.11 (s, 1H), 7.93 (d, J = 8.4 Hz, 1H), 7.66 (d, J = 8.7 Hz, 2H), 6.93 (d, J = 8.8 Hz, 2H), 3.75 (s, 3H); 13C-NMR (125 MHz, d6-DMSO) δ 163.5, 161.2, 156.0.5, 137.4, 132.4, 131.6, 129.1, 127.7, 123.0, 122.5 (2C), 122.1, 114.2 (2C), 55.6; LCMS t = 4.0 min, (m/z): [M+H]+ calculated for C15H14ClN2O3, 305.0693; found, 305.0690; [M+Na]+ calculated for C15H13ClN2NaO3, 327.0512; found 327.0498; [2M+H]+ calculated for C30H27Cl2N4O6, 609.1308; found, 609.1304; [2M+Na]+ calculated for C30H26Cl2N4NaO6, 631.1127; found, 631.1133.
Synthesis of 4-Amino-3-Chloro-N-(4-Methoxyphenyl)Benzamide (4).
Acetyl chloride (10.9 mL, 14 eq) was added to a CH2Cl2:MeOH (50 mL, 1:1) mixture at 0 °C, followed by 3 (3.35 g, 11.0 mmol). After warming to room temperature, the hydrochloride salt was collected by filtration and dried on the frit. Method yielded 2.77 g of white microcrystals (80% yield) from precipitate. The salt was added to saturated aq Na2CO3 (50 mL) and the free base was extracted with CH2Cl2 (3 × 30 mL) and EtOAc (30 mL). The organic layers were combined, dried over sodium sulfate, filtered, and concentrated on the rotovap.
m.p.: 144–146 °C; 1H-NMR (600 MHz, d6-DMSO) δ 9.81 ppm (s, 1H), 7.90 (d J = 2.0 Hz, 1H), 7.70 (dd, J = 8.5, 2.0 Hz, 1H), 7.64 (m, 2H), 6.91 (m, 2H), 6.83 (d, J = 8.5 Hz, 1H), 6.0 (s, 2H), 3.74 (s, 3H); 13C-NMR (125 MHz, d6-DMSO) δ 164.1, 155.7, 148.1, 132.9, 129.2, 128.2, 122.9, 122.2 (2C), 116.5, 114.5, 114.1 (2C), 55.6; LCMS t = 4.1 min, (m/z): [M+H]+ calculated for C14H14ClN2O2, 277.0744; found, 277.0744; [M+Na]+ calculated for C14H13ClN2NaO2, 299.0563; found 299.0552; [2M+H]+ calculated for C28H27Cl2N4O4, 553.1409; found, 553.1411; [2M+Na]+ calculated for C28H26Cl2N4NaO4, 575.1229; found, 575.1228.
Synthesis of 3-Chloro-N-(4-Methoxyphenyl)-4-((2-Methyl-3-Oxocyclopent-1-en-1-yl)Amino)Benzamide (5, MS402).
The 2-methyl-1,3-cyclopentandione (1.17 g, 10.4 mmol) and 4 (3.26 g, 10.4 mmol) were heated to reflux in toluene (200 mL). Upon reflux the solution was removed from heating, and p-toluene sulfonic acid (p-TSA) as an acid catalyst was added. The apparatus was equipped with a Dean-Stark condenser and returned to reflux for 18 h. The solvent was removed on the rotovap and the subsequent crude material was recrystallized from the indicated solvent. The method yielded 2.7 g (70% yield), after recrystallization from AcOH, followed by recrystallization from MeOH.
m.p.: 225–226 °C; 1H-NMR (600 MHz, d6-DMSO) δ 10.21 ppm (s, 1H), 8.96, (s, 1H), 8.12 (d, J = 1.4 Hz, 1H), 7.92–7.94 (m, 1H), 7.66 (d, J = 8.9 Hz, 2H), 7.48 (d, J = 8.3 Hz, 1H), 6.94 (d, J = 8.9 Hz, 2H), 3.75 (s, 3H), 2.49–2.51 (m, 2H), 2.22–2.46 (m, 2H), 1.48 (s, 3H); 13C-NMR (125 MHz, d6-DMSO) δ 202.7, 168.8, 163.1, 155.7, 139.3, 133.0, 131.9, 128.9, 128.8, 127.2, 127.1, 122.0 (2C), 113.8 (2C), 110.7, 55.2, 32.7, 25.7, 7.6; LCMS t = 4.2 min, (m/z): [M+H]+ calculated for C20H20ClN2O3, 371.1162; found, 371.1166; [M+Na]+ calculated for C20H19ClN2NaO3, 393.0982; found 393.0978; [2M+H]+ calculated for C40H39Cl2N4O6, 741.2247; found, 741.2252; [2M+Na]+ calculated for C40H38Cl2N4NaO6, 763.2066; found, 763.2054; HRMS (m/z): [M+H]+ calculated for C20H20ClN2O3, 371.1162; found 371.1158.
The 1H and 13C NMR spectra of compound 5 (MS402) are shown in Fig. S5.
Acknowledgments
We thank Dr. J. Jakoncic and the staff at the X6A beamline of the National Synchrotron Light Sources at the Brookhaven National Laboratory for assisting with X-ray data collection. This work was supported in part by the research fund from the First Hospital of Jilin University, and the research grants from the National Natural Science Foundation of China (81601409) (to L. Zhao) and the US National Institutes of Health (to L. Zeng, M.J.W., H.X., and M.-M.Z.).
Footnotes
The authors declare no conflict of interest.
This article is a PNAS Direct Submission.
Data deposition: Crystallography, atomic coordinates, and structure factors have been deposited in the Protein Data Bank, www.pdb.org (PDB ID code 5ULA). The ChIP-seq and RNA-seq data have been deposited in the Gene Expression Omnibus (GEO) database, www.ncbi.nlm.nih.gov/geo (accession nos. GSE90788 and GSE95052, respectively).
This article contains supporting information online at www.pnas.org/lookup/suppl/doi:10.1073/pnas.1615601114/-/DCSupplemental.
References
- 1.Iwasaki A, Medzhitov R. Control of adaptive immunity by the innate immune system. Nat Immunol. 2015;16(4):343–353. doi: 10.1038/ni.3123. [DOI] [PMC free article] [PubMed] [Google Scholar]
- 2.Tabas I, Glass CK. Anti-inflammatory therapy in chronic disease: Challenges and opportunities. Science. 2013;339(6116):166–172. doi: 10.1126/science.1230720. [DOI] [PMC free article] [PubMed] [Google Scholar]
- 3.Abraham C, Medzhitov R. Interactions between the host innate immune system and microbes in inflammatory bowel disease. Gastroenterology. 2011;140(6):1729–1737. doi: 10.1053/j.gastro.2011.02.012. [DOI] [PMC free article] [PubMed] [Google Scholar]
- 4.Rubin DC, Shaker A, Levin MS. Chronic intestinal inflammation: Inflammatory bowel disease and colitis-associated colon cancer. Front Immunol. 2012;3:107. doi: 10.3389/fimmu.2012.00107. [DOI] [PMC free article] [PubMed] [Google Scholar]
- 5.Saleh M, Trinchieri G. Innate immune mechanisms of colitis and colitis-associated colorectal cancer. Nat Rev Immunol. 2011;11(1):9–20. doi: 10.1038/nri2891. [DOI] [PubMed] [Google Scholar]
- 6.Takahama Y. Journey through the thymus: Stromal guides for T-cell development and selection. Nat Rev Immunol. 2006;6(2):127–135. doi: 10.1038/nri1781. [DOI] [PubMed] [Google Scholar]
- 7.Park H, et al. A distinct lineage of CD4 T cells regulates tissue inflammation by producing interleukin 17. Nat Immunol. 2005;6(11):1133–1141. doi: 10.1038/ni1261. [DOI] [PMC free article] [PubMed] [Google Scholar]
- 8.Harrington LE, et al. Interleukin 17-producing CD4+ effector T cells develop via a lineage distinct from the T helper type 1 and 2 lineages. Nat Immunol. 2005;6(11):1123–1132. doi: 10.1038/ni1254. [DOI] [PubMed] [Google Scholar]
- 9.Murphy KM, Reiner SL. The lineage decisions of helper T cells. Nat Rev Immunol. 2002;2(12):933–944. doi: 10.1038/nri954. [DOI] [PubMed] [Google Scholar]
- 10.Wilson CB, Rowell E, Sekimata M. Epigenetic control of T-helper-cell differentiation. Nat Rev Immunol. 2009;9(2):91–105. doi: 10.1038/nri2487. [DOI] [PubMed] [Google Scholar]
- 11.Miossec P, Kolls JK. Targeting IL-17 and TH17 cells in chronic inflammation. Nat Rev Drug Discov. 2012;11(10):763–776. doi: 10.1038/nrd3794. [DOI] [PubMed] [Google Scholar]
- 12.Dong C. TH17 cells in development: An updated view of their molecular identity and genetic programming. Nat Rev Immunol. 2008;8(5):337–348. doi: 10.1038/nri2295. [DOI] [PubMed] [Google Scholar]
- 13.Littman DR, Rudensky AY. Th17 and regulatory T cells in mediating and restraining inflammation. Cell. 2010;140(6):845–858. doi: 10.1016/j.cell.2010.02.021. [DOI] [PubMed] [Google Scholar]
- 14.Medzhitov R, Horng T. Transcriptional control of the inflammatory response. Nat Rev Immunol. 2009;9(10):692–703. doi: 10.1038/nri2634. [DOI] [PubMed] [Google Scholar]
- 15.Ciofani M, et al. A validated regulatory network for Th17 cell specification. Cell. 2012;151(2):289–303. doi: 10.1016/j.cell.2012.09.016. [DOI] [PMC free article] [PubMed] [Google Scholar]
- 16.Kanno Y, Vahedi G, Hirahara K, Singleton K, O’Shea JJ. Transcriptional and epigenetic control of T helper cell specification: Molecular mechanisms underlying commitment and plasticity. Annu Rev Immunol. 2012;30:707–731. doi: 10.1146/annurev-immunol-020711-075058. [DOI] [PMC free article] [PubMed] [Google Scholar]
- 17.Yang XO, et al. STAT3 regulates cytokine-mediated generation of inflammatory helper T cells. J Biol Chem. 2007;282(13):9358–9363. doi: 10.1074/jbc.C600321200. [DOI] [PubMed] [Google Scholar]
- 18.Schraml BU, et al. The AP-1 transcription factor Batf controls T(H)17 differentiation. Nature. 2009;460(7253):405–409. doi: 10.1038/nature08114. [DOI] [PMC free article] [PubMed] [Google Scholar]
- 19.Brüstle A, et al. The development of inflammatory T(H)-17 cells requires interferon-regulatory factor 4. Nat Immunol. 2007;8(9):958–966. doi: 10.1038/ni1500. [DOI] [PubMed] [Google Scholar]
- 20.Okamoto K, et al. IkappaBzeta regulates T(H)17 development by cooperating with ROR nuclear receptors. Nature. 2010;464(7293):1381–1385. doi: 10.1038/nature08922. [DOI] [PubMed] [Google Scholar]
- 21.Yosef N, et al. Dynamic regulatory network controlling TH17 cell differentiation. Nature. 2013;496(7446):461–468. doi: 10.1038/nature11981. [DOI] [PMC free article] [PubMed] [Google Scholar]
- 22.Dhalluin C, et al. Structure and ligand of a histone acetyltransferase bromodomain. Nature. 1999;399(6735):491–496. doi: 10.1038/20974. [DOI] [PubMed] [Google Scholar]
- 23.Smith SG, Zhou MM. The bromodomain: A new target in emerging epigenetic medicine. ACS Chem Biol. 2016;11(3):598–608. doi: 10.1021/acschembio.5b00831. [DOI] [PMC free article] [PubMed] [Google Scholar]
- 24.Hargreaves DC, Horng T, Medzhitov R. Control of inducible gene expression by signal-dependent transcriptional elongation. Cell. 2009;138(1):129–145. doi: 10.1016/j.cell.2009.05.047. [DOI] [PMC free article] [PubMed] [Google Scholar]
- 25.Hnisz D, et al. Super-enhancers in the control of cell identity and disease. Cell. 2013;155(4):934–947. doi: 10.1016/j.cell.2013.09.053. [DOI] [PMC free article] [PubMed] [Google Scholar]
- 26.Zhang W, et al. Bromodomain-containing protein 4 (BRD4) regulates RNA polymerase II serine 2 phosphorylation in human CD4+ T cells. J Biol Chem. 2012;287(51):43137–43155. doi: 10.1074/jbc.M112.413047. [DOI] [PMC free article] [PubMed] [Google Scholar]
- 27.Bandukwala HS, et al. Selective inhibition of CD4+ T-cell cytokine production and autoimmunity by BET protein and c-Myc inhibitors. Proc Natl Acad Sci USA. 2012;109(36):14532–14537. doi: 10.1073/pnas.1212264109. [DOI] [PMC free article] [PubMed] [Google Scholar]
- 28.Mele DA, et al. BET bromodomain inhibition suppresses TH17-mediated pathology. J Exp Med. 2013;210(11):2181–2190. doi: 10.1084/jem.20130376. [DOI] [PMC free article] [PubMed] [Google Scholar]
- 29.Schröder S, et al. Two-pronged binding with bromodomain-containing protein 4 liberates positive transcription elongation factor b from inactive ribonucleoprotein complexes. J Biol Chem. 2012;287(2):1090–1099. doi: 10.1074/jbc.M111.282855. [DOI] [PMC free article] [PubMed] [Google Scholar]
- 30.Sanchez R, Zhou MM. The role of human bromodomains in chromatin biology and gene transcription. Curr Opin Drug Discov Devel. 2009;12(5):659–665. [PMC free article] [PubMed] [Google Scholar]
- 31.Filippakopoulos P, et al. Selective inhibition of BET bromodomains. Nature. 2010;468(7327):1067–1073. doi: 10.1038/nature09504. [DOI] [PMC free article] [PubMed] [Google Scholar]
- 32.Nicodeme E, et al. Suppression of inflammation by a synthetic histone mimic. Nature. 2010;468(7327):1119–1123. doi: 10.1038/nature09589. [DOI] [PMC free article] [PubMed] [Google Scholar]
- 33.Hammitzsch A, et al. CBP30, a selective CBP/p300 bromodomain inhibitor, suppresses human Th17 responses. Proc Natl Acad Sci USA. 2015;112(34):10768–10773. doi: 10.1073/pnas.1501956112. [DOI] [PMC free article] [PubMed] [Google Scholar]
- 34.Wienerroither S, et al. Regulation of NO synthesis, local inflammation, and innate immunity to pathogens by BET family proteins. Mol Cell Biol. 2014;34(3):415–427. doi: 10.1128/MCB.01353-13. [DOI] [PMC free article] [PubMed] [Google Scholar]
- 35.Chassaing B, Aitken JD, Malleshappa M, Vijay-Kumar M. Dextran sulfate sodium (DSS)-induced colitis in mice. Curr Protoc Immunol. 2014;104(Unit 15):25. doi: 10.1002/0471142735.im1525s104. [DOI] [PMC free article] [PubMed] [Google Scholar]
- 36.Totsuka T, et al. IL-7 Is essential for the development and the persistence of chronic colitis. J Immunol. 2007;178(8):4737–4748. doi: 10.4049/jimmunol.178.8.4737. [DOI] [PubMed] [Google Scholar]
- 37.Powrie F, Leach MW, Mauze S, Caddle LB, Coffman RL. Phenotypically distinct subsets of CD4+ T cells induce or protect from chronic intestinal inflammation in C. B-17 scid mice. Int Immunol. 1993;5(11):1461–1471. doi: 10.1093/intimm/5.11.1461. [DOI] [PubMed] [Google Scholar]
- 38.Bolger AM, Lohse M, Usadel B. Trimmomatic: A flexible trimmer for Illumina sequence data. Bioinformatics. 2014;30(15):2114–2120. doi: 10.1093/bioinformatics/btu170. [DOI] [PMC free article] [PubMed] [Google Scholar]
- 39.Wei L, et al. Discrete roles of STAT4 and STAT6 transcription factors in tuning epigenetic modifications and transcription during T helper cell differentiation. Immunity. 2010;32(6):840–851. doi: 10.1016/j.immuni.2010.06.003. [DOI] [PMC free article] [PubMed] [Google Scholar]
- 40.Trapnell C, Pachter L, Salzberg SL. TopHat: Discovering splice junctions with RNA-Seq. Bioinformatics. 2009;25(9):1105–1111. doi: 10.1093/bioinformatics/btp120. [DOI] [PMC free article] [PubMed] [Google Scholar]
- 41.Anders S, Pyl PT, Huber W. HTSeq--a Python framework to work with high-throughput sequencing data. Bioinformatics. 2015;31(2):166–169. doi: 10.1093/bioinformatics/btu638. [DOI] [PMC free article] [PubMed] [Google Scholar]
- 42.Love MI, Huber W, Anders S. Moderated estimation of fold change and dispersion for RNA-seq data with DESeq2. Genome Biol. 2014;15(12):550. doi: 10.1186/s13059-014-0550-8. [DOI] [PMC free article] [PubMed] [Google Scholar]
- 43.Wallace AC, Laskowski RA, Thornton JM. LIGPLOT: A program to generate schematic diagrams of protein-ligand interactions. Protein Eng. 1995;8(2):127–134. doi: 10.1093/protein/8.2.127. [DOI] [PubMed] [Google Scholar]
- 44.Zeng L, Zhang Q, Gerona-Navarro G, Moshkina N, Zhou MM. Structural basis of site-specific histone recognition by the bromodomains of human coactivators PCAF and CBP/p300. Structure. 2008;16(4):643–652. doi: 10.1016/j.str.2008.01.010. [DOI] [PMC free article] [PubMed] [Google Scholar]
- 45.Zhang G, et al. Down-regulation of NF-κB transcriptional activity in HIV-associated kidney disease by BRD4 inhibition. J Biol Chem. 2012;287(34):28840–28851. doi: 10.1074/jbc.M112.359505. [DOI] [PMC free article] [PubMed] [Google Scholar]
- 46.Nikolovska-Coleska Z, et al. Development and optimization of a binding assay for the XIAP BIR3 domain using fluorescence polarization. Anal Biochem. 2004;332(2):261–273. doi: 10.1016/j.ab.2004.05.055. [DOI] [PubMed] [Google Scholar]
- 47.Huynh K, Partch CL. Analysis of protein stability and ligand interactions by thermal shift assay. Curr Protoc Protein Sci. 2015;79:28.9.1–14. doi: 10.1002/0471140864.ps2809s79. [DOI] [PMC free article] [PubMed] [Google Scholar]
- 48.Otwinowski Z, Minor W. [20] Processing of X-ray diffraction data collected in oscillation mode. Methods Enzymol. 1997;276:307–326. doi: 10.1016/S0076-6879(97)76066-X. [DOI] [PubMed] [Google Scholar]
- 49.Vagin A, Teplyakov A. MOLREP: An automated program for molecular replacement. J Appl Cryst. 1997;30(6):1022–1025. [Google Scholar]
- 50.Murshudov GN, Vagin AA, Dodson EJ. Refinement of macromolecular structures by the maximum-likelihood method. Acta Crystallogr D Biol Crystallogr. 1997;53(Pt 3):240–255. doi: 10.1107/S0907444996012255. [DOI] [PubMed] [Google Scholar]
- 51.Emsley P, Cowtan K. Coot: Model-building tools for molecular graphics. Acta Crystallogr D Biol Crystallogr. 2004;60(Pt 12 Pt 1):2126–2132. doi: 10.1107/S0907444904019158. [DOI] [PubMed] [Google Scholar]


