Significance
Cellular respiration process in dissimilatory metal-reducing bacteria is coupled to electron transfer. In Shewanella species, a decaheme cytochrome MtrF transfers electrons to extracellular insoluble substrates, such as Fe(III) and Mn(III/IV). Using the atomic coordinates of the MtrF crystal structure and analyzing interactions with the protein environments, we calculated the redox potential (Em) values of the 10 hemes in MtrF. The Em profiles show how the electron transfer pathways proceed in MtrF. We showed that, when MtrF is reduced, the direction of the ET pathway switches, and bound flavin becomes the terminal electron acceptor.
Keywords: decaheme, dissimilatory metal-reducing bacteria, flavin, Shewanella species, Mtr conduit
Abstract
In MtrF, an outer-membrane multiheme cytochrome, the 10 heme groups are arranged in heme binding domains II and IV along the pseudo-C2 axis, forming the electron transfer (ET) pathways. Previous reports based on molecular dynamics simulations showed that the redox potential (Em) values for the heme pairs located in symmetrical positions in domains II and IV were similar, forming bidirectional ET pathways [Breuer M, Zarzycki P, Blumberger J, Rosso KM (2012) J Am Chem Soc 134(24):9868–9871]. Here, we present the Em values of the 10 hemes in MtrF, solving the linear Poisson–Boltzmann equation and considering the protonation states of all titratable residues and heme propionic groups. In contrast to previous studies, the Em values indicated that the ET is more likely to be downhill from domain IV to II because of localization of acidic residues in domain IV. Reduction of hemes in MtrF lowered the Em values, resulting in switching to alternative downhill ET pathways that extended to the flavin binding sites. These findings present an explanation of how MtrF serves as an electron donor to extracellular substrates.
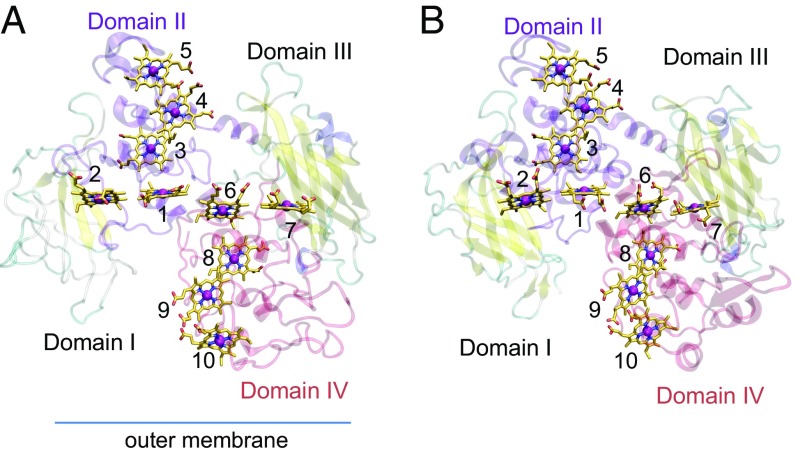
During cellular respiration in many Gram-negative bacteria, ATP synthesis on the inner membrane is coupled to electron transfer (ET). In anaerobic conditions, dissimilatory metal-reducing bacteria can use metal oxides, such as Fe(III) and Mn(III/IV), as the final electron acceptor (1). Because these metal oxides are membrane-impermeant, in Shewanella species, multiheme cytochromes transfer electrons to the metal oxides [e.g., a soluble decaheme cytochrome on the periplasmic side (MtrA), a hypothetical β-barrel porin in the transmembrane region (MtrB), and a multiheme cytochrome on the outer membrane (MtrC) (2)]. The 1.8-Å resolution crystal structure of MtrC shows that domains I and III are both β-barrel domains and structurally similar (Fig. 1) (3). These domains with the extended Greek key split-barrel structures are possible binding sites of flavin mononucleotide (FMN). The crystal structure of the extracellular decaheme cytochrome OmcA shows similar structural features (4).
Fig. 1.
Overview of multiheme cytochromes. (A) The crystal structure of MtrF (5). Hemes 2 and 7 have been proposed to be located near the FMN binding site (5, 6). The orientation of MtrF with respect to the outer membrane was proposed by Clarke et al. (5). α-Helices and β-strands are depicted as purple or red coils and yellow ribbons, respectively. (B) The crystal structure of MtrC (3).
MtrF is a homolog of MtrC as confirmed by the crystal structure of MtrF at 3.2-Å resolution (5), and domains I and III flank the heme binding domains (3, 5, 6). However, domain I contains only two β-strands, whereas domain III is a β-barrel domain (Fig. 1) (figures in ref. 5), a striking difference from the other decaheme cytochromes MtrC and OmcA. In the crystal structure of MtrF, the 10 hemes are located in domains II and IV, forming ET pathways (Fig. 1). Using the protein–protein interface server, Clarke et al. (5) proposed that heme 10 is on the periplasmic side and that heme 5 is solvent-exposed. They also proposed that the two ET pathways that are terminated by heme 2 or 7 may function in reduction of FMN at the binding site (3, 7), whereas the ET pathway that is terminated by heme 5 may be used for direct reduction of extracellular insoluble substrates [e.g., Fe(III)] (5). Insoluble substrates may also be reduced by FMN at the binding site (7, 8). In reduced MtrC, FMN showed pronounced binding affinity compared with oxidized MtrC (3). The absence of the atomic coordinates of FMN in the MtrF crystal structure (5) implies that the crystal is in the oxidized state. In contrast, in the living system, hemes are likely to be in the reduced states because of continuously supplied electrons (9), which lead to pronounced FMN binding affinity and enhance the extracellular ET (10).
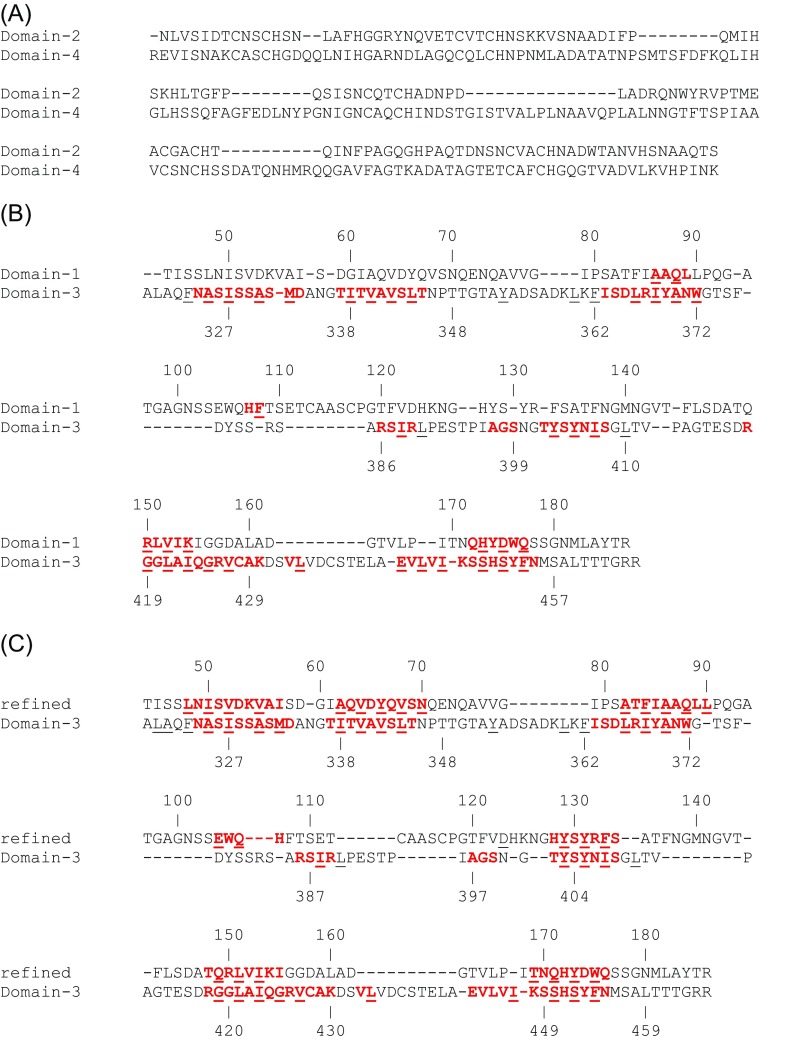
To understand the mechanism of ET in MtrF, the redox potential (Em) values of the 10 heme groups must be determined. Although protein film voltammetry showed that the Em values of the 10 hemes in MtrF range from −44 to −312 mV (5), specific values were not assigned to individual hemes. Breuer et al. (11) calculated the Em values using a thermodynamic integration (TI) approach based on molecular dynamics (MD) simulations. Breuer et al. (11) uniformly added the constant C = −1,567 mV to reproduce the Em range from −44 to −312 mV (5) reported for the hemes in MtrF by protein film voltammetry. Hemes 1 (−41 mV) and 6 (−51 mV) in the middle of the ET chain had the highest Em values, whereas hemes 4 (−266 mV) and 9 (−279 mV) had the lowest Em values, resulting in an ET chain energy profile that was essentially symmetrical (11). However, neither the amino acid sequences nor the locations of charged residues are highly conserved between domains II and IV (5) (Fig. S1).
Fig. S1.
Amino acid sequence alignment using ClustalW. (A) Domains II and IV in MtrF. Sequential alignments of domains I and III of (B) the MtrF crystal structure and (C) the refined structure. Residues oriented toward the inner hydrophobic core are underlined. Residues that form β-strands are shown in red. Only 17 residues in domain I (and 71 residues in domain III) form β-strands in the original MtrF crystal structure, whereas 55 residues in domain I form β-strands in the refined MtrF structure.
Here, we present the Em values of the 10 hemes in MtrF by solving the linear Poisson–Boltzmann equation and considering the protonation states of all titratable residues and heme propionic groups, in which the protonation states change in response to the heme redox states.
Results
Structural Disorder in Domain I of the MtrF Crystal Structure.
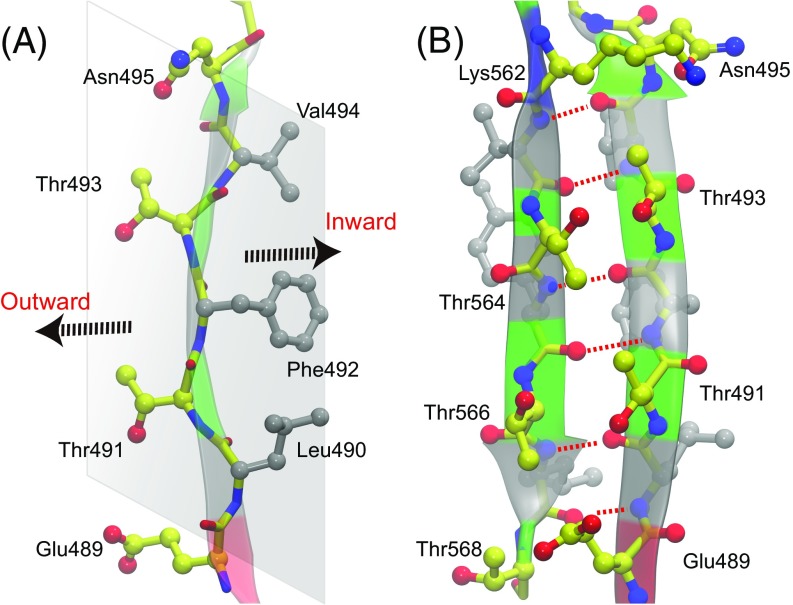
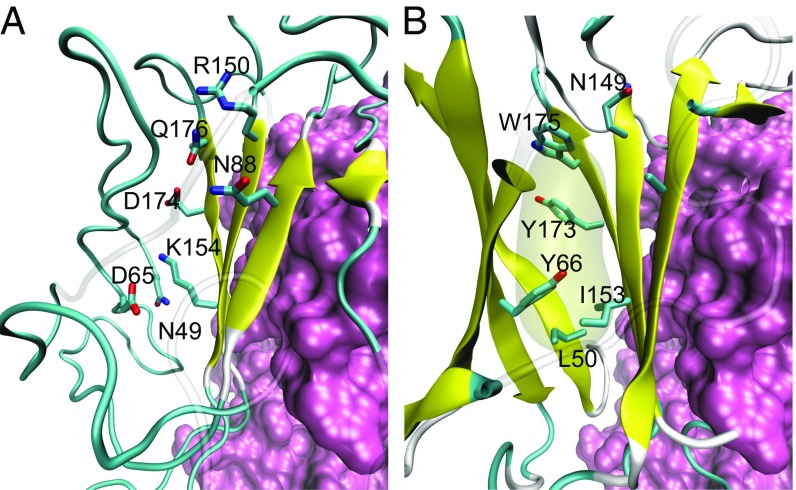
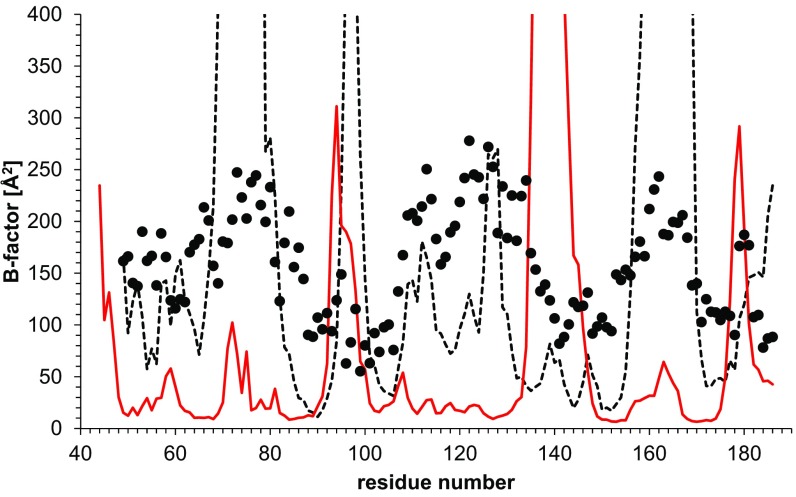
In a split-barrel environment, the nonpolar and polar residues are likely to alternate along the β-strands, with the nonpolar residues oriented inward, forming the hydrophobic core, whereas the polar residues are exposed to the bulk solvent (Fig. S2). Indeed, domain I of MtrF shows the alternating polar/nonpolar pattern as do other decaheme cytochromes. However, we found that, in domain I of the MtrF crystal structure, the hydrophobic residues are oriented toward the bulk solvent (e.g., Leu50, Tyr66, Ile153, Tyr173, and Trp175), whereas the charged and polar residues are oriented toward the protein interior (e.g., Asp65, Asn88, Arg150, Lys154, Asp174, and Gln176) (Fig. 3A and Fig. S1) (5). The MtrF crystal structure (5) shows few interstrand H bonds in the β-barrel domain, a striking difference from the crystal structures of other decaheme cytochromes [e.g., MtrC (3) and OmcA (4)]. To evaluate the structural stability of the MtrF crystal structure, MD simulations were performed before calculating the Em for the hemes in MtrF. The MD simulations, performed using the original atomic coordinates of the MtrF crystal structure (5), suggested significant structural disorder specifically in domain I (Fig. 2).
Fig. S2.
(A) Typical alternating orientations of side chains in a β-strand and (B) hydrogen bonded pairs in the MtrC crystal structure.
Fig. 3.
Orientation of the side chains in domain I of MtrF. (A) The original MtrF crystal structure (PDB ID code 3PMQ), in which charged and polar residues are oriented toward the inner core and hydrophobic residues are exposed to the bulk (5). (B) The refined structure used for Em calculations (solving the linear Poisson–Boltzmann equation).
Fig. 2.
Calculated B factors of the backbone Cα atoms in domain I (residues 44–186) corresponding to the original MtrF crystal structure (black dotted line) or the (domain I replaced) refined structure (red solid line). For comparison, the B factors stated in the PDB file (PDB ID code 3PMQ) are also shown (black circles).
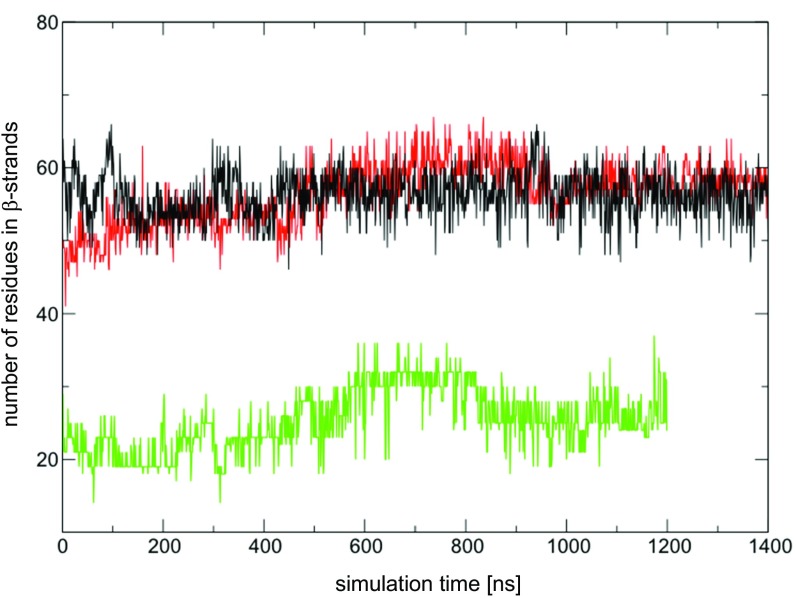
Next, we performed homology modeling as follows. (i) We constructed a sequential alignment with other decaheme cytochromes to reproduce the proper orientations of the polar and nonpolar residues and the location of the interstrand H bond in domain I of MtrF (Fig. S1); (ii) we determined the atomic coordinates of domain I of MtrF using domain I of the MtrC crystal structure at a resolution of 1.8 Å as a template (3). Using the resulting homology model, we conducted MD simulations for structural refinement and verification. We found that the structural disorder of domain I, specifically that of the β-strands, was significantly decreased (Fig. 2) and that the β-barrel structure of domain I was stable (Fig. 3B and Fig. S3) during MD simulations. These results suggest that domain I of MtrF is highly likely to contain a β-barrel structure as identified in the MtrC crystal structure (Fig. 1B). Thus, we replaced domain I of the MtrF crystal structure with the one obtained by 1.0-μs MD simulation and used the structure for the following quantum mechanical/molecular mechanical (QM/MM) calculations.
Fig. S3.
The number of residues that form β-strands in domain I in MD simulations using the original MtrF crystal structure (green lines) or the MtrF crystal structure, where the side chain orientations were corrected in domain I (black lines). For comparison, the number of residues that form β-strands in domain III in MD simulations using the original MtrF crystal structure is also shown (red lines).
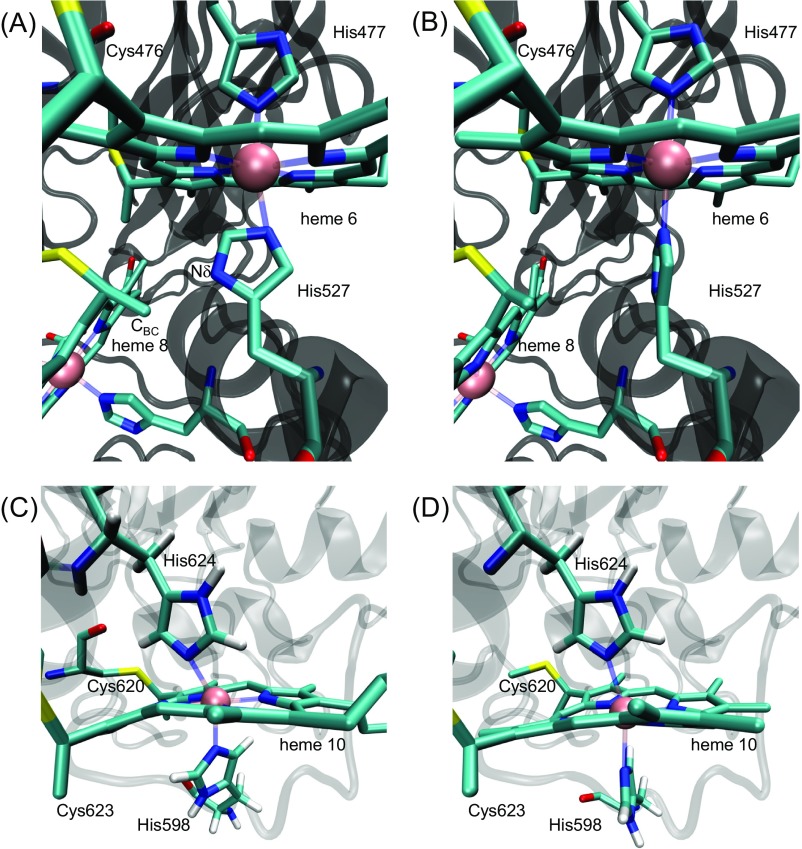
In the MtrF crystal structure, His ligands [e.g., hemes 6 and 10 (Fig. S4)] seemingly cause steric repulsion. The QM/MM calculations showed changes in the geometries of other heme groups in the MtrF. We replaced all 10 bis-histidine ligated c-type heme groups with the QM/MM-optimized geometry (“refined MtrF structure”).
Fig. S4.
Orientation of the His ligands with respect to the heme planes. (A and B) Orientation of the His527 ligand with respect to the heme 6 plane. The Nδ atom of His527 (B-factor values ∼100 Å2), an axial ligand of heme 6, is only 2.7 Å distant from a carbon atom (CBC) of heme 8, seemingly causing steric repulsion. Indeed, QM/MM calculations showed an ∼90° twist of the His527 imidazole ring along the Feheme 8…NεHis527 axis. (A) The original MtrF crystal structure (PDB ID code 3PMQ), in which the Nδ atom of His527 is only 2.7 Å distant from the CBC atom of heme 8. (B) The QM/MM-optimized geometry used for Em calculations in this study. (C and D) Orientations of the His598 ligand with respect to the heme 10 plane. (C) The original MtrF crystal structure (PDB ID code 3PMQ). (D) The QM/MM-optimized geometry used for Em calculations in this study: QM/MM calculations resulted in the ∼90° twist of the His598 imidazole ring along the Feheme 10…NεHis598 axis.
Effect of Structural Modifications on the Em.
The Em values obtained by solving the linear Poisson–Boltzmann equation using the refined MtrF structure were almost the same as those for the MtrF crystal structure (Table S1) (5). Most modifications in the refined structure are in domain I, whereas domains II and IV remain unchanged, except for the bis-histidine ligated c-type heme regions. These results suggest that domain I, which is not the heme binding domain, did not significantly affect the calculated Em values. Below, we refer to the Em values calculated for the refined structure unless otherwise specified (atomic coordinates are in Dataset S1).
Table S1.
Em values obtained using the post-MD structure and the original MtrF crystal structure for oxidized and reduced MtrF (in millivolts)
| Heme | Post-MD structure | Crystal structure | ||
| Oxidized | Reduced | Oxidized | Reduced | |
| 1 | −112 | −231 | −113 | −231 |
| 2 | −94 | −176 | −64 | −176 |
| 3 | −47 | −246 | −5 | −246 |
| 4 | −141 | −290 | −132 | −290 |
| 5 | −178 | −252 | −177 | −252 |
| 6 | −137 | −274 | −135 | −272 |
| 7 | −169 | −185 | −169 | −185 |
| 8 | −214 | −322 | −210 | −320 |
| 9 | −336 | −392 | −332 | −390 |
| 10 | −296 | −277 | −297 | −277 |
Em Values.
Breuer et al. (11) calculated the Em for hemes in oxidized MtrF, where Em for the focusing heme was obtained in the presence of the other nine hemes being in the oxidized states (i.e., oxidized MtrF). In this study, we calculated the Em values for both oxidized and reduced MtrF. The Em values obtained solving the linear Poisson–Boltzmann equation were −47 to −336 mV for oxidized MtrF and −176 to −392 mV for reduced MtrF (Table 1). The calculated Em shifts on changes in the MtrF redox state are consistent with the Em shifts observed in electrochemical analysis (9). These values are in the Em range reported for MtrF based on protein film voltammetry [−44 to −312 mV (5)] or that reported for the MtrCAB complex [0 to −450 mV (12)].
Table 1.
Calculated Em values and factors that determine the Em values for oxidized and reduced MtrF (in millivolts)
| Em | Contribution to Em | |||||
| [Protein volume] | [Charge] | |||||
| Domain | Heme | Oxidized | Reduced | Oxidized | Reduced | |
| II | 5 | −178 | −252 | 60 | −18 | −92 |
| II | 4 | −141 | −290 | 51 | 28 | −121 |
| II | 3 | −47 | −246 | 117 | 56 | −143 |
| II | 2 | −94 | −176 | 49 | 77 | −5 |
| II | 1 | −112 | −231 | 68 | 40 | −79 |
| IV | 6 | −137 | −274 | 79 | 4 | −133 |
| IV | 7 | −169 | −185 | 55 | −4 | −20 |
| IV | 8 | −214 | −322 | 94 | −88 | −196 |
| IV | 9 | −336 | −392 | 34 | −150 | −206 |
| IV | 10 | −296 | −277 | 30 | −106 | −87 |
Contribution of the protein (dielectric) volume corresponds to the Em shift caused by loss of solvation of heme in the protein environment.
Discussion
ET Pathways.
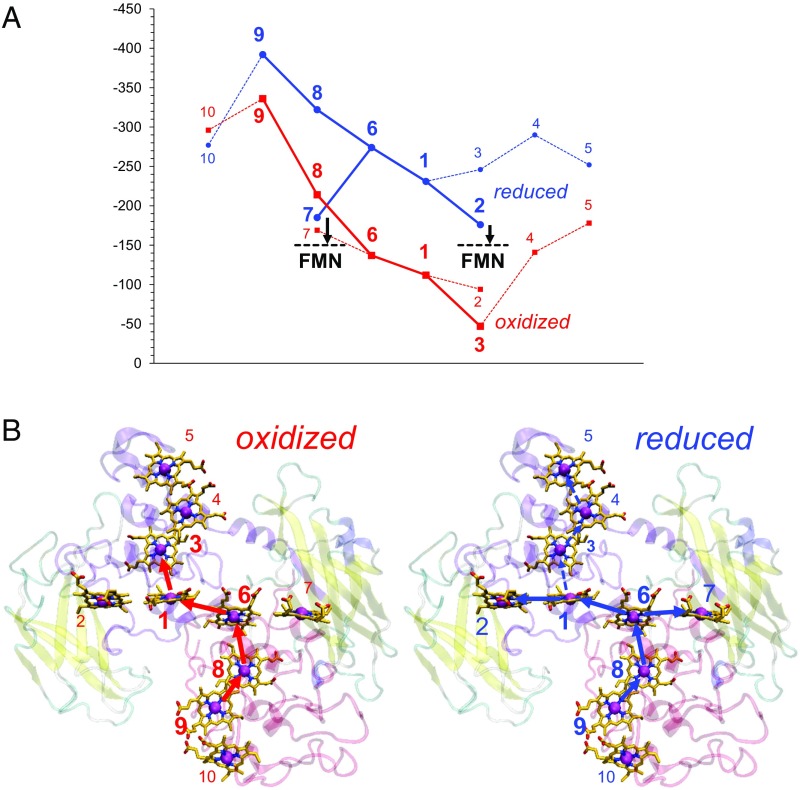
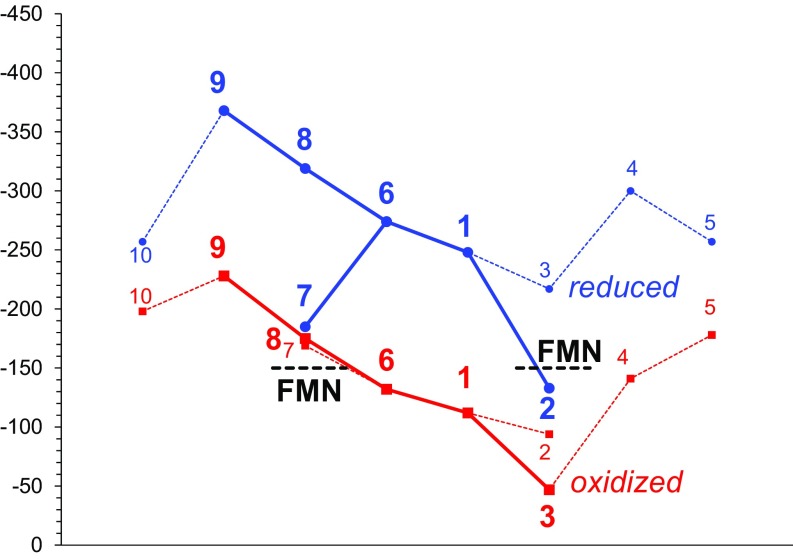
In contrast to the symmetric Em profile reported by Breuer et al. (11), we obtained an Em profile that indicated that the ET is more likely to be downhill from domain IV to II (Fig. 4). In particular, among the heme pairs in domains II and IV, which are located at symmetrical positions with respect to the pseudo-C2 axis, the (heme 4, heme 9) pair has the largest Em difference (ΔEm = 195 mV) (Table 1), and the (heme 3, heme 8) pair has the second largest Em difference (ΔEm = 167 mV). These Em differences (i.e., low Em values for hemes 9 and 8 in domain IV with respect to hemes 3 and 1 in domain II) are mainly caused by the acidic residues at Asp631, Asp518, Asp490 (in domain IV), and Asp377 (in domain III), specifically localized in domain IV (Tables 2 and 3) [e.g., Asp631 decreases the Em for heme 9 by −136 mV (Table S2)]. These acidic residues are not present in the corresponding regions of domain II. Although Breuer et al. (11) also reported that Asp631 decreased the Em for heme 9, the contribution was −1,362 mV, which is unusually large (as discussed later).
Fig. 4.
(A) Em profiles of oxidized (red) and reduced (blue) MtrF. Table 1 shows the Em values. Black dotted lines indicate the Em values for bound FMN (8, 16). (B) Geometry of the ET pathways for (Left) oxidized and (Right) reduced MtrF. Thick solid arrows indicate the main downhill pathways; [hemes 9 → 8 → 6 → 1 → 3] may be more pronounced in reduced MtrF than in oxidized MtrF (dotted arrows).
Table 2.
Residue pairs in domains II and IV that increase Em(heme 4) − Em(heme 9) in oxidized MtrF (in millivolts)
| Residue pairs | Contribution to Em(heme 4) − Em(heme 9) | |
| Domain II | Domain IV | |
| Trp306 | Asp631 | 124 |
| Ser247 | Gly544 | 29 |
| Ile229 | Asp518 | 28 |
Table 3.
Residue pairs in domains II and IV that increase Em(heme 3) − Em(heme 8) in oxidized MtrF (in millivolts)
| Residue pairs | Contribution to Em(heme 3) − Em(heme 8) | |
| Domain II | Domain IV | |
| Arg262 | Ile557 | 88 |
| Ile229 | Asp518 | 74 |
| Asn264 | Ser558 | 46 |
| Trp306 | Asp631 | 43 |
| Gln210 | Asp490 | 28 |
The residue pair Glu102 (Domain I)/Asp377 (Domain IV) also contributes to an increase of 68 mV in Em(heme 3) – Em(heme 8).
Table S2.
Contributions of groups, including titrated propionic groups (-COO−), to the Em reported in this work and that reported by Breuer et al. (11) (in millivolts)
| Heme and groups | Contribution to Em | |
| This work | Breuer et al. (11) | |
| 1 | ||
| Lys237 | 61 | 1,547 |
| Asp192 | −23 | −1,113 |
| 2 | ||
| Asp228 | −61 | −2,280 |
| Lys237 | 70 | 1,478 |
| Arg207 | 39 | 1,466 |
| Lys222 | 116 | 1,312 |
| Heme 1 | 42 | −1,071 |
| -COO− | −23 | n.d. |
| -COO− | −1 | n.d. |
| 3 | ||
| Arg262 | 99 | 1,446 |
| Arg267 | 20 | 1,234 |
| Arg186 | 97 | 1,189 |
| Glu272 | −28 | −1,155 |
| Asp261 | −21 | −1,098 |
| Glu212 | −30 | −1,080 |
| 4 | ||
| Heme 5 | 82 | −1,685 |
| -COO− | −56 | n.d. |
| -COO− | −18 | n.d. |
| Asp305 | −8 | −1,002 |
| 5 | ||
| Asp294 | −21 | −1,135 |
| 6 | ||
| Lys472 | 12 | 1,118 |
| Asp479 | −15 | −1,001 |
| 7 | ||
| Arg488 | 139 | 1,927 |
| Asp518 | −64 | −1,240 |
| Arg381 | 3 | 1,211 |
| Asp490 | −68 | −1,194 |
| heme 6 | 0 | −1,122 |
| -COO− | −26 | n.d. |
| -COO− | 11 | n.d. |
| 8 | ||
| Lys520 | 164 | 1,387 |
| Asp518 | −80 | −1,317 |
| Lys472 | 28 | 1,271 |
| Arg464 | 95 | 1,261 |
| Arg465 | 71 | 1,257 |
| Asp377 | −84 | −1,123 |
| Glu466 | −8 | −1,035 |
| 9 | ||
| Heme 10 | 64 | −1,515 |
| -COO− | −27 | n.d. |
| -COO− | −19 | n.d. |
| Asp631 | −136 | −1,362 |
| Asp593 | −4 | −1,211 |
| Lys634 | 9 | 1,003 |
| 10 | ||
| Arg600 | 26 | 1,484 |
| Asp631 | −111 | −1,410 |
| Glu618 | −9 | −1,114 |
| Asp593 | −5 | −1,009 |
n.d., not determined.
The MtrF crystal structure shows that the Asp631 side chain is oriented toward heme 9 (∼4 Å), which significantly decreases the Em for heme 9 (Table 2). The Em profile along the ET pathways remained downhill, even when titrated in the presence of protonated Asp631 (Fig. S5). This result suggests that the ET pathways could still be downhill, even if the orientation of Asp631 was disordered in the geometry of the MtrF crystal structure and protonated. The symmetric Em profile along the ET pathways proposed by Breuer et al. (11) might be supported if the amino acid sequences of the heme binding domains II and IV were similar. However, the amino acid sequence identity between domains II and IV of MtrF is low (23% using ClustalW) (13) (Fig. S1). Thus, each symmetrical pair of hemes is more likely to have different Em values (Table 1) because of the contributions of different types of residues as shown in Tables 2 and 3.
Fig. S5.
Em profiles titrated in the presence of protonated Asp631 for oxidized (red) and reduced (blue) MtrF.
MtrF, MtrD, and MtrE are homologs of MtrC, MtrA, and MtrB, respectively. In the MtrCAB complex, MtrC has been reported to have higher Em values than MtrA based on electrochemical analysis using cyclic voltammetry (12) [i.e., the ET pathway from MtrA to MtrC is downhill, whereas the ET pathway (Mtr pathway) can also mediate reversible ET (14)]. Considering the analogy between the MtrCAB and MtrFDE complexes (5), the corresponding ET pathway may proceed from MtrD to MtrF. It seems plausible that the ET pathway from domain IV to II is downhill in terms of the location and function of MtrF, which is at the terminus of the intermolecular ET chain via the MtrFDE complex and directly reduces extracellular substrates via hemes 2, 5, or 7 (5, 6). It should also be noted that ET occurs in the uphill ET pathway [e.g., the cytochrome c subunit of photosynthetic reaction centers from Blastochloris viridis (15)]; this fact also suggests that a completely symmetric Em profile (11) is not necessarily required to facilitate the reversible ET (14) in the Mtr conduit.
Switching the ET Pathway in Response to the MtrF Redox State.
In oxidized MtrF, the Em values for hemes increase along the chain of hemes 9, 8, 6 (domain IV), 1, and 3 (domain II), resulting in a downhill ET pathway [hemes 9 → 8 → 6 → 1 → 3] (Fig. 4). In reduced MtrF, the Em values were significantly lower, switching the ET pathway to [hemes 9 → 8 → 6 → 1 → 2] or [hemes 9 → 8 → 6 → 7] (Fig. 4).
Intriguingly, (i) in reduced MtrC, FMN showed pronounced binding affinity compared with oxidized MtrC (3). (ii) Hemes 2 and 7 have been proposed to be located near the FMN binding site (5, 6). (iii) The Em of bounded FMN is not known for MtrF, but for MtrC, it is reported to be ∼–150 mV using differential pulse voltammetry (8, 16). If this Em value holds true for MtrF, bound FMN can serve as an electron acceptor for both hemes 2 and 7 at the terminus of the entire ET pathway (–176 and –185 mV, respectively) (Table 1) when MtrF is reduced (Fig. 4). Notably, in oxidized MtrF, the ET from heme 2 (–94 mV) (Table 1) to FMN [∼–150 mV (8, 16)] is uphill. (iv) Okamoto et al. (8) showed that binding of FMN at the decaheme cytochrome leads to significant enhancement of ET. This finding (i.e., activating the ET pathways [hemes 9 → 8 → 6 → 1 → 2 → FMN] and [hemes 9 → 8 → 6 → 7 → FMN]) fits well with involvement of bound FMN as an electron acceptor (3, 7, 8) when MtrF is reduced in terms of both the Em values and the location of the ET pathway (Fig. 4). MtrF may alter its function by switching the ET pathway in response to the redox environment. Among the 10 hemes, heme 3, which is surrounded by hemes 1, 2, and 4, shows the largest change in Em, –199 mV, in the transition from oxidized MtrF to reduced MtrF (Table 1); this Em shift results in a less uphill, more isoenergetic ET pathway toward heme 5 (Fig. 4). Intriguingly, heme 5 has been proposed to serve as a site that can directly reduce extracellular insoluble substrates (5, 6). Fig. 4 shows that the ET pathway [hemes 9 → 8 → 6 → 1 → 3] may be more pronounced in reduced MtrF than in oxidized MtrF.
Em Reported by Breuer et al.
Electrostatic influence of residues.
In the present study, the ET pathways are downhill along domains IV and II for both reduced and oxidized MtrF, which is caused by the different contributions of the electrostatic influences of domains II and IV to the hemes (Tables 2 and 3). The influence of the protein dielectric volume (SI Discussion) on Em, which decreases the solvation of the heme group and lowers the Em value, is similar in the domain (II, IV) heme pairs [e.g., (heme 4, heme 9) and (heme 3, heme 8)] (Table 1). Thus, the electrostatic influence of residues is the main factor that differentiates the Em values of hemes in domains II and IV.
In the results reported by Breuer et al. (11), residues make unusually large contributions to Em values (e.g., Asp228 decreased the Em for heme 2 by –2,280 mV), whereas it decreased the Em for heme 2 by −61 mV in this study (Table S2). Breuer et al. (11) also listed a number of residues that contributed more than 1,000 mV to the Em shift, which suggests that their Em values for hemes were determined using overestimated electrostatic influences.
Em values obtained using a TI approach.
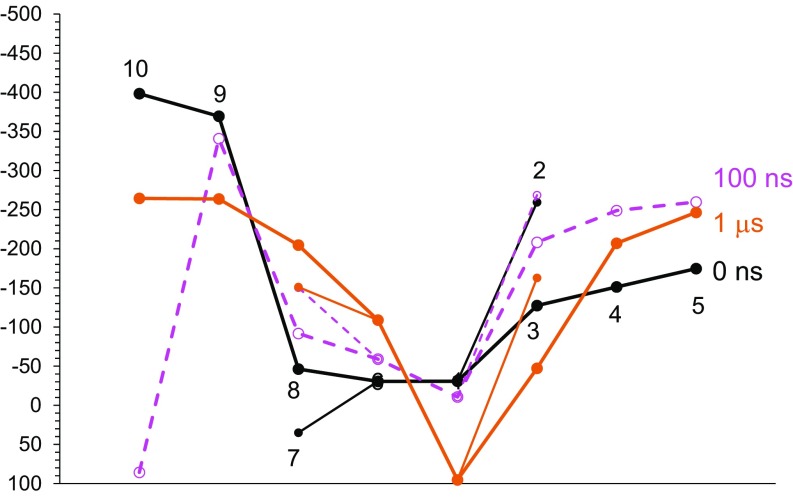
Breuer et al. (11) calculated Em values using a TI approach based on MD simulations. To understand how they determined the Em of MtrF, we also calculated the Em using a TI approach based on the original MtrF crystal structure (not the refined MtrF structure). Notably, our total time for sampling simulation is comparable with that reported by Breuer et al. (11) (Computational Procedures). The Em profiles obtained after equilibrating for 100 ns and 1 μs differ significantly from those reported by Breuer et al. (11) (Fig. 5). In addition, the different Em profiles obtained after equilibrating for 100 ns and 1 μs indicate that the MtrF structure can change even after equilibrating for 100 ns. Breuer et al. (11) equilibrated for only 5 ns. The three different Em profiles obtained using three different equilibration times indicates that the TI approach is not applicable under the conditions used in the previous studies, and either the equilibrating or sampling simulation times must be insufficient. The difficulty in reproducing the Em profiles reported in the previous studies, even with a longer equilibration time, argues against the quality of their calculated Em values.
Fig. 5.
Em profiles obtained for oxidized MtrF using a TI approach based on MD simulations, in which the initial structures were obtained after equilibrating for 0 ns (black), 100 ns (pink), and 1 μs (orange). It should be noted that Breuer et al. (11) uniformly added the constant C = −1,567 mV to reproduce the Em range of −44 to −312 mV (5) reported for the hemes in MtrF. The corresponding constants were 453, 434, and 511 mV after equilibrating for 0 ns, 100 ns, and 1 μs, respectively.
Breuer et al. (11) seem to have used the original atomic coordinates of the MtrF crystal structure, in which domain I contains marked structural disorder (Fig. 2) because of the orientation of the side chains that prevents formation of the β-strands (Figs. 1, 2, and 3). Using the unstable structure may be crucial when calculating the Em using an MD-based TI approach and may contribute to the uncertainty of their calculated Em values.
Breuer et al. (11) fixed the protonation states of the heme propionic groups as permanently ionized, even in the presence of reduced heme groups. Fixation of the protonation states of titratable residues can also be a fundamental problem when using an MD-based TI approach to calculate the Em value, in particular for heme proteins, because the protein structure changes with respect to the original atomic coordinates of the crystal structure to reproduce the initially considered single-protonation pattern of the titratable residues. In addition, the protonation state of the heme propionic group is strongly coupled with the redox state of the heme ring (Table S3) and affects the Em value, which can often explain the pH dependence of the Em for heme (17–19). Fixation of the protonation states of the heme propionic groups (to be ionized) should also overstabilize the oxidized state of heme and lower the Em values. Thus, for Em calculations of heme proteins, it is a prerequisite to reproduce the Henderson–Hasselbalch curve for titratable residues near the heme ring (20), which can be achieved only when the partial protonation state of the heme propionic groups is appropriately considered as shown in a number of electrostatic approaches (17–19).
Table S3.
Protonation probabilities (protonated = 1 and deprotonated = 0) of heme propionic groups (acid A and acid D) in reduced MtrF
| Heme and redox state | Protonation states | |
| Acid A | Acid D | |
| 1 | ||
| Oxidized | 0.00 | 0.96 |
| Reduced | 0.00 | 1.00 |
| 2 | ||
| Oxidized | 0.07 | 0.51 |
| Reduced | 0.38 | 0.58 |
| 3 | ||
| Oxidized | 0.00 | 0.00 |
| Reduced | 0.20 | 0.00 |
| 4 | ||
| Oxidized | 0.76 | 0.28 |
| Reduced | 0.75 | 0.62 |
| 5 | ||
| Oxidized | 0.00 | 0.11 |
| Reduced | 0.46 | 0.38 |
| 6 | ||
| Oxidized | 0.25 | 0.98 |
| Reduced | 0.84 | 1.00 |
| 7 | ||
| Oxidized | 0.27 | 0.00 |
| Reduced | 0.80 | 0.17 |
| 8 | ||
| Oxidized | 0.00 | 0.00 |
| Reduced | 0.00 | 0.00 |
| 9 | ||
| Oxidized | 0.97 | 0.24 |
| Reduced | 0.98 | 0.47 |
| 10 | ||
| Oxidized | 0.31 | 0.18 |
| Reduced | 0.65 | 0.20 |
Although the focusing heme was titrated (i.e., fully oxidized or reduced), the other hemes were in the reduced states.
SI Discussion
The protein dielectric volume (i.e., the space obtained by merging the volumes of the van der Waals spheres of all protein atoms) is a main contributor of “protein hydrophobicity” to the hemes: the protein dielectric volume prevents water molecule access to the hemes and thus, decreases the availability of solvation energy. In particular, the loss of solvation energy significantly destabilizes the oxidized state, increasing the Em.
Conclusions
The Em values for the 10 hemes in MtrF were calculated by solving the linear Poisson–Boltzmann equation and considering the protonation states of all titratable residues and heme propionic groups. The Em profiles calculated show that the ET pathway proceeds downhill from domain IV to II. When MtrF is reduced, the direction of the ET pathway switches, and FMN becomes the terminal electron acceptor. These findings (i.e., switching of the ET pathways to [hemes 9 → 8 → 6 → 1 → 2 → FMN] or [hemes 9 → 8 → 6 → 7→ FMN]) are concordant with FMN acting as the bound electron acceptor (3, 7, 8) when MtrF is reduced.
Computational Procedures
Initial Coordinates and Atomic Partial Charges.
The atomic coordinates of MtrF were taken from the X-ray structure of MtrF of Shewanella oneidensis at a resolution of 3.2 Å [Protein Data Bank (PDB) ID code 3PMQ] (5). H atoms were generated and energetically optimized with CHARMM36 (21), and all titratable groups were kept in their standard protonation states. Atomic partial charges of the amino acids were adopted from the all-atom CHARMM36 (21) parameter set. The atomic charges of the low-spin c-type heme, including histidine and cysteine ligands, were determined by fitting the electrostatic potential in the neighborhood of these molecules by using the restrained electrostatic potential (RESP) procedure (22). The electronic wave functions were calculated after geometry optimization with the unrestricted density functional theory (DFT) method with the B3LYP functional and LACVP* basis sets with the JAGUAR program (23).
Homology Modeling of Domain I in MtrF.
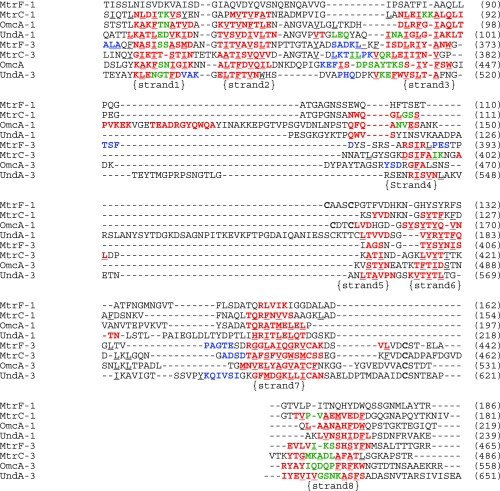
To understand the absence and presence of the β-barrel structure in domain I of the MtrF (5) and MtrC (3) crystal structures, respectively (Fig. 2), we prepared the atomic coordinates where the domain I region in the MtrF crystal structure was reconstructed using a homology modeling approach with the SWISS-MODEL web interface (24). The crystal structure of MtrC from S. oneidensis at a resolution of 1.8 Å (PDB ID code 4LM8) was used as the main structural template of domain I for reconstruction of MtrF (Fig. S1) (3), except for the Lys86 and Lys87 region of MtrC, because the two positively charged residues KK in MtrC are replaced with the single nonpolar residue I− in MtrF and G− in OmcA (Fig. S6). The crystal structure of OmcA at a resolution of 2.7 Å (PDB ID code 4LMH) (4) was used as the main structural template for the corresponding region. The atomic coordinates obtained were used as the initial structure for subsequent MD simulations (Results).
Fig. S6.
Amino acid sequence alignment of domains I and III in MtrF (PDB ID code 3PMQ), MtrC (PDB ID code 4LM8), OmcA (PDB ID code 4LMH), and UndA (PDB ID code 3UFK). Residues that orient toward the inner hydrophobic core in β-strands are underlined. Residues in α-helices (blue), β-strands (red), and disordered strands (green) are also shown.
MD Simulations.
MD simulations were performed for the following two purposes (1): for Em calculations using the linear Poisson–Boltzmann approach [i.e., equilibrating the reconstructed homology model (see above) and obtaining the refined MtrF structure (Results)] (2) and for Em calculations using a TI approach [i.e., equilibrating the unmodified original MtrF crystal structure, as used by Breuer et al. (11), and calculating the Em values using a TI approach]. In both cases, the following procedures were used; for comparison, the protonation states of the titratable residues were identical to those used by Breuer et al. (11). The 10 hemes were oxidized; the acidic groups, including the heme propionic groups, were negatively charged. The basic residues were positively charged, and the histidine residues (except His451) were treated as electrostatically neutral; His451 was positively charged. The respective models were processed as follows: (i) model arrangement in a periodic boundary box, (ii) solvation with TIP3P water models (25), (iii) structural optimization with positional restraints on heavy atoms using the initial structure as a reference, (iv) MD simulation for 1.0 ns with positional restraints with the Berendsen thermostat at 300 K and the barostat at 1.0 bar (26), (v) MD simulation with gradual releasing restraints over 1.0 ns under identical thermostat and barostat conditions, and (vi) production MD run over 1.0 μs with the Nose–Hoover thermostat (27, 28) at 300 K with tt = 0.5 ps and the Parrinnello–Rahman barostat (29) at 1.0 bar with tp = 5.0 ps. All MD simulations above were conducted with an MD engine GROMACS 5.0.7 (30–32) with an adopted CHARMM36 force field (33).
QM/MM Calculations.
We used the Qsite (34) program code. We used the unrestricted DFT method with the B3LYP functional and LACVP* basis sets.
Em Calculation I: Solving the Linear Poisson–Boltzmann Equation.
To obtain the absolute Em values for the protein, we calculated the electrostatic energy difference between the two redox states in a reference model system by solving the linear Poisson–Boltzmann equation with the MEAD program (35) and using a known experimentally measured Em value for bis-histidine ligated heme [−220 mV in water (36)]. The difference in the Em value of the protein relative to the reference system was added to the known Em value. The ensemble of the protonation patterns was sampled by Monte Carlo method with Karlsberg (37). The linear Poisson–Boltzmann equation was solved using a three-step grid-focusing procedure at resolutions of 2.5, 1.0, and 0.3 Å. Monte Carlo sampling yielded the probabilities [Aox] and [Ared] of the two redox states of molecule A. The Em was evaluated using the Nernst equation. A bias potential was applied to obtain an equal amount of both redox states ([Aox] = [Ared]), thereby yielding the redox midpoint potential as the resulting bias potential. To facilitate direct comparisons with previous computational results (19, 38, 39), identical computational conditions and parameters were used. All computations were performed at 300 K, pH 7.0, and an ionic strength of 100 mM (ref. 40 discusses the influence of the ionic strength on the calculated Em values); the dielectric constants were set to 4 for the protein interior (εp) and 80 for water (εw). The size of the εp value depends on what is not included explicitly in the protein model used. Lower εp values (e.g., εp = 1) may be used when all factors that describe electrostatic interactions (e.g., flexibility of the protein structure and flexibility of the protonation states of the protein titratable residues) are considered explicitly (41, 42). Because we have consistently used εp = 4 and εw = 80 and reproduced the experimentally measured Em and pKa values in many redox active proteins [e.g., heme (19) and flavin (38, 39)], εp = 4 seems to be optimal in our computational models.
Em Calculation II: Using TI.
We also calculated the Em using a TI approach as used by Breuer et al. (11). After restraint-releasing simulations, the initial structures for TI simulations were obtained after equilibration for (i) 0 ns, (ii) 100 ns, and (iii) 1 μs. TI simulations were conducted over 10 ns with an MD time step of 2.0 fs, namely Δλ = 2.0 × 10⁻⁷, by reducing a focusing oxidized heme and fixing the protonation states of the other titratable groups. In these simulations, oxidized heme (Fe3+) was gradually reduced (to Fe2+) over 10 ns. The total sampling simulation time used in the previous study by Breuer et al. (11) is comparable with the present study.
Supplementary Material
Acknowledgments
We thank Hideki Sudo for providing QM/MM-optimized geometries of the heme regions. Theoretical calculations were partly performed using the Research Center for Computational Science (Okazaki, Japan). This research was supported by a Grant-in-Aid for the Japan Society for the Promotion of Science (JSPS) Fellows (to H.C.W.); JST CREST (H.I.); JSPS KAKENHI Grants JP15H00864 (to H.I.), JP16H06560 (to H.I.), JP26105012 (to H.I.), and JP26711008 (to H.I.); the Materials Integration for Engineering Polymers of Cross-Ministerial Strategic Innovation Promotion Program (H.I.); and the Interdisciplinary Computational Science Program in Center for Computational Sciences, University of Tsukuba.
Footnotes
The authors declare no conflict of interest.
This article is a PNAS Direct Submission.
This article contains supporting information online at www.pnas.org/lookup/suppl/doi:10.1073/pnas.1617615114/-/DCSupplemental.
References
- 1.Nealson KH, Saffarini D. Iron and manganese in anaerobic respiration: Environmental significance, physiology, and regulation. Annu Rev Microbiol. 1994;48:311–343. doi: 10.1146/annurev.mi.48.100194.001523. [DOI] [PubMed] [Google Scholar]
- 2.Richardson DJ, et al. The ‘porin-cytochrome’ model for microbe-to-mineral electron transfer. Mol Microbiol. 2012;85(2):201–212. doi: 10.1111/j.1365-2958.2012.08088.x. [DOI] [PubMed] [Google Scholar]
- 3.Edwards MJ, et al. Redox linked flavin sites in extracellular decaheme proteins involved in microbe-mineral electron transfer. Sci Rep. 2015;5:11677. doi: 10.1038/srep11677. [DOI] [PMC free article] [PubMed] [Google Scholar]
- 4.Edwards MJ, et al. The X-ray crystal structure of Shewanella oneidensis OmcA reveals new insight at the microbe-mineral interface. FEBS Lett. 2014;588(10):1886–1890. doi: 10.1016/j.febslet.2014.04.013. [DOI] [PubMed] [Google Scholar]
- 5.Clarke TA, et al. Structure of a bacterial cell surface decaheme electron conduit. Proc Natl Acad Sci USA. 2011;108(23):9384–9389. doi: 10.1073/pnas.1017200108. [DOI] [PMC free article] [PubMed] [Google Scholar]
- 6.Brutinel ED, Gralnick JA. Shuttling happens: Soluble flavin mediators of extracellular electron transfer in Shewanella. Appl Microbiol Biotechnol. 2012;93(1):41–48. doi: 10.1007/s00253-011-3653-0. [DOI] [PubMed] [Google Scholar]
- 7.Xu S, Jangir Y, El-Naggar MY. Disentangling the roles of free and cytochrome-bound flavins in extracellular electron transport from Shewanella oneidensis MR-1. Electrochim Acta. 2016;198:49–55. [Google Scholar]
- 8.Okamoto A, Hashimoto K, Nealson KH, Nakamura R. Rate enhancement of bacterial extracellular electron transport involves bound flavin semiquinones. Proc Natl Acad Sci USA. 2013;110(19):7856–7861. doi: 10.1073/pnas.1220823110. [DOI] [PMC free article] [PubMed] [Google Scholar]
- 9.Nakamura R, Ishii K, Hashimoto K. Electronic absorption spectra and redox properties of C type cytochromes in living microbes. Angew Chem Int Ed Engl. 2009;48(9):1606–1608. doi: 10.1002/anie.200804917. [DOI] [PubMed] [Google Scholar]
- 10.Saito J, Hashimoto K, Okamoto A. Flavin as an indicator of the rate-limiting factor for microbial current production in Shewanella oneidensis MR-1. Electrochim Acta. 2016;216:261–265. [Google Scholar]
- 11.Breuer M, Zarzycki P, Blumberger J, Rosso KM. Thermodynamics of electron flow in the bacterial deca-heme cytochrome MtrF. J Am Chem Soc. 2012;134(24):9868–9871. doi: 10.1021/ja3027696. [DOI] [PubMed] [Google Scholar]
- 12.Hartshorne RS, et al. Characterization of an electron conduit between bacteria and the extracellular environment. Proc Natl Acad Sci USA. 2009;106(52):22169–22174. doi: 10.1073/pnas.0900086106. [DOI] [PMC free article] [PubMed] [Google Scholar]
- 13.Higgins DG, Thompson JD, Gibson TJ. Using CLUSTAL for multiple sequence alignments. Methods Enzymol. 1996;266:383–402. doi: 10.1016/s0076-6879(96)66024-8. [DOI] [PubMed] [Google Scholar]
- 14.Ross DE, Flynn JM, Baron DB, Gralnick JA, Bond DR. Towards electrosynthesis in shewanella: Energetics of reversing the mtr pathway for reductive metabolism. PLoS One. 2011;6(2):e16649. doi: 10.1371/journal.pone.0016649. [DOI] [PMC free article] [PubMed] [Google Scholar]
- 15.Chen IP, Mathis P, Koepke J, Michel H. Uphill electron transfer in the tetraheme cytochrome subunit of the Rhodopseudomonas viridis photosynthetic reaction center: Evidence from site-directed mutagenesis. Biochemistry. 2000;39(13):3592–3602. doi: 10.1021/bi992443p. [DOI] [PubMed] [Google Scholar]
- 16.Okamoto A, et al. Cell-secreted flavins bound to membrane cytochromes dictate electron transfer reactions to surfaces with diverse charge and pH. Sci Rep. 2014;4:5628. doi: 10.1038/srep05628. [DOI] [PMC free article] [PubMed] [Google Scholar]
- 17.Voigt P, Knapp EW. Tuning heme redox potentials in the cytochrome C subunit of photosynthetic reaction centers. J Biol Chem. 2003;278(52):51993–52001. doi: 10.1074/jbc.M307560200. [DOI] [PubMed] [Google Scholar]
- 18.Mao J, Hauser K, Gunner MR. How cytochromes with different folds control heme redox potentials. Biochemistry. 2003;42(33):9829–9840. doi: 10.1021/bi027288k. [DOI] [PubMed] [Google Scholar]
- 19.Ishikita H, Knapp E-W. Redox potential of cytochrome c550 in the cyanobacterium Thermosynechococcus elongates. FEBS Lett. 2005;579(14):3190–3194. doi: 10.1016/j.febslet.2005.05.004. [DOI] [PubMed] [Google Scholar]
- 20.Ullmann GM, Knapp E-W. Electrostatic models for computing protonation and redox equilibria in proteins. Eur Biophys J. 1999;28(7):533–551. doi: 10.1007/s002490050236. [DOI] [PubMed] [Google Scholar]
- 21.Brooks BR, et al. CHARMM: A program for macromolecular energy minimization and dynamics calculations. J Comput Chem. 1983;4(2):187–217. [Google Scholar]
- 22.Bayly CI, Cieplak P, Cornell WD, Kollman PA. A well-behaved electrostatic potential based method using charge restraints for deriving atomic charges: The RESP model. J Phys Chem. 1993;97(40):10269–10280. [Google Scholar]
- 23.Schrödinger, LLC 2008. Jaguar (Schrödinger, LLC, New York), Version 7.5.
- 24.Kiefer F, Arnold K, Künzli M, Bordoli L, Schwede T. The SWISS-MODEL Repository and associated resources. Nucleic Acids Res. 2009;37(Database issue):D387–D392. doi: 10.1093/nar/gkn750. [DOI] [PMC free article] [PubMed] [Google Scholar]
- 25.Jorgensen WL, Chandrasekhar J, Madura JD, Impey RW, Klein ML. Comparison of simple potential functions for simulating liquid water. J Chem Phys. 1983;79:926–935. [Google Scholar]
- 26.Berendsen HJC, Postma JPM, Vangunsteren WF, Dinola A, Haak JR. Molecular-dynamics with coupling to an external bath. J Chem Phys. 1984;81(8):3684–3690. [Google Scholar]
- 27.Nose S. A unified formulation of the constant temperature molecular-dynamics methods. J Chem Phys. 1984;81(1):511–519. [Google Scholar]
- 28.Hoover WG, Holian BL. Kinetic moments method for the canonical ensemble distribution. Phys Lett A. 1996;211(5):253–257. [Google Scholar]
- 29.Parrinello M, Rahman A. Crystal-structure and pair potentials - a molecular-dynamics study. Phys Rev Lett. 1980;45(14):1196–1199. [Google Scholar]
- 30.Bjelkmar P, Larsson P, Cuendet MA, Hess B, Lindahl E. Implementation of the CHARMM force field in GROMACS: Analysis of protein stability effects from correction maps, virtual interaction sites, and water models. J Chem Theory Comput. 2010;6(2):459–466. doi: 10.1021/ct900549r. [DOI] [PubMed] [Google Scholar]
- 31.Pronk S, et al. GROMACS 4.5: A high-throughput and highly parallel open source molecular simulation toolkit. Bioinformatics. 2013;29(7):845–854. doi: 10.1093/bioinformatics/btt055. [DOI] [PMC free article] [PubMed] [Google Scholar]
- 32.Abraham MJ, et al. GROMACS: High performance molecular simulations through multi-level parallelism from laptops to supercomputers. SoftwareX. 2015;1–2:19–25. [Google Scholar]
- 33.Best RB, et al. Optimization of the additive CHARMM all-atom protein force field targeting improved sampling of the backbone φ, ψ and side-chain χ(1) and χ(2) dihedral angles. J Chem Theory Comput. 2012;8(9):3257–3273. doi: 10.1021/ct300400x. [DOI] [PMC free article] [PubMed] [Google Scholar]
- 34.Schrödinger, LLC 2012. QSite (Schrödinger, LLC, New York), Version 5.8.
- 35.Bashford D, Karplus M. pKa’s of ionizable groups in proteins: Atomic detail from a continuum electrostatic model. Biochemistry. 1990;29(44):10219–10225. doi: 10.1021/bi00496a010. [DOI] [PubMed] [Google Scholar]
- 36.Wilson GS. Electrochemical studies of porphyrin redox reactions as cytochrome models. Bioelectrochem Bioenerg. 1983;1:172–179. [Google Scholar]
- 37.Rabenstein B, Knapp EW. Calculated pH-dependent population and protonation of carbon-monoxy-myoglobin conformers. Biophys J. 2001;80(3):1141–1150. doi: 10.1016/S0006-3495(01)76091-2. [DOI] [PMC free article] [PubMed] [Google Scholar]
- 38.Ishikita H. Influence of the protein environment on the redox potentials of flavodoxins from Clostridium beijerinckii. J Biol Chem. 2007;282(35):25240–25246. doi: 10.1074/jbc.M702788200. [DOI] [PubMed] [Google Scholar]
- 39.Ishikita H, Eger BT, Okamoto K, Nishino T, Pai EF. Protein conformational gating of enzymatic activity in xanthine oxidoreductase. J Am Chem Soc. 2012;134(2):999–1009. doi: 10.1021/ja207173p. [DOI] [PMC free article] [PubMed] [Google Scholar]
- 40.Ishikita H, Knapp E-W. Oxidation of the non-heme iron complex in photosystem II. Biochemistry. 2005;44(45):14772–14783. doi: 10.1021/bi051099v. [DOI] [PubMed] [Google Scholar]
- 41.Schutz CN, Warshel A. What are the dielectric “constants” of proteins and how to validate electrostatic models? Proteins. 2001;44(4):400–417. doi: 10.1002/prot.1106. [DOI] [PubMed] [Google Scholar]
- 42.Warshel A, Sharma PK, Kato M, Parson WW. Modeling electrostatic effects in proteins. Biochim Biophys Acta. 2006;1764(11):1647–1676. doi: 10.1016/j.bbapap.2006.08.007. [DOI] [PubMed] [Google Scholar]
Associated Data
This section collects any data citations, data availability statements, or supplementary materials included in this article.


