Abstract
Microglia are damage sensors for the central nervous system (CNS), and the phagocytes responsible for the routine non-inflammatory clearance of dead brain cells1. Here we show that the TAM receptor tyrosine kinases Mer and Axl2 regulate these microglial functions. We find that mice deficient in microglial Mer and Axl exhibit a marked accumulation of apoptotic cells (ACs) specifically in neurogenic regions of the adult CNS, and that microglial phagocytosis of the ACs generated during adult neurogenesis3,4 is normally driven by both TAM receptor ligands – Gas6 and Protein S5. Live two-photon imaging demonstrates that the microglial response to brain damage is also TAM-regulated, as TAM-deficient microglia display reduced process motility and delayed convergence to sites of injury. Finally, we show that microglial expression of Axl is prominently up-regulated in the inflammatory environment that develops in a mouse model of Parkinson’s disease6. Together, these results establish TAM receptors as both controllers of microglial physiology and potential targets for therapeutic intervention in CNS disease.
Keywords: adult neurogenesis, apoptotic cells, Axl, Mer, neurodegeneration, phagocytosis, phagoptosis, microglia
Microglia, the tissue macrophages of the brain and spinal cord, play fundamental roles in CNS homeostasis. They are mobilized in response to nearly any CNS perturbation, and can act to both resolve and exacerbate CNS disease1,7. Their importance notwithstanding, the signaling systems that regulate microglial function are only beginning to be deciphered. We asked whether the TAM receptor tyrosine kinases might comprise one such system. These receptors – Tyro3, Axl, and Mer – regulate the innate immune response in dendritic cells and macrophages2,8,9, mediate the engulfment of apoptotic cells by phagocytes10-12, promote the infection of cells by enveloped viruses13, and contribute to the growth and metastasis of human cancers14. In the CNS, Tyro3 is abundant in neurons15,16, while Mer and Axl are present in microglia17-19.
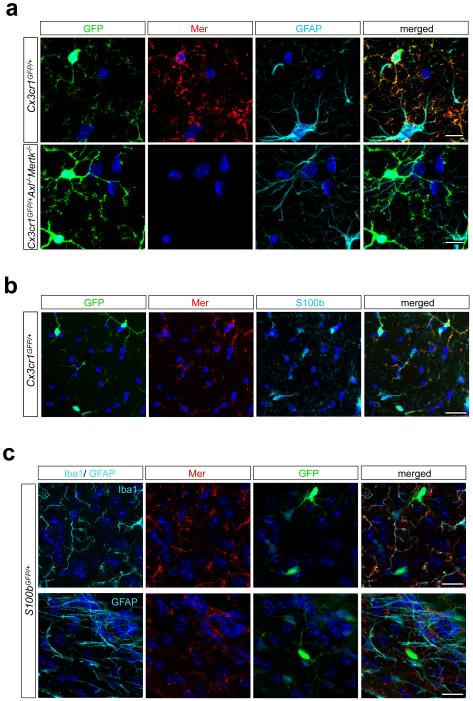
Microglia express the fractalkine receptor Cx3cr1 and the ionized calcium-binding adaptor Iba120,21. We therefore used Mer, Axl, glial fibrillary acidic protein (GFAP), and S100b antibodies to stain adult brain sections from Cx3cr1GFP/+ and S100bGFP/+ mice22 (see Methods). Mer co-localized with GFP+ microglia and not with GFAP+ astrocytes or S100b+ cells in Cx3cr1GFP/+ mice (Extended Data Fig. 1a, b); and with Iba1 in wild-type (WT) and S100bGFP/+ mice (Extended Data Fig. 1c). We do not exclude Mer expression in adult astrocytes (as seen for neonatal astrocytes23) at levels below immunohistochemical detection, but microglia abundantly express Mertk mRNA17, and Mer/CD64 is now the definitive marker pair for all tissue macrophages17. We detected only low Axl expression in the CNS. As shown below, this expression is elevated in inflammatory environments.
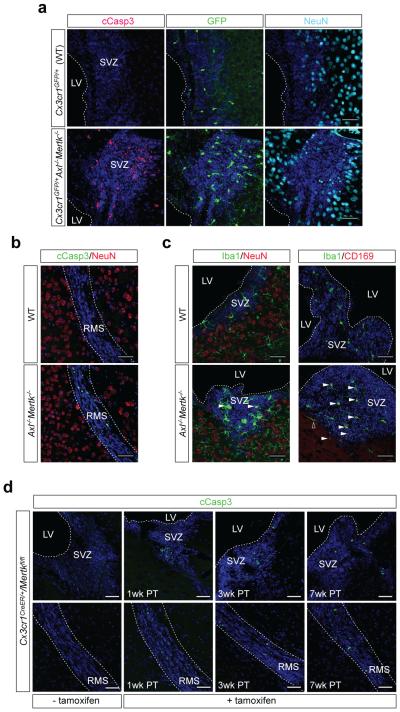
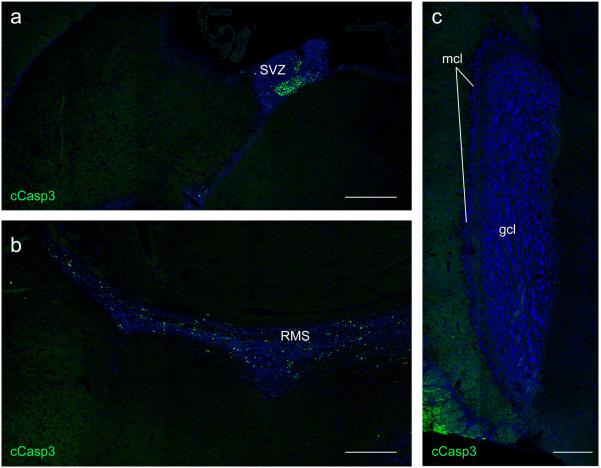
The best-studied role for TAM receptors is the phagocytic clearance of apoptotic cells (ACs)2,10-12. We therefore asked if Mer and Axl were required for clearance of the ACs generated during adult neurogenesis, which occurs in the subgranular zone (SGZ) of the dentate gyrus and the subventricular zone (SVZ) abutting the lateral ventricle, and produces neurons that integrate into the hippocampus and olfactory bulb (OB), respectively3. We used CLARITY with Cx3cr1GFP/+ mice to show that the SVZ, like the rest of the CNS1, is tiled by microglia (see Supplementary Video 1). During neurogenesis in the mouse SGZ, ~80% of cells die within 8 days of their birth4. These corpses are rapidly cleared by microglia, such that ACs are difficult to detect in a healthy brain4. Indeed, when we examined SVZ sections from Cx3cr1GFP/+ brains using cleaved caspase 3 (cCasp3) as an AC marker5, we were unable to detect even a single cCasp3+ cell in many sections (Fig. 1a). In striking contrast, the Axl−/−Mertk−/−Cx3cr1GFP/+ SVZ was studded with cCasp3+ cells (Fig. 1a), which were negative for the neuronal marker NeuN (Fig. 1a). Uncleared ACs extended into the Axl−/−Mertk−/− rostral migratory stream (RMS), the pathway through which newborn cells migrate to the OB (Fig. 1b). ACs were confined to Axl−/−Mertk−/− neurogenic regions, however, and were not seen elsewhere in the CNS (Extended Data Fig. 2). Microglia in the Axl−/−Mertk−/− SVZ and RMS displayed elevated expression of GFP (controlled by the Cx3cr1 promoter), Iba1, and Siglec-1 (CD169), as well as an ‘activated amoeboid’ morphology1 (Fig. 1a, c).
Figure 1.
TAM signaling mediates microglial phagocytosis of ACs in brain neurogenic regions. a, SVZ sections adjacent to the LV of WT (top row) or Axl−/−Mertk−/− (bottom row) Cx3cr1GFP/+ brains visualized for GFP (green, 2nd column), cCasp3 (magenta, 1st column), and NeuN (cyan, 3rd column). b, RMS of WT (top) and Axl−/−Mertk−/− brains (bottom) immunostained for cCasp3 (green) and NeuN (red). c, Immunostaining of WT (top) and Axl−/−Mertk−/− SVZ (bottom) with anti-Iba1 (green) and anti-NeuN (red) (left panels) or anti-Iba1 (green) and anti-CD169 (red) (right panels). Arrowheads mark Iba1+ microglia with an amoeboid morphology (lower left) and Iba1+CD169+ double-positive microglia (lower right); open arrowhead is an Iba1+CD169− cell outside the SVZ. d, No cCasp3+ ACs accumulate in the SVZ (top) or RMS (bottom) of Cx3cr1CreER/+Mertkfl/fl mice 1 wk after vehicle injection (− tamoxifen, 1st panels), but many are evident in the SVZ and RMS at 1, 3, and 7 wks after injection with vehicle + tamoxifen to induce Cre expression in Cx3cr1+ microglia (+ tamoxifen, 2nd, 3rd, and 4th panels, respectively). All a-d sections co-stained with nuclear Hoechst 33258 (blue). Representative images from analyses performed in 3 (a, b, d) and 2 (c) mice. Scale bars 50 μm.
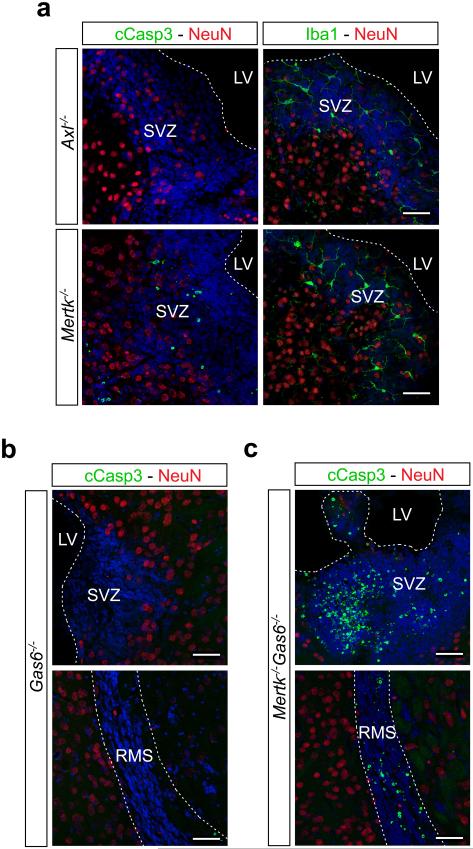
Consistent with the minimal expression of Axl, no AC accumulation was detected in the Axl−/− SVZ (Extended Data Fig. 3a). In contrast, the Mertk−/− SVZ contained many cCasp3+ ACs, although this number was ~4-fold lower than that seen in Axl−/−Mertk−/− double mutants (Extended Data Fig. 3a). We counted 733 ± 359 cCasp3+ cells/mm2 (±SEM) in sections of the Mertk−/− SVZ, and 2942 ± 262 cCasp3+ cells/mm2 in the Axl−/−Mertk−/− SVZ. This synergistic effect of an Axl mutation on the background of an existing Mertk mutation has been noted previously2,5,8,9,12.
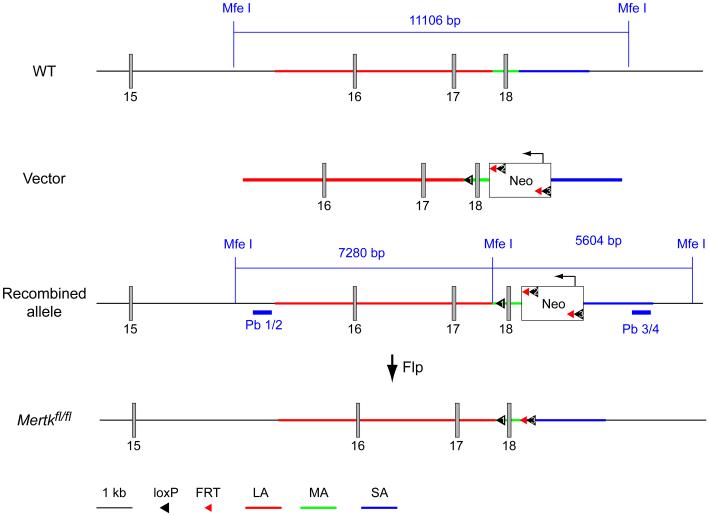
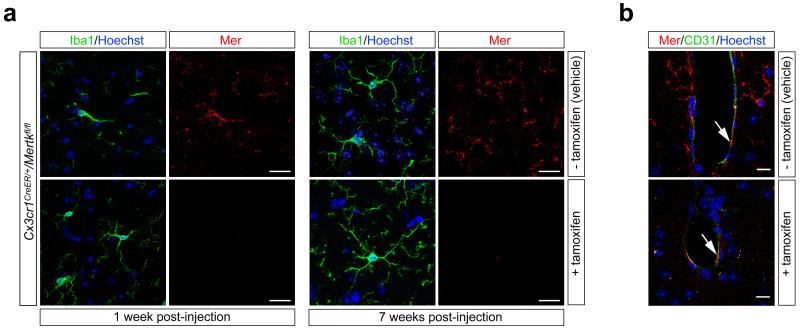
We demonstrated that AC accumulation in the Mertk−/− SVZ and RMS is due to the loss of Mer specifically from microglia, by analyzing a new mouse line carrying conditional ‘floxed’ alleles of the Mertk gene (Extended Data Fig. 4; see Methods) crossed to a tamoxifen-inducible estrogen receptor (ER) Cre driver controlled by the Cx3cr1 promoter24. In the absence of tamoxifen (upon vehicle injection alone), Mer was present in Cx3cr1CreER/+/Mertkfl/fl Iba1+ microglia (Extended Data Fig. 5a), and there were no cCasp3+ ACs in the SVZ or RMS (Fig. 1d). However, 1 week after tamoxifen injection, microglial Mer expression was lost (Extended Data Fig. 5a), and AC accumulation, comparable to that seen in Mertk−/− mice, was detected in the Cx3cr1CreER/+/Mertkfl/fl SVZ and RMS (Fig. 1d). Microglia remained Mer-negative (Extended Data Fig. 5a), and AC accumulation was maintained, at 3 and 7 weeks after tamoxifen injection (Fig. 1d), by which time most Cx3cr1CreER/+ gene-deleted cells outside the CNS have been replaced by monocytes and/or hematopoietic progenitors24. Mer expression in brain microvascular endothelial cells23, an important Mer reservoir in the CNS25, persisted following tamoxifen treatment (Extended Data Fig. 5b).
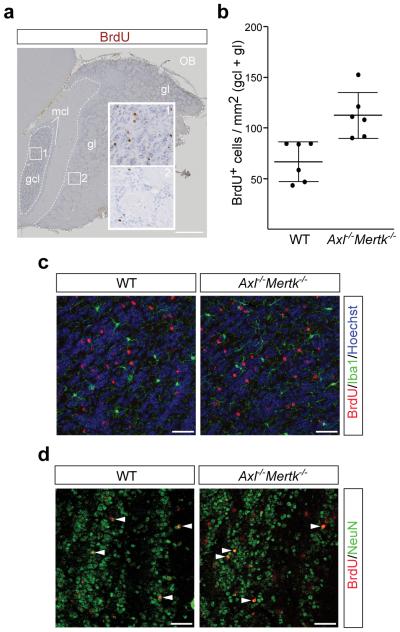
We assessed the consequences of defective AC clearance on neurogenesis by pulse labeling dividing cells in the adult SVZ with bromodeoxyuridine (BrdU), and then counting BrdU+ cells that had migrated to the granule cell and glomerular layers of the OB 35 d after the pulse (Fig. 2a, b). We found that AC accumulation in the Axl−/−Mertk−/− SVZ did not reduce the number of BrdU+ cells in the OB, none of which were apoptotic (Extended Data Fig. 2c) or microglia (Fig. 2c). Indeed, we observed a remarkable ~70% increase in the number of BrdU+ cells in the Axl−/−Mertk−/− OB relative to WT (Fig. 2b). This translated into an increased cellular density in the combined granule cell and glomerular layers of the Axl−/−Mertk−/− OB, from 87.7 ± 2.2 nuclei/104 μm2 (± SEM) in WT to 99.8 ± 2.4 for the double mutants (n = 6 for both genotypes; p = 0.004). These results are consistent with the hypothesis that a fraction of PtdSer-expressing but nonetheless viable SVZ-derived cells are normally ‘eaten alive’ by microglia, in a process termed ‘phagoptosis’26, that this process occurs continuously in a non-pathogenic environment, and that it is TAM-dependent. Many of the BrdU+ cells that had migrated to the Axl−/−Mertk−/− OB were NeuN+ (Fig. 2d), and some expressed markers appropriate to their location (Extended Data Fig. 6a, b).
Figure 2.
TAM signaling mediates ‘death by phagocytosis’. a, Axl−/−Mertk−/− OB section five weeks after BrdU pulse labeling, visualized with an anti-BrdU antibody (brown). The granule cell layer (gcl), glomerular layer (gl), and mitral cell layer (mcl) are indicated, and regions of the gcl (1) and gl (2) are enlarged. Scale bar 500 μm. b, Quantification of BrdU+ cells per mm2 in the gcl and gl of 6 WT versus 6 Axl−/−Mertk−/− mice; Graph plots average ± SEM; Two-tailed unpaired Mann Whitney p=0.002. c, BrdU+ cells in the gcl 35 days after injection of BrdU (red) are negative for Iba1 (green) in WT (left panel) and Axl−/−Mertk−/− (right panel) mice. d, Similar gcl sections stained with anti-BrdU (red) and NeuN (green). Arrowheads mark NeuN+BrdU+ cells. Panels in c co-stained with Hoechst 33258. Scale bars (c, d) 50 μm. Representative images of n = 2 per genotype.
Genetic analyses in vivo indicated that both Protein S (Pros1) and Gas6 function as Mer agonists for AC engulfment by microglia. The Gas6−/− SVZ displayed a WT phenotype (Extended Data Fig. 3b), as did the SVZ of Gas6−/−Pros1fl/− mice, in which one Pros1 allele is ‘floxed’ with loxP sites and the other is inactivated27. (The complete Pros1−/− knock-out is embryonic lethal27.) In marked contrast, Gas6−/−Mertk−/− mice displayed a dramatic accumulation of cCasp3+ cells in the SVZ and RMS, comparable to that seen in Axl−/−Mertk−/− mice (Extended Data Fig. 3c). We counted 3638 ± 282 cCasp3+ cells/mm2 (±SEM) in the Gas6−/−Mertk−/− mice SVZ. This is consistent with the fact that Pros1, the only TAM ligand remaining in the Gas6−/−Mertk−/− mice, does not activate Axl5, the only microglial TAM receptor remaining in these mice. Thus, as for Mer-dependent phagocytosis in the retina10, only half the WT level of only a single TAM ligand was sufficient to drive WT levels of microglial phagocytosis.
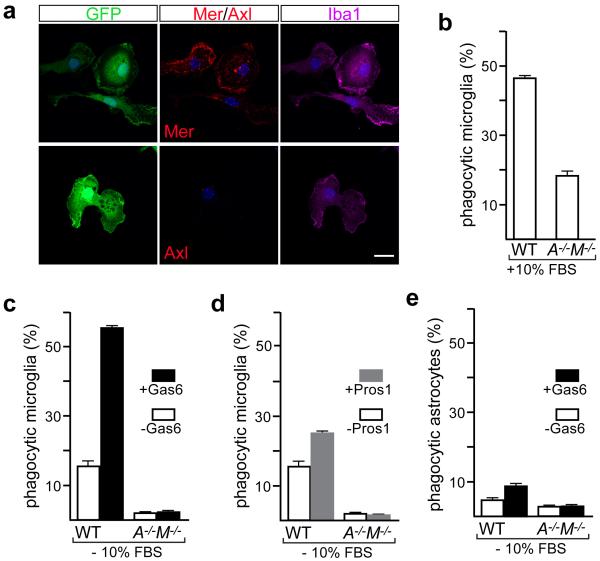
We also quantified AC phagocytosis by microglia cultured from Cx3cr1GFP/+ mice12 (Extended Data Fig. 7a). When incubated with ACs12 in medium containing 10% serum, where Pros1 is present at ~30 nM, WT microglia were vigorous phagocytes (Extended Data Fig. 7b). Phagocytosis was reduced in Axl−/−Mertk−/− cells (Extended Data Fig. 7b). In serum-free medium, AC phagocytosis was further reduced, and most of this was TAM-dependent (Extended Data Fig. 7c, d). (This TAM dependence is consistent with the fact that microglia express endogenous Gas6 and Pros1 mRNA17.) When we supplemented serum-free medium with Pros1 or Gas6, we found that both stimulated TAM-dependent phagocytosis (Extended Data Fig. 7c, d). Cultured astrocytes engulfed ACs much less avidly than microglia, and this phagocytosis could be stimulated only modestly by Gas6 (Extended Data Fig. 7e). Stimulation of microglial phagocytosis by both Gas6 and Pros1 demonstrates that it is mediated principally by Mer, since Axl is activated only by Gas65,12.
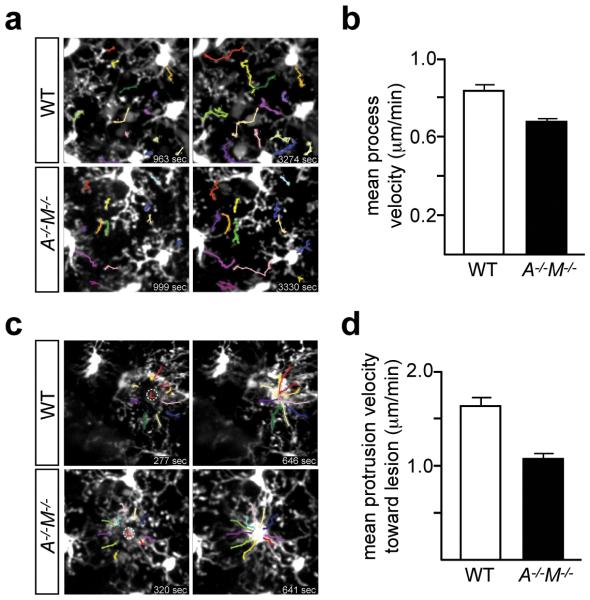
Although microglia in an uninjured brain are essentially fixed in position, their processes are in constant motion, and survey the entirety of the CNS parenchyma every few hours28. Since process extension is also required for phagocytosis12, we asked if TAM signaling regulates microglial extension velocity. We used in vivo two-photon microscopy to measure the movement of microglial processes outside of the neurogenic regions - in the visual cortex of WT Cx3cr1GFP/+ and Axl−/−Mertk−/−Cx3cr1GFP/+ mice (Supplementary Videos 2, 3). Selected video stills, with individual WT and Axl−/−Mertk−/− processes tracked during imaging, are shown in Fig. 3a. These measurements demonstrated that Axl−/−Mertk−/− microglia, in an uninjured brain, display a ~19% reduction in process extension velocity relative to WT (Fig. 3b). We also assessed whether TAM signaling was required for microglial responses to injury. We disrupted the blood-brain barrier at the level of individual capillaries with a laser lesion28, and then measured the velocity of microglial process extension toward the lesion site using live two-photon imaging (Supplementary Videos 4, 5). Selected video stills, with individual extensions toward the lesion tracked in WT and Axl−/−Mertk−/− Cx3cr1GFP/+ brains, are shown in Fig. 3c. We found that extension toward the laser lesion was ~39% slower in the Axl−/−Mertk−/− microglia (Fig. 3d). These results demonstrate that routine microglial process activity and the response to injury are both TAM regulated. They are consistent with the finding that Mertk−/− macrophages exhibit compromised cellular migration and a disrupted cytoskeleton in vitro29.
Figure 3.
TAM signaling regulates microglial process extension velocity and response to vascular injury. a, Two video stills for WT (top row) and Axl−/−Mertk−/− (A−/−M−/−, bottom row) Cx3cr1GFP/+ mice, with tracking of individual GFP-labeled processes (color-coded) in the unperturbed visual cortex, by live two-photon imaging. Stills are from Supplementary Videos 2 (WT) and 3 (A−/−M−/−), and indicated times are from the start of the video. b, Mean process velocity (± SEM) in the absence of perturbation. n = 53 measurements in 3 WT mice, and n = 42 measurements in 3 A−/−M−/− mice; Two-tailed unpaired Mann Whitney p= 0.0004. c, Two video stills for WT (top row) and A−/−M−/− (bottom row) Cx3cr1GFP/+ mice, illustrating microglial process tracking (color-coded) toward a laser-induced rupture of a brain microvessel (circled L) by two-photon imaging. Stills are from Supplementary Videos 4 (WT) and 5 (A−/−M−/−), and indicated times are from the generation of the laser lesion. d, Mean process extension velocity (± SEM) toward the lesion site. n = 20 measurements performed in 2 WT mice and n = 30 measurements performed in 3 A−/−M−/− mice; Two-tailed unpaired Mann Whitney p= < 0.0001.
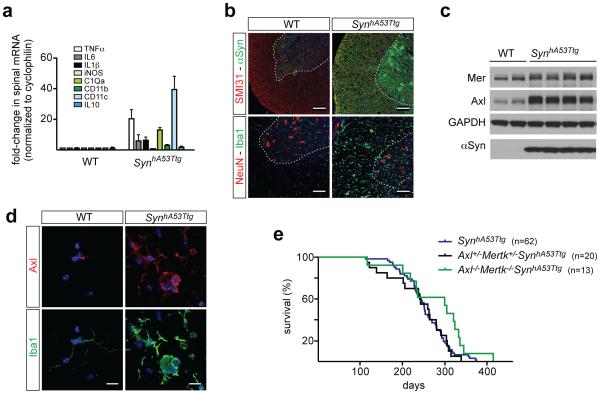
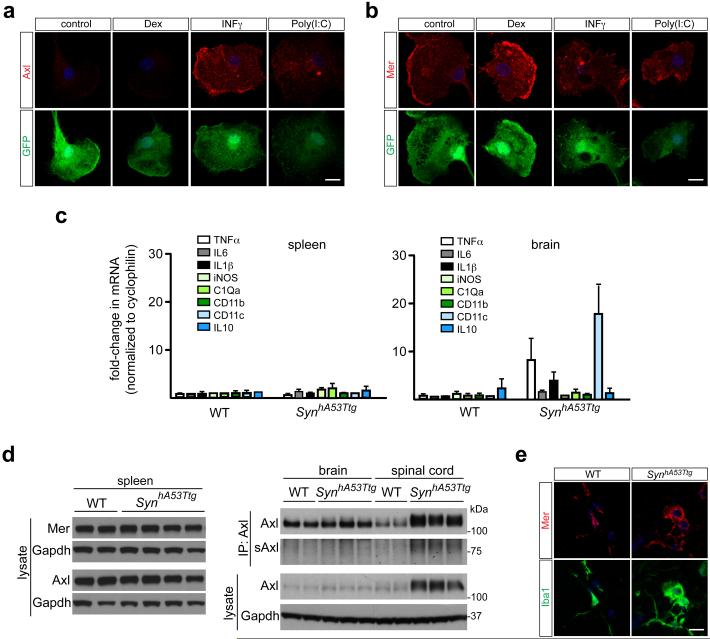
For many macrophages, Axl and Mer segregate to inflammatory and tolerogenic environments, respectively12. Inflammatory stimuli such as poly(I:C) and IFNγ up-regulate Axl expression, while immunosuppressive drugs such as dexamethasone up-regulate Mer12. We saw similar responses in cultured microglia (Extended Data Fig. 8a, b). As Axl is an inflammatory marker, we asked whether its microglial expression might be elevated in neurodegenerative disease1, and examined a transgenic mouse model for Parkinson’s disease (PD). In this model, an alanine(53)-to-threonine (A53T) mutant form of human α-synuclein (SynhA53T), which leads to a hereditary form of PD, is expressed in neurons, most prominently in the spinal cord6. Measurement of a panel of inflammatory marker mRNAs demonstrated that the spinal cords, and to a lesser extent the brains, of aged Thy1-SynhA53Ttg transgenic mice displayed elevation of these markers, while inflammation was undetectable in the spleen (Fig. 4a, Extended data Fig. 8c).
Figure 4.
Microglial Axl is up-regulated in a mouse model of Parkinson’s disease. a, Comparison of the mean expression (± SEM) of the indicated inflammatory mediator/marker mRNAs in the spinal cords of 3 WT and 3 Thy1-SynhA53Ttg (SynhA53Ttg) mice at 8-10 months. b, Sections from the spinal cords of aged (8-9 month) WT (left column) and SynhA53Ttg (right column) mice, immunostained for phosphorylated neurofilament (SMI31) and α-synuclein (top panels), or NeuN and Iba1 (bottom panels). The α-synuclein antibody recognizes both the endogenous mouse protein and the transgenic human protein. Scale bars 100 μm. c, Western blots of spinal cord extracts from 2 WT mice (lanes 1, 2) and 4 SynhA53Ttg mice (lanes 3-6) for the indicated proteins at 9-10 months age, with GAPDH as a loading control. d, Sections from WT (left column) and SynhA53Ttg (right column) spinal cords immunostained with anti-Axl (top row) and anti-Iba1 (bottom row) antibodies. Scale bar 10 μm. e, Kaplan-Meier survival curves for mice of the indicated genotypes. n=62 SynhA53Ttg mice, n=20 A+/−M+/− SynhA53Ttg and n=13 A−/−M−/− SynhA53Ttg mice. Log-rank (Mantel-Cox) test p = 0.72 between SynhA53Ttg and A+/−M+/− SynhA53Ttg; p = 0.04 between SynhA53Ttg and A−/−M−/− SynhA53Ttg. Representative images from n=2 WT and 3 SynhA53Ttg mice (b and d).
The aged transgenic spinal cord, where SynhA53T expression is high (Ref. 29 and Fig. 4b), showed dramatically elevated expression of Iba1 (Fig. 4b). We also detected up-regulation of both Axl and soluble Axl (sAxl) ectodomain, an inflammatory marker12, in the transgenic cord (Fig. 4c and Extended Data Fig. 8d). In contrast, Axl up-regulation was undetectable in Thy1-SynhA53Ttg spleen and minimal in brain (Extended Data Fig. 8d). No change in Mer expression was detected in the spleen of the transgenics (Extended Data Fig. 8d), with only a very modest increase in the spinal cord (Fig. 4c and Extended Data Fig. 8e). Axl induction in the Thy1-SynhA53Ttg spinal cord was exclusively associated with Iba1+ microglia (Fig. 4d). Expression of SynhA53T in spinal motor neurons (Ref. 29 and Fig. 4b) leads to progressive ataxia, paralysis, and death, with an onset at ~120 days in the transgenic population (Fig. 4e). A 50% reduction in Mer and Axl resulted in no change in this time course, but the loss of both receptors modestly extended survival (Fig. 4e). We do not know the reason for this modest life extension. However, we speculate that WT microglia may execute TAM-dependent ‘phagoptotic’ engulfment26 of distressed, PtdSer-displaying motor neurons, thereby hastening the death of the mice.
Together, the above results identify Mer and Axl as regulators of multiple features of microglial physiology. The elevation in microglial Axl that we document in the Thy1-SynhA53Ttg spinal cord is in keeping with the demonstration that Axl is an inflammatory response receptor in macrophages12, and that elevated levels of sAxl are observed during multiple human disease and trauma states (Ref. 8, and references therein). In this regard, we note that a recent longitudinal study in humans has identified elevated Axl in CSF as among the most reliable indicators of the early appearance of Aβ pathology and the subsequent development of Alzheimer’s disease30.
Methods
Mice
The Axl−/− 31, Mertk−/− 31, Axl−/−Mertk−/− 31, Gas6−/− 31Pros1fl/flNesCre 32,33, Pros1fl/−NesCre33, Cx3cr1GFP/+ 34, Cx3cr1CreER 35, S100bGFP/+ 36 and SynhA53Ttg 37 strains have been described previously. The Mertkfl/fl mouse line diagrammed in Extended Data Fig. 4 was generated by inGenious Targeting Laboratory (iTL, Ronkonkoma NY), using iTL C57Bl/6 ES cells. This line targets exon 18, a 137 nt sequence that encodes residues W779-L824 within the Mer kinase domain. Cre-mediated deletion of this exon introduces a frame shift and a stop codon one amino acid downstream of exon 17. This truncated, kinase-dead protein and/or its mRNA are apparently unstable, as antibodies directed against the Mer extracellular domain do not detect a truncated protein upon Cre-mediated excision (see text). Deletion of exon 18 therefore effectively generates a protein null. The complete Mertk mouse knock-out31 deletes exon 17, a 160 nt sequence that encodes M725-V778 within the Mer kinase domain. (Exon 17 was numbered as exon 18 in the original description of the Mertk knock-out allele31.) This single exon deletion also introduces a frame shift (five amino acids downstream of exon 16), produces an unstable protein, and also results in a Mer protein null38. The Neo cassette was removed via Flp-mediated recombination by crossing high-percentage chimeric mice to C57Bl/6 FLP mice. Neo deletion was confirmed by PCR. These Mertkfl/fl mice, together with PCR-based protocols for their genotyping, are available upon request from the Rothlin laboratory (carla.rothlin@yale.edu). Recombination (inactivation) of the Mertkfl/fl allele in Cx3cr1CreER/+Mertkfl/fl mice was achieved using tamoxifen injection. Cx3cr1CreER/+Mertkfl/fl mice (16 weeks) received a dose (150 mg/kg body weight) of tamoxifen (Sigma) as a solution in corn oil (Sigma) by intraperitoneal (IP) injection. Control mice received an IP injection of vehicle (corn oil) alone. Mice were analyzed for Mer expression and AC (cCasp3+ cell) accumulation 1 wk, 3 wks or 7wks after injection. Mice analyzed at 1 wk received a single dose of tamoxifen or oil; mice analyzed at 3 and 7 weeks received two successive injections 48 h apart. All lines, with the exception of the Mertkfl/fl alleles, have been backcrossed for >9 generations to a C57BL/6 background. All animal procedures were conducted according to protocols approved by the Salk Institute Animal Care and Use Committee (Protocol No. 11-00051). Mice (both males and females) were randomly allocated to experimental groups (three to six mice per group) and investigators were blinded to group allocation during the experiment. Investigators were not blinded to sample identity. Group size was based on previous literature.
Reagents and antibodies
Dexamethasone, 5-Bromo-2-deoxyuridine and DMSO were from Sigma-Aldrich. Poly(I:C) was from Invivogen. LPS (E. coli serotype O55:B5) was from Enzo. IFN-γ was from BioVision. Purified human protein S was from Haematologic Technologies. Recombinant mouse Gas6 was produced as described previously39. Antibodies used were as follows: anti-Mer (AF591), anti-Axl (AF854), and anti-Gas6 (AF986) were from R&D Systems, anti-Mer (DS5MMER) from eBioscience, anti-Iba1 (019-19741) was from Wako, anti-GFAP (z0334) was from Dako, anti-Neurofilament H (SMI-31 NE1022), anti-NeuN (MAB377 A60), anti-Calretinin (AB1550), anti-Tyrosine Hydroxylase (MAB318; LNC1) and anti-GAPDH (MAB374; 6C5) were from Millipore, anti-α−synuclein (C-20-R sc-7011-R) and anti-Axl (M-20 sc-1097) were from Santa Cruz, anti-Cleaved Caspase 3 (Asp175) was from Cell signaling, anti-ACSA-2 (clone IH3-18A3) was from Miltenyi Biotec, anti-CD169 (Siglec1; 3D6) and anti-BrdU (BU1/75 (ICR1) were from AbD serotec, and anti CD31 (ab28364) and anti-S100b (EP1576Y) were from Abcam. Secondary antibodies used for immunoblot analysis were horseradish peroxidase–conjugated anti-goat (705-035-003) from Jackson ImmunoResearch, and anti-mouse (NA931V) and anti-rabbit (NA934V) from GE Healthcare. Secondary antibodies for immunocyto- and immunohistochemistry were fluorophore-conjugated anti-goat (A-11055 from Life Technologies, or 705-166-147 from Jackson ImmunoResearch), anti-rabbit (A-10040 or A-21206 from Life Technologies), and anti-mouse (A-11029 from Life Technologies, or 715-166-150 from Jackson ImmunoResearch).
Immunohistochemistry
Adult mice (3-6 month) were anesthetized with 2.5% avertin in saline, perfused with 20U/mL heparin in PBS, and subsequently with 4% PFA in PBS. Brain and spinal cords were collected, immersion fixed overnight at 4°C, infiltrated with 30% sucrose in PBS overnight at 4°C, and flash frozen in TBS tissue freezing medium. 17 μm sections were cut, air-dried overnight at room temperature and subsequently processed for staining. Non-specific binding was blocked by 1h incubation in blocking buffer (PBS containing 0.1% Tween-20, 5% donkey serum and 2% IgG-free BSA). Sections were incubated overnight at 4°C with primary antibody (identified above) diluted in blocking buffer, then washed in PBS 0.1% Tween-20, and incubated for 2 h at 22–24 °C in the dark with Hoechst and fluorophore-coupled secondary antibodies diluted in blocking buffer. Sections were washed, sealed with Fluoromount-G (SouthernBiotech) and stored at 4 °C. Images were acquired with a Zeiss LSM 710 confocal microscope using Plan-Apochromat 40X and 63X objectives.
AC quantification
Cleaved Casp3+ ACs were counted in four successive 17μm sections that spanned the SVZ in three different mice for both the Mertk−/− and Axl−/−Mertk−/− genotypes, and in two different mice for the Mertk−/−Gas6−/− genotype. No cCasp3+ cells in excess of wild-type were observed in SVZ sections of any of the other genotypes analyzed. The cross-sectional area of the SVZ was defined as the region of intense Hoechst 33258 staining, as illustrated in Figs. 1a, c, d, and measured using ImageJ. AC accumulation between the Axl−/−Mertk−/− and Mertk−/−Gas6−/− genotypes is not statistically different. Note that cCasp3 marks a subset of ACs
BrdU pulse labeling
3 successive injections (50mg/kg body weight) of 5-Bromo-2-deoxyuridine (BrdU) were performed in 8 wk old mice at 24 h intervals and BrdU staining was assessed 35 days later. Briefly, mice were anesthetized with 2.5% avertin in saline, perfused with 20U/mL heparin in PBS, and subsequently with 4% PFA in PBS. Brain were collected, immersion fixed overnight at 4°C, infiltrated with 30% sucrose in PBS overnight at 4°C and flash frozen in TBS tissue freezing medium. 17 μm sections were cut and air-dried overnight at room temperature. Subsequently, the sections were incubated in 2N HCL at 37°C for 30 minutes, rinsed for 10 minutes in 0.1M borate buffer (pH=8.4) at room temperature and washed six times in PBS. To block endogenous peroxidase activity, sections were incubated for 10 min in 0.3% H2O2 in 10% Methanol. Non-specific binding was blocked by 1h incubation in blocking buffer (PBS containing 0.25% Triton-X and 5% donkey serum). Sections were incubated for 72h at 4°C with primary antibody (anti-BrdU) diluted in blocking buffer, then washed in PBS 0.1% Tween-20, and incubated for 2 h at room temperature in the dark with a biotin-conjugated secondary antibody diluted in blocking buffer. Sections were washed and DAB staining was performed using Vectastain Elite ABC-kit (Vector Laboratories) and DAB peroxidase (HRP) substrate kit (Vector Laboratories) following manufacturer’s instructions. Afterwards, sections were counterstained using hematoxylin for 15 seconds, sealed with Vectamount (Vector Laboratories) and stored at room temperature. Images were acquired with a Zeiss slide scanner Axio Scan.Z1 using 20X objective and analyzed with ImageJ. For quantitation, BrdU+ cells in Granule Cell Layer (GCL) and Glomerular Layer (GL) of the Olfactory Bulb (OB) were counted in two consecutive sections per animal and averaged per animal.
Immunocytochemistry
Cells were fixed for 10 min in 4% PFA/4% sucrose in PBS, washed with PBS, incubated for 10 min in 100mM Glycine, permeabilized for 5 min in 0.2% Triton-X100 in PBS, washed with PBS, and nonspecific binding was then blocked by 40 min incubation in blocking buffer (2% IgG-free BSA in PBS). Coverslips were incubated for 1 h at 22–24°C with primary antibody diluted in blocking buffer, washed five times in PBS, and then incubated for 1 h at 22–24°C in the dark with Hoechst stain and fluorophore-coupled donkey secondary antibody (identified above) diluted in blocking buffer. Coverslips were washed and mounted on slides with Fluoromount-G (SouthernBiotech) and stored at 4°C. Images were acquired with a Zeiss LSM 710 confocal microscope using Plan-Apochromat 40X and 63X objectives.
CLARITY imaging
One cerebral hemisphere from a Cx3cr1GFP/+ mouse was cleared using CLARITY protocols, essentially as described40. Rather than electrophoretic clearing, samples were incubated at 37°C and passively cleared over 3 weeks by daily replacement of the clearing solution. A 1 mm3 block of tissue adjacent to the lateral ventricle of Cx3cr1GFP/+ mice, in the region containing the SVZ, was imaged using a Zeiss LSM 710 confocal microscope. Fiji software was used to assemble images.
Immunoblot
Cultured cells were washed with ice-cold DPBS and lysed on ice in 50 mM Tris-HCl pH 7.5, 1 mM EGTA, 1 mM EDTA, 1% Triton-X100, 0.27 M sucrose, and protease and phosphatase inhibitors (Roche). Tissues were snap frozen in liquid nitrogen before lysis. For immunoblot analysis, equal amounts of protein in LDS sample buffer (Invitrogen) were separated by electrophoresis through 4–12% Bis-Tris polyacrylamide gels (Novex, Life Technologies) and transferred to PVDF membranes (Millipore). For Axl immunoprecipitation, tissue lysates were precleared overnight at 4°C with Protein G-Sepharose (Invitrogen). This was then removed and lysates were incubated for 2 h with 0.2μg anti-Axl (M20) for 0.5 mg protein in cell lysate. Fresh Protein G–Sepharose was added for 2 h and immunoprecipitates were washed twice with 1 ml of lysis buffer containing 0.5 M NaCl and once with 1 ml of 50 mM Tris-HCl pH 7.5. Immunoprecipitates were eluted in LDS buffer, separated by electrophoresis through polyacrylamide gels and transferred to PVDF membranes. Nonspecific binding was blocked with TBST (50 mM Tris-HCl pH 7.5, 0.15 M NaCl and 0.1% Tween-20) containing 5% BSA, and membranes were incubated overnight at 4°C with primary antibodies diluted in blocking buffer. Blots were then washed in TBST and incubated for 1 h at 22–24°C with secondary horseradish peroxidase–conjugated antibodies in 5% skim milk in TBST. After repeating the washes, signal was detected with enhanced chemiluminescence reagent.
RT-qPCR
Total cellular RNA was isolated with an RNeasy Mini Kit according to the manufacturer’s instructions (Qiagen). DNA was removed by on-column digestion with DNase (Qiagen). An RT Transcriptor First Strand cDNA Synthesis Kit (Roche) with anchored oligo(dT) primers (Roche) was used for reverse transcription. Quantitative PCR was run in a 384-well plate format on a ViiA 7 Real-Time PCR System (Applied Biosystems) with 2× SYBR Green PCR Master Mix (Applied Biosystems). Primers are in Extended Data Table 2. Expression was analyzed by the threshold cycle (ΔCt) method.
Microglia and Astrocyte culture
P30 to P50 mice (Cx3cr1GFP/+, Axl−/−Mertk−/−Cx3cr1GFP/+) brains were dissociated using Neural Dissociation kit - Postnatal Neurons and the gentleMACS™ dissociator according to the manufacturer’s instructions (Miltenyi). Single cell suspensions were resuspended in 30% Percoll in HBSS and centrifuged 15 min at 700g to remove Myelin. Cells were grown for 7 days in DMEM-F12 with 10% Fetal Bovine Serum (FBS) and 1% Penicillin/Streptomycin before being processed for immunostaining or phagocytosis assay. Cytosine beta-D-arabinofuranoside (Ara-C – 5µM) was added after 5 days in vitro to limit fibroblast proliferation. When astrocytes were also isolated, microglia were first purified using C11b MicroBeads (Miltenyi) and grown for 7 days in DMEM-F12 with 10% Fetal Bovine Serum (FBS) and 1% Penicillin/Streptomycin while astrocytes were grown for 10 days in MACS Neuro Medium with 2% MACS NeuroBrew-21 and 1% Penicillin/Streptomycin.
Phagocytosis Assay
For the generation of apoptotic cells, thymocytes were isolated from 3- to 6-week-old mice, red blood cells were lysed with ACK buffer and remaining cells were incubated for 6 h in RPMI medium containing 5% FBS and 2 μM Dexamethasone to induce apoptosis. This routinely resulted in 70% apoptotic and ≤5% necrotic cells. Apoptotic cells were then stained for 30 min with100 ng/ml pHrodo-SE (Invitrogen) as described previously38,41,42. Labeled cells were washed twice in PBS containing 1% BSA (to block remaining pHrodo-SE) and 1 mM EDTA (to remove any bound Gas6 and protein S) and once with DMEM. Apoptotic cells were then incubated for 10 min with recombinant mouse Gas6 or purified human protein S, added to microglia or astrocyte cultures at a ratio of 10:1 (apoptotic cells/phagocytes), and incubated for 1 h at 37°C. Microglia or astrocytes were then briefly washed in DPBS, incubated for 10 min at 37°C in trypsin (0.25%), and then placed on ice and detached by vigorous pipetting. Astrocytes were labeled using anti-ACSA2-APC antibody43. Phagocytosis was assessed by flow cytometry with post-acquisition data analysis with FlowJo software (TreeStar). pHrodo fluorescence was measured with excitation at 561 nm and emission filters for phycoerythrin (574-590 nm) on a LSR II (BD Biosciences) at the Flow Cytometry Core of the Salk Institute, as described previously38. Microglia were gated as GFP-positive cells and astrocytes were gated as APC-positive cells.
Two-photon imaging
Adult male mice (3-6 months old) were anesthetized with isoflurane (1.5–2.5% in 100% oxygen at 0.8-1.0 liter/min). Body temperature was kept at 36-37°C, and hydration status was maintained using subcutaneous physiological saline injections (0.1mL/25g body weight every 1-2 h). For head plate implantation, hair, skin and periosteum overlying the neocortex were removed. After cleaning exposed skull areas, a custom metal head plate was affixed to the skull using OptiBond (31514; Kerr) and dental acrylic (H00335; Coltene Whaledent), keeping the intended imaging area over somatosensory or visual cortex uncovered. A polished and reinforced thinned skull window (~2-3-mm diameter; ~20-50 μm remaining bone thickness) was then prepared, as described previously44,45. A movable objective microscope (Sutter Instrument) equipped with a pulsed femtosecond Ti:Sapphire laser (Chameleon Vision II or Ultra II, Coherent), two fluorescence detection channels (565DXCR dichroic, ET525/70M-2P and ET605/70M-2P emission filters, Chroma; H7422-40 GaAsP photomultiplier tubes, Hamamatsu), and a water immersion objective (LUMPlanFL N 40XW 0.8NA; Olympus) was used for two-photon imaging. Imaging was performed as described previously45,46 using 920-940 nm center excitation wavelengths. Average laser powers used for transcranial optical recordings depended on imaging depth (typically ~10-30 mW at ~150-200 μm depth from the pia). Images were typically acquired using a 6 Hz frame rate, 256 × 256 pixel resolution and a 5-frame average. Image stacks were acquired every 1.5-2 min for up to 5 hours and typically contained 20-30 images per stack with 1 μm axial image spacing. Fields-of-view had a typical side length of 65-100 μm. Imaging settings were kept constant during time-lapse recordings. For quantitative image data analysis, ImageJ or Fiji software was used. First, maximum intensity images were produced from individual image stacks. Then, lateral image shifts in time-lapse recordings were corrected using a custom-written ImageJ alignment plugin based on the position shift of the peak in cross-correlation images, typically using the first projection image as the reference image. Structural dynamics of individual microglial cell processes was quantified manually using the MTtrackJ plugin in Fiji. Image analysis was done blind with respect to experimental condition. Videos were also created with Fiji.
Laser lesion
To target blood vessels for focal laser lesion, blood plasma was stained by tail vein injection of biocytin-TMR (2-5% in saline, T-12921, Life Technologies). Lesions were performed following a baseline recording period of 30-45 min, during which z-stacks were acquired as described above. To induce lesions, the Ti:Sapphire laser was transiently tuned to 800 nm and a confined area (8-15 μm diameter, ~1 μm axial extent) of a horizontally oriented cortical capillary at 150-220 μm depth was exposed to 70-130 mW for 10-30 s. Laser lesions caused extravasation of dye, indicating disruption of the blood-brain barrier. Following focal lesion, image stack acquisition was resumed using the same laser and recording parameters as during the baseline recording period. Although Supplementary Videos 4 and 5 run for only ~12 min (the time required for microglial processes to reach the lesion site), time-lapse recording of the same cortical volume continued for 2-4 h after the lesion.
Extended Data
Extended Data Figure 1.
Mer is expressed by microglia. a, Brain (hippocampus) sections from Cx3cr1GFP/+ mice that were WT (top row) or Axl−/−Mertk−/− (bottom row) were visualized by confocal microscopy for GFP (1st column), anti-Mer (red, 2nd column), or anti-GFAP (cyan, 3rd column) immunoreactivity. Fourth column, merged images. Scale bars 10 μm. Axl immunostaining signal is too low to be visualized in unactivated microglia (not shown; but see Fig. 4d). b, Mer expression does not co-localize with S100b+ cells. Immunostaining of Cx3cr1GFP/+ brain sections with anti-Mer (red, 2nd panel) and anti-S100b (cyan, 3rd panel). Fourth panel, merged images. c, Mer co-localizes with Iba1, but not GFAP or GFP in S100bGFP/+ mice. Brain sections were visualized by confocal microscopy for anti-Iba1 (top) or anti-GFAP (bottom) (both cyan, 1st column), anti-Mer (red, 2nd column), or GFP (green, 3rd column) immunoreactivity. Fourth column, merged images. Scale bars for b, c 20 μm. Representative images from analyses performed in n = 2 mice (a-c)
Extended Data Figure 2.
Apoptotic cell (AC) accumulation is confined to neurogenic and derivative migratory regions of the Axl−/−Mertk−/− CNS. a, A low power tiled image of a section through the Axl−/−Mertk−/− subventricular zone (SVZ) and surrounding brain tissue, stained for cCasp3, illustrates that ACs are confined within the SVZ. b, A low power tiled image of a section through the Axl−/−Mertk−/− rostral migratory stream (RMS) and surrounding brain tissue illustrates that cCasp3+ ACs are confined within the RMS. c, A low power tiled image of the granule cell and mitral cell layers (gcl and mcl, respectively) of the Axl−/−Mertk−/− olfactory bulb, stained for cCasp3, illustrates that there are no ACs detected in the double mutant bulb. Scale bars for a-c, 200 μm. Representative images from analyses performed in n = 3 mice (a-c)
Extended Data Figure 3.
Mer is the principal microglial TAM receptor required for AC phagocytosis in the SVZ. a, Sections of the SVZ from Axl−/− (top row) and Mertk−/− (bottom row) mice immunostained for cCasp3 and NeuN (green and red, respectively; left panels), or Iba1 and NeuN (green and red, respectively; right panels) reveal the accumulation of cCasp3+ ACs only in the Mertk−/− SVZ. b, Sections of the SVZ (top) and RMS (bottom) of Gas6−/− mice, illustrating no AC accumulation (similar to both WT and Axl−/−). c, Sections of the SVZ (top) and RMS (bottom) of Mertk−/−Gas6−/− mice, illustrating a massive accumulation of ACs similar to that seen in Axl−/−Mertk−/− mice. Scale bars 50 μm. See text for quantification. Representative images from analyses performed in n = 2 mice for Gas6−/− and Mertk−/−Gas6−/−, and n = 3 mice for Axl−/− and Mertk−/−.
Extended Data Figure 4.
Conditional Mertk knock-outs. The knock-out strategy targets exon 18 of the WT mouse Mertk gene, which encodes residues W779-L824 of the tyrosine kinase domain (1st line). Deletion of this exon leads to a functional and protein null (see Methods, and Extended Data Fig. 5). The targeting vector (2nd line) had a pgk-Neo cassette for selection in ES cells, and contained loxP and FRT sites, recognized by Cre and Flp recombinases, respectively, at the indicated positions. Five ES cell lines with homologous recombination at the Mertk locus were identified by Southern blots of MfeI-digested DNA, using the indicated Pb 1/2 (external) and Pb 3/4 (internal) probes (3rd line). Introduction of Flp recombinase, achieved by crossing high percentage chimeras (obtained from blastocyst injection of these ES cells) to C57Bl/6 FLP mice, removed the Neo cassette, leaving exon 18 flanked by loxP sites (4th line). Cre-mediated recombination at these loxP sites deletes exon 18. Mertkfl/fl mice, together with PCR-based protocols for their genotyping, are available upon request from the Rothlin laboratory (carla.rothlin@yale.edu). See Methods.
Extended Data Figure 5.
Persistence of microglial-specific Mer ablation following tamoxifen injection of Cx3cr1CreER/+Mertkfl/fl mice. a, Mice were injected IP with oil vehicle alone (− tamoxifen, top row) or with tamoxifen (+ tamoxifen, bottom row) (see Methods), and brain sections were immunostained for Mer protein expression (red panels in 2nd, 4th columns) in Iba1+ microglia (green panels in 1st, 3rd columns) at 1 wk (left four panels) and 7 wks (right four panels) after injection. Sections counter-stained with Hoechst 33258 to visualize nuclei (blue). b, Brain sections containing a brain capillary 7 weeks after injection of vehicle (top) or tamoxifen (bottom), showing that while Mer expression in microglia is eliminated upon tamoxifen-mediated Cx3cr1-restricted induction of Cre activity, Mer expression in CD31+ microvascular endothelial cells (arrows) is maintained. Representative images of n = 2 mice per time point.
Extended Data Figure 6.
Identity of immigrant BrdU+ cells in the olfactory bulb (OB). a, Some BrdU+ cells in the glomerular layer (gl), visualized 35 days after injection of BrdU (red) and presumed immigrant descendants of SVZ cells in S phase at the time of injection, are also positive for tyrosine hydroxylase (green) in both WT (left panel) and Axl−/−Mertk−/− (right panel) mice. Arrowheads are examples of TH+BrdU+ cells. b, Similar comparative granule cell layer (gcl) sections stained with anti-BrdU (red) and calretinin (CR, green). Arrowheads are examples of CR+BrdU+ cells. Panels co-stained with Hoechst 33258 to visualize nuclei. Scale bars 50 μm. Representative images of n = 2 per genotype.
Extended Data Figure 7.
Both Gas6 and Pros1 drive microglial phagocytosis of ACs in vitro. a, Cultured microglia express Mer but little or no Axl under basal conditions. Microglia were cultured from WT Cx3cr1GFP/+ mice, visualized for GFP (1st column), and immunostained for Iba1 (3rd column), Mer (2nd column, top), and Axl (2nd column, bottom). Scale bar 10 μm. b-d, In vitro pHrodo-based assay of AC phagocytosis by microglia (see Methods). b, In serum-containing medium (10% FBS), WT microglia are vigorous phagocytes; mean phagocytic activity is substantially reduced in Axl−/−Mertk−/− (A−/−M−/−) microglia. c, d, Both purified Gas6 (c) and purified Pros1 (d) stimulate AC phagocytosis by cultured microglia in serum-free medium, and this stimulation is entirely TAM-dependent. e, The phagocytic activity of cultured astroglia prepared from Cx3cr1GFP/+ mice that were either WT or Axl−/−Mertk−/− was measured in the same pHrodo-based assay in serum-free medium ± Gas6. For this FACS-based assay, astrocytes were gated using an astrocyte-specific surface antigen-2 (ACSA-2) antibody (see Methods). Bar graphs represent mean phagocytic activity (± SEM); n = 2 replicates from 2 mice per genotype for b-d, and 2 replicates from 4 mice per genotype for e.
Extended Data Figure 8.
Regulation of microglial Axl by neuroinflammation. a, Axl and b, Mer regulation in purified (GFP+) cultured microglia by the tolerogenic stimulus dexamethasone (Dex) and the two proinflammatory stimuli IFNγ and poly(I:C), as assessed by immunostaining. Axl expression (a) is very low in the absence of an added stimulus, is not elevated by Dex, but is strongly up-regulated by both IFNγ and poly(I:C). In contrast, Mer expression (b) is readily detected in the absence of an added stimulus, is further elevated by Dex, but is modestly suppressed by both IFNγ and poly(I:C). Scale bar 10 μm. c, In contrast to the spinal cord (see Figure 4a), there is no up-regulation of the indicated inflammatory mediator/marker mRNAs (mean expression ± SEM) in the spleens, and only modest up-regulation in the brains, of SynhA53Ttg mice at 8-10 months of age. n=3 mice for each genotype. d, Western blot analysis of spleen (left blots) and brain and spinal cord (right blots) extracts from two different WT mice and four or three different SynhA53Ttg mice at 9-10 months, for the indicated proteins, with Gapdh as a loading control. Note that soluble Axl ectodomain (sAxl) is up-regulated in the SynhA53Ttg spinal cord concomitantly with Axl. e, Although Axl is strongly up-regulated in Iba1+ microglia in the SynhA53Ttg spinal cord (see Figure 4d), no up-regulation of Mer is observed in these same cells. Scale bar 10 μm. n = 2 WT and 3 SynhA53Ttg mice.
Supplementary Material
Acknowledgements
This work was supported by grants from the US National Institutes of Health (R01 NS085296 and R01 AI101400 to G.L., DP2 NS083038 and R01 NS085938 to A.N., R01 AI089824 to C.V.R., and P30CA014195 to the Salk Institute), the Leona M. and Harry B. Helmsley Charitable Trust (#2012-PG-MED002 to the Salk Institute), the Nomis, H. N. and Frances C. Berger, Fritz B. Burns, and HKT Foundations (to G.L.), and the Waitt, Rita Allen and Hearst Foundations (to A.N.); and by postdoctoral fellowships from the Marie Curie International Outgoing Fellowship Program (to P.G.T), the Nomis Foundation (to A.Z. and E.D.L.), and the Howard Hughes Medical Institute Life Sciences Research Foundation (to Y.T.). We thank Joe Hash for excellent technical assistance, and Jamie Flynn for help with the CLARITY method.
Footnotes
Author contributions L. F. and P. G. T. designed experiments, performed apoptotic cell, BrdU, immunohistochemical, and genetic analyses, and contributed equally to the paper, Y. T., L.F. and H. L.-B. performed and analyzed in vivo two photon imaging, E. D. L. prepared TAM ligands, P. G. B. performed brain histology, P. C. analyzed cytokine profiles, A. Z. analyzed Axl expression in PD transgenics, C. V. R. provided floxed Mertk alleles, A. N. designed and implemented two photon imaging, and G.L. designed experiments and wrote the paper. All authors edited the paper.
Author information Reprints and permissions information is available at www.nature.com/reprints.
The authors declare no competing financial interests.
References
- 1.Ransohoff RM, Cardona AE. The myeloid cells of the central nervous system parenchyma. Nature. 2010;468:253–262. doi: 10.1038/nature09615. [DOI] [PubMed] [Google Scholar]
- 2.Lemke G. Biology of the TAM receptors. Cold Spring Harbor Perspectives. 2013;5(11) doi: 10.1101/cshperspect.a009076. doi: 10.1101/cshperspect.a009076. [DOI] [PMC free article] [PubMed] [Google Scholar]
- 3.Aimone JB, et al. Regulation and function of adult neurogenesis: from genes to cognition. Physiol Rev. 2014;94:991–1026. doi: 10.1152/physrev.00004.2014. [DOI] [PMC free article] [PubMed] [Google Scholar]
- 4.Sierra A, et al. Microglia shape adult hippocampal neurogenesis through apoptosis-coupled phagocytosis. Cell stem cell. 2010;7:483–495. doi: 10.1016/j.stem.2010.08.014. [DOI] [PMC free article] [PubMed] [Google Scholar]
- 5.Lew ED, et al. Differential TAM receptor-ligand-phospholipid interactions delimit differential TAM bioactivities. eLife. 2014;3:e03385. doi: 10.7554/eLife.03385. [DOI] [PMC free article] [PubMed] [Google Scholar]
- 6.Chandra S, Gallardo G, Fernandez-Chacon R, Schluter OM, Sudhof TC. Alpha-synuclein cooperates with CSPalpha in preventing neurodegeneration. Cell. 2005;123:383–396. doi: 10.1016/j.cell.2005.09.028. [DOI] [PubMed] [Google Scholar]
- 7.Ginhoux F, et al. Fate mapping analysis reveals that adult microglia derive from primitive macrophages. Science. 2010;330:841–845. doi: 10.1126/science.1194637. [DOI] [PMC free article] [PubMed] [Google Scholar]
- 8.Lu Q, Lemke G. Homeostatic regulation of the immune system by receptor tyrosine kinases of the Tyro 3 family. Science. 2001;293:306–311. doi: 10.1126/science.1061663. [DOI] [PubMed] [Google Scholar]
- 9.Rothlin CV, Ghosh S, Zuniga EI, Oldstone MB, Lemke G. TAM receptors are pleiotropic inhibitors of the innate immune response. Cell. 2007;131:1124–1136. doi: 10.1016/j.cell.2007.10.034. [DOI] [PubMed] [Google Scholar]
- 10.Burstyn-Cohen T, et al. Genetic dissection of TAM receptor-ligand interaction in retinal pigment epithelial cell phagocytosis. Neuron. 2012;76:1123–1132. doi: 10.1016/j.neuron.2012.10.015. [DOI] [PMC free article] [PubMed] [Google Scholar]
- 11.Scott RS, et al. Phagocytosis and clearance of apoptotic cells is mediated by MER. Nature. 2001;411:207–211. doi: 10.1038/35075603. [DOI] [PubMed] [Google Scholar]
- 12.Zagórska A, Través PG, Lew ED, Dransfield I, Lemke G. Diversification of TAM receptor tyrosine kinase function. Nat Immunol. 2014;15:920–928. doi: 10.1038/ni.2986. [DOI] [PMC free article] [PubMed] [Google Scholar]
- 13.Bhattacharyya S, et al. Enveloped Viruses Disable Innate Immune Responses in Dendritic Cells by Direct Activation of TAM Receptors. Cell Host Microbe. 2013;14:136–147. doi: 10.1016/j.chom.2013.07.005. [DOI] [PMC free article] [PubMed] [Google Scholar]
- 14.Zhang Z, et al. Activation of the AXL kinase causes resistance to EGFR-targeted therapy in lung cancer. Nat Genet. 2012;44:852–860. doi: 10.1038/ng.2330. [DOI] [PMC free article] [PubMed] [Google Scholar]
- 15.Lai C, Lemke G. An extended family of protein-tyrosine kinase genes differentially expressed in the vertebrate nervous system. Neuron. 1991;6:691–704. doi: 10.1016/0896-6273(91)90167-x. [DOI] [PubMed] [Google Scholar]
- 16.Prieto AL, O'Dell S, Varnum B, Lai C. Localization and signaling of the receptor protein tyrosine kinase Tyro3 in cortical and hippocampal neurons. Neuroscience. 2007;150:319–334. doi: 10.1016/j.neuroscience.2007.09.047. [DOI] [PMC free article] [PubMed] [Google Scholar]
- 17.Gautier EL, et al. Gene-expression profiles and transcriptional regulatory pathways that underlie the identity and diversity of mouse tissue macrophages. Nat Immunol. 2012;13:1118–1128. doi: 10.1038/ni.2419. [DOI] [PMC free article] [PubMed] [Google Scholar]
- 18.Grommes C, et al. Regulation of microglial phagocytosis and inflammatory gene expression by Gas6 acting on the Axl/Mer family of tyrosine kinases. J Neuroimmune Pharmacol. 2008;3:130–140. doi: 10.1007/s11481-007-9090-2. [DOI] [PMC free article] [PubMed] [Google Scholar]
- 19.Ji R, et al. TAM receptors affect adult brain neurogenesis by negative regulation of microglial cell activation. J Immunol. 2014;191:6165–6177. doi: 10.4049/jimmunol.1302229. [DOI] [PMC free article] [PubMed] [Google Scholar]
- 20.Cardona AE, et al. Control of microglial neurotoxicity by the fractalkine receptor. Nat Neurosci. 2006;9:917–924. doi: 10.1038/nn1715. [DOI] [PubMed] [Google Scholar]
- 21.Ito D, et al. Microglia-specific localisation of a novel calcium binding protein, Iba1. Brain research. Molecular brain research. 1998;57:1–9. doi: 10.1016/s0169-328x(98)00040-0. [DOI] [PubMed] [Google Scholar]
- 22.Jung S, et al. Analysis of fractalkine receptor CX(3)CR1 function by targeted deletion and green fluorescent protein reporter gene insertion. Mol Cell Biol. 2000;20:4106–4114. doi: 10.1128/mcb.20.11.4106-4114.2000. [DOI] [PMC free article] [PubMed] [Google Scholar]
- 23.Chung WS, et al. Astrocytes mediate synapse elimination through MEGF10 and MERTK pathways. Nature. 2013;504:394–400. doi: 10.1038/nature12776. [DOI] [PMC free article] [PubMed] [Google Scholar]
- 24.Parkhurst CN, et al. Microglia promote learning-dependent synapse formation through brain-derived neurotrophic factor. Cell. 2013;155:1596–1609. doi: 10.1016/j.cell.2013.11.030. [DOI] [PMC free article] [PubMed] [Google Scholar]
- 25.Miner JJ, et al. The TAM receptor Mertk protects against neuroinvasive viral infection by maintaining blood-brain barrier integrity. Nature Medicine. 2015;21:1464–1472. doi: 10.1038/nm.3974. [DOI] [PMC free article] [PubMed] [Google Scholar]
- 26.Brown GC, Neher JJ. Microglial phagocytosis of live neurons. Nature reviews. Neuroscience. 2014;15:209–216. doi: 10.1038/nrn3710. doi:10.1038/nrn3710. [DOI] [PubMed] [Google Scholar]
- 27.Burstyn-Cohen T, Heeb MJ, Lemke G. Lack of protein S in mice causes embryonic lethal coagulopathy and vascular dysgenesis. J Clin Invest. 2009;119:2942–2953. doi: 10.1172/JCI39325. PMC2752078. [DOI] [PMC free article] [PubMed] [Google Scholar]
- 28.Nimmerjahn A, Kirchhoff F, Helmchen F. Resting microglial cells are highly dynamic surveillants of brain parenchyma in vivo. Science. 2005;308:1314–1318. doi: 10.1126/science.1110647. [DOI] [PubMed] [Google Scholar]
- 29.Tang Y, et al. Mertk deficiency affects macrophage directional migration via disruption of cytoskeletal organization. PLoS One. 2015;10:e0117787. doi: 10.1371/journal.pone.0117787. doi:10.1371/journal.pone.0117787. [DOI] [PMC free article] [PubMed] [Google Scholar]
- 30.Mattsson N, et al. CSF protein biomarkers predicting longitudinal reduction of CSF beta-amyloid42 in cognitively healthy elders. Translational psychiatry. 2013;3:e293. doi: 10.1038/tp.2013.69. [DOI] [PMC free article] [PubMed] [Google Scholar]
- 31.Lu Q, et al. Tyro-3 family receptors are essential regulators of mammalian spermatogenesis. Nature. 1999;398:723–728. doi: 10.1038/19554. [DOI] [PubMed] [Google Scholar]
- 32.Angelillo-Scherrer A, et al. Deficiency or inhibition of Gas6 causes platelet dysfunction and protects mice against thrombosis. Nat Med. 2001;7:215–221. doi: 10.1038/84667. [DOI] [PubMed] [Google Scholar]
- 33.Burstyn-Cohen T, et al. Genetic dissection of TAM receptor-ligand interaction in retinal pigment epithelial cell phagocytosis. Neuron. 2012;76:1123–1132. doi: 10.1016/j.neuron.2012.10.015. [DOI] [PMC free article] [PubMed] [Google Scholar]
- 34.Jung S, et al. Analysis of fractalkine receptor CX(3)CR1 function by targeted deletion and green fluorescent protein reporter gene insertion. Mol Cell Biol. 2000;20:4106–4114. doi: 10.1128/mcb.20.11.4106-4114.2000. [DOI] [PMC free article] [PubMed] [Google Scholar]
- 35.Parkhurst CN, et al. Microglia promote learning-dependent synapse formation through brain-derived neurotrophic factor. Cell. 2013;155:1596–1609. doi: 10.1016/j.cell.2013.11.030. [DOI] [PMC free article] [PubMed] [Google Scholar]
- 36.Vives V, Alonso G, Solal AC, Joubert D, Legraverend C. Visualization of S100B-positive neurons and glia in the central nervous system of EGFP transgenic mice. J Comp Neurol. 2003;457:404–419. doi: 10.1002/cne.10552. doi:10.1002/cne.10552. [DOI] [PubMed] [Google Scholar]
- 37.Chandra S, Gallardo G, Fernandez-Chacon R, Schluter OM, Sudhof TC. Alpha-synuclein cooperates with CSPalpha in preventing neurodegeneration. Cell. 2005;123:383–396. doi: 10.1016/j.cell.2005.09.028. [DOI] [PubMed] [Google Scholar]
- 38.Zagórska A, Través PG, Lew ED, Dransfield I, Lemke G. Diversification of TAM receptor tyrosine kinase function. Nat Immunol. 2014;15:920–928. doi: 10.1038/ni.2986. [DOI] [PMC free article] [PubMed] [Google Scholar]
- 39.Lew ED, et al. Differential TAM receptor-ligand-phospholipid interactions delimit differential TAM bioactivities. eLife. 2014;3:e03385. doi: 10.7554/eLife.03385. [DOI] [PMC free article] [PubMed] [Google Scholar]
- 40.Chung K, et al. Structural and molecular interrogation of intact biological systems. Nature. 2013;497:332–337. doi: 10.1038/nature12107. [DOI] [PMC free article] [PubMed] [Google Scholar]
- 41.Miksa M, Komura H, Wu R, Shah KG, Wang P. A novel method to determine the engulfment of apoptotic cells by macrophages using pHrodo succinimidyl ester. J Immunol Methods. 2009;342:71–77. doi: 10.1016/j.jim.2008.11.019. [DOI] [PMC free article] [PubMed] [Google Scholar]
- 42.Dransfield I, Zagorska A, Lew ED, Michail K, Lemke G. Mer receptor tyrosine kinase mediates both tethering and phagocytosis of apoptotic cells. Cell death, & disease. 2015;6:e1646. doi: 10.1038/cddis.2015.18. doi:10.1038/cddis.2015.18. [DOI] [PMC free article] [PubMed] [Google Scholar]
- 43.Sharma K, et al. Cell type- and brain region-resolved mouse brain proteome. Nat Neurosci. 2015;18:1819–1831. doi: 10.1038/nn.4160. doi:10.1038/nn.4160. [DOI] [PMC free article] [PubMed] [Google Scholar]
- 44.Drew PJ, et al. Chronic optical access through a polished and reinforced thinned skull. Nat Methods. 2010;7:981–984. doi: 10.1038/nmeth.1530. [DOI] [PMC free article] [PubMed] [Google Scholar]
- 45.Knowland D, et al. Stepwise recruitment of transcellular and paracellular pathways underlies blood-brain barrier breakdown in stroke. Neuron. 2014;82:603–617. doi: 10.1016/j.neuron.2014.03.003. [DOI] [PMC free article] [PubMed] [Google Scholar]
- 46.Nimmerjahn A, Kirchhoff F, Helmchen F. Resting microglial cells are highly dynamic surveillants of brain parenchyma in vivo. Science. 2005;308:1314–1318. doi: 10.1126/science.1110647. [DOI] [PubMed] [Google Scholar]
Associated Data
This section collects any data citations, data availability statements, or supplementary materials included in this article.


