

ABSTRACT
Upper-body adiposity is associated with increased metabolic disease risk, while lower-body adiposity is paradoxically protective. Efforts to understand the underlying mechanisms require appropriate and reproducible in vitro culture models. We have therefore generated immortalised (im) human preadipocyte (PAD) cell lines derived from paired subcutaneous abdominal and gluteal adipose tissue. These cell lines, denoted imAPAD and imGPAD display enhanced proliferation and robust adipogenic capacities. Differentiated imAPAD and imGPAD adipocytes synthesize triglycerides de novo and respond lipolytically to catecholamine-stimulation. Importantly the cells retain their depot-of-origin ‘memory’ as reflected by inherent differences in fatty acid metabolism and expression of depot-specific developmental genes. These features make these cell lines an invaluable tool for the in vitro investigation of depot-specific human adipocyte biology.
KEYWORDS: abdominal, adipogenesis, body fat distribution, gluteal, human adipose tissue, preadipocyte cell lines
Introduction
Obesity is an escalating public health problem which underpins several metabolic complications including type 2 diabetes and cardiovascular disease.1,2 Different regional fat depots have distinct functional traits and diverse associations with metabolic disorders. Increased waist-to-hip ratio (WHR) is an indicator of preferential upper-body fat accumulation (abdominal subcutaneous and/or visceral). A high WHR is generally more closely associated with obesity-related metabolic disease risk than measures of overall obesity, i.e. body mass index (BMI).3-5 By comparison, fat accumulation in the lower-body (gluteal, femoral) is paradoxically associated with reduced cardiometabolic risk after adjustment for BMI and considered beneficial.3,6,7 Human body fat distribution is a heritable trait which displays a strong degree of sexual dimorphism.8-10 Recent GWAS meta-analyses have identified multiple genetic loci associated with measures of body fat distribution (waist, hip and WHR), independent of BMI.11,12 Many of these loci are located within and/or near genes implicated in adipocyte development or function. Despite this the molecular mechanisms that determine human body fat patterning, and which link adipocyte biology, body fat distribution and metabolic disease risk, remain poorly understood. This has led to a growing need to establish suitable in vitro models to facilitate the investigation of regional adipocyte biology.
White adipose tissue (WAT) has traditionally been viewed as a site of energy storage and release, though WAT is now also increasingly recognized as a complex endocrine organ.13 However, not all WAT is alike.14,15 WAT depots from different regional sites in the human body exhibit distinct functional properties relating to: lipid storage16,17 and turnover,18,19 adipokine secretion,20,21 and inflammation.22,23 Transcriptional profiling of WAT, to identify depot-specific gene expression, has demonstrated a strong enrichment for developmental genes involved in embryological patterning,24-27 suggesting different WAT depots have divergent developmental origins.28 Similar depot-specific transcriptional profiles are also observed in isolated adipocyte precursors (preadipocytes).29 These depot-specific expression profiles are intrinsic and are retained across multiple preadipocyte generations when sub-cultured in vitro.27,29 Furthermore, preadipocytes differentiated in vitro retain many of the functional traits of their depot of origin e.g. lipolytic activity, fatty acid metabolism, and adipokine secretion.30-32 In addition they exhibit different cellular dynamics including rates of replication, adipogenic capacity, and sensitivity to apoptotic stimuli.33,34
A prerequisite for an in vitro model to aid the study of body fat distribution is the ability to examine preadipocytes from more than one WAT depot in parallel. This requirement is not met by any of the currently available rodent or human preadipocyte cell lines (e.g., 3T3-L1, Simpson-Golabi-Behmel-Syndrome (SGBS) or ChubS7 cell lines).35-37 In this study we report the successful generation of immortalised (im) human preadipocyte (PAD) cell lines derived from paired abdominal subcutaneous (ASAT) and gluteal subcutaneous adipose tissue (GSAT), referred to herein as imAPAD and imGPAD, respectively. The imAPAD and imGPAD cell lines display enhanced proliferation rates compared with primary cells isolated from the same donor (1°APAD and 1°GPAD). Furthermore, they retain the capacity for terminal adipogenic differentiation, de novo lipogenesis (DNL) and catecholamine-stimulated lipolysis. Finally, they possess inherent gene expression signatures that mirror those of 1°APAD and 1°GPAD human preadipocytes. To our knowledge this represents the first example of paired human preadipocyte cell lines derived from abdominal and gluteal subcutaneous adipose tissue.
Results
Generation of hTERT and HPV16-E7 co-expressing human preadipocyte cell lines
To generate the imAPAD and imGPAD cell lines paired 1°APAD and 1°GPAD cells, originating from the same male donor, were transduced with lentiviral particles carrying the human telomerase (hTERT) gene and the human papillomavirus type-16 E7 oncoprotein (HPV16-E7). Protein expression of hTERT and HPV16-E7 was confirmed in the imAPAD and imGPAD cell lines by Western blot analysis (Fig. 1A). hTERT and HPV16-E7 protein activity was over 100-fold higher in imAPAD and imGPAD cell lines than that observed in the 1°APAD and 1°GPAD cells (Fig. 1B). Collectively these data confirmed the successful overexpression of hTERT and HPV16-E7 in the imAPAD and imGPAD cell lines.
Figure 1.
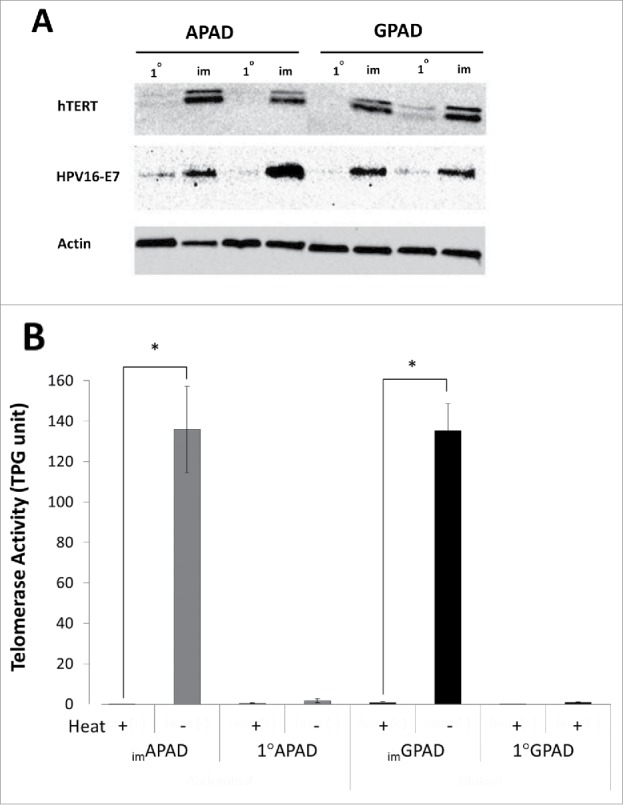
Overexpression of hTERT and HPV16-E7 in imAPAD and imGPAD cell lines. (A) overexpression of hTERT and HPV16-E7 protein was confirmed by Western blotting in the paired imAPAD and imGPAD cell lines (passage 15–17) and compared with 1°APAD and 1°GPAD preadipocytes (passage 6) from the same donor. Labeling for actin is shown as a loading control. (B) Telomerase activity was determined in imAPAD and imGPAD cell lines (passage 11) and 1°APAD and 1°GPAD cells (passage 6) (n = 3, mean ± SEM; *P < 0.05, paired samples t-test). Heat treatment was used to inactivate telomerase as a negative control.
Proliferative capacity of imAPAD and imGPAD cell lines
Proliferating imAPAD and imGPAD cell lines displayed a fibroblast-like morphology and were visually comparable to 1°APAD and 1°GPAD cells (Fig. 2A). Proliferation rates of the immortalised cell lines were compared with those of the primary cells (Fig. 2B). Both sets of cells were plated at a low density and cultured for 4 d before counting. Significantly higher cell counts were obtained for the imAPAD and imGPAD cell lines; the mean doubling time of imAPAD and imGPAD cell lines (passages 9–12) was 1.1 ± 0.03 d for both cell lines, compared with 1.6 ± 0.13 d and 1.5 ± 0.11 d for the 1°APAD and 1°GPAD cells, respectively. The proliferation rates of imAPAD and imGPAD cells were equivalent and no significant depot difference was observed between the 2 cell lines (P = 0.18). At passage 14 the 1°APAD and 1°GPAD cells became senescent and failed to proliferate despite extending the culture period to 7 d (Supplementary Fig. 1) and further comparisons between the immortalised cell lines and primary cells were not possible. In contrast, the imAPAD and imGPAD cell lines retained their proliferative capacity up to passage 30 with mean doubling times of 1.0 ± 0.03 and 1.1 ± 0.05, respectively (Fig. 2B).
Figure 2.
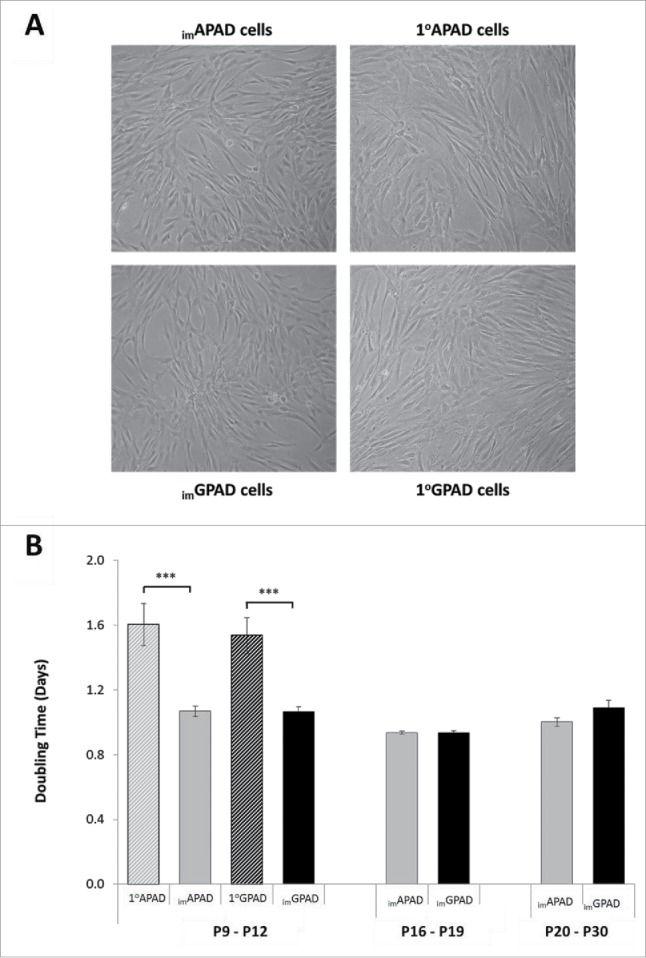
Proliferation of imAPAD and imGPAD cell lines. (A) Light microscopy of proliferating imAPAD and imGPAD cell lines compared with 1°APAD and 1°GPAD cells (x 100 magnification). (B) Cell doubling time of paired imAPAD/imGPAD cell lines was compared with 1°APAD/1°GPAD cells (passage 9–12). Proliferation rates were examined up to passage 30 for imAPAD/imGPAD cells but 1°APAD and 1°GPAD cells failed to proliferate after passage 14 (n = 6–8, mean ± SEM; ***P < 0.001; paired samples t-test for cell line vs. primary cells).
Transcriptional profiles of imAPAD and imGPAD cell lines during adipogenic differentiation
The phenotypic and functional changes that occur during the transition of preadipocytes to differentiated adipocytes are under the regulation of several key transcription factors which include CEBPA, CEBPB, CEBPD and PPARG2. The mRNA expression of these transcriptional regulators were assessed over a 14-day adipogenic time-course in the imAPAD and imGPAD cell lines (passages 8–9) and compared with 1°APAD and 1°GPAD cells (passages 6–8). The expression profiles of imAPAD and imGPAD cells (Fig. 3) mirrored those of the 1°APAD and 1°GPAD (Supplementary Fig. 2) for all selected genes. As expected, expression of CEBPA and PPARG2 increased steadily throughout the differentiation period in all cells with maximal expression observed between days 10 and 14. By comparison, CEBPB and CEBPD exhibited a more rapid induction, peaking at day 2, and subsequently declining over the remainder of the time-course. Expression of the adipogenic transcription factors was equivalent between imAPAD and imGPAD cells. Overall, these data indicate that, at the mRNA level, the imAPAD and imGPAD cell lines retain the basic machinery required for successful white adipogenic differentiation. Furthermore, UCP1, a marker for brown and beige adipocytes showed essentially no expression at day 14 in both imAPAD (ΔΔCt: 0.27 ± 0.07) and imGPAD (ΔΔCt: 0.24 ± 0.04) cells compared with the high level of UCP1 expression observed in differentiated primary human brown adipocytes at day 14 (ΔΔCt: 44.9 ± 11.7). To confirm that white adipogenic capacity was retained in higher passage generations of the imAPAD and imGPAD cell lines, gene expression analyses were performed in passage 17–21 cells (Supplementary Fig. 3). As seen in early passage cells, both cell lines displayed strong induction of PPARG2 and CEBPA over the differentiation time-course with maximal levels observed at day 14. Expression levels were equivalent with no differences in expression between the imAPAD and imGPAD cell lines.
Figure 3.
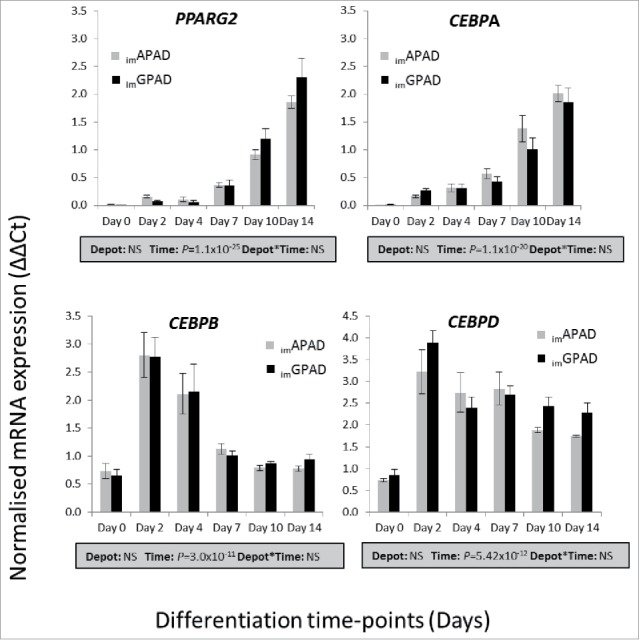
mRNA expression of adipogenic transcription factors in imAPAD and imGPAD cell lines during adipogenesis. mRNA expression of PPARG2, CEBPA, CEBPB and CEBPD over a 14 day adipogenic differentiation time-course was determined in imAPAD and imGPAD cells (passage 8–9) by real-time qPCR. Data are shown as ΔΔCt values (normalized to PPIA and PGK1; n = 6, mean ± SEM). A multivariate general linear model was used to test for statistical significance between depots and time, and to assess depot × time interactions. P-values are presented in the shaded boxes, NS: non-significant.
Intracellular lipid accumulation in imAPAD and imGPAD cell lines following adipogenesis
Following adipogenic differentiation for 14 d intracellular lipid droplets were visible by light microscopy in both imAPAD and imGPAD cell lines (passage 8–9) (Fig. 4). The final differentiated cell population was heterogeneous and contained some non-differentiated fibroblast-like cells in addition to the lipid-filled cells. This was also observed in the primary cells from which they were derived (Supplementary Fig. 4). Some subtle morphological differences were observed compared with the 1°APAD and 1°GPAD cells (passage 6–8). Specifically, the imAPAD and imGPAD cell lines exhibited a more spindle-shaped phenotype and contained fewer lipid droplets compared with their differentiated primary counterparts (Fig. 4). Adipogenic capacity was assessed using a fluorescent lipophilic dye (AdipoRed) which labels intracellular lipids. Intracellular lipid accumulation markedly increased in both imAPAD and imGPAD cells (3.5-fold and 7.9-fold, respectively) between day 0 (undifferentiated) and day 14 of differentiation (Fig. 5). In addition, markers of terminal adipocyte differentiation (PLIN1, INSR, ADIPOQ, LEP, CD36 and LPL) were highly expressed at day 14 with no difference in expression observed between the 2 cell lines, except for LEP which showed significantly higher expression in imGPAD cells (Fig. 6). Notably, the imGPAD cells accumulated more lipid than the imAPAD cells; this recapitulated the depot-difference in intracellular lipid accumulation observed between 1°APAD and 1°GPAD cells. Despite the robust adipogenic capacity displayed by the imAPAD and imGPAD cell lines, total intracellular lipid accumulation was significantly lower (2.5-fold and 1.3-fold, respectively) when compared with the 1°APAD and 1°GPAD cells. Both imAPAD and imGPAD cell lines continued accumulating lipids even at higher passages (passage 25), with imGPAD having more visible lipid droplets than imAPAD (Supplementary Fig. 6).
Figure 4.
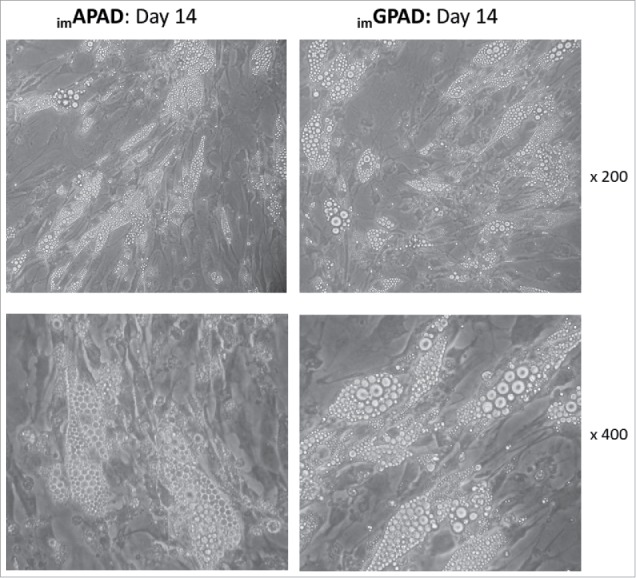
Light microscopy of imAPAD and imGPAD cell lines after adipogenic differentiation. Lipid droplet accumulation was visible in both imAPAD and imGPAD cell lines (passage 8–9) following a 14 day adipogenic differentiation time-course (upper panels: x 200 magnification; lower panels: x 400 magnification).
Figure 5.
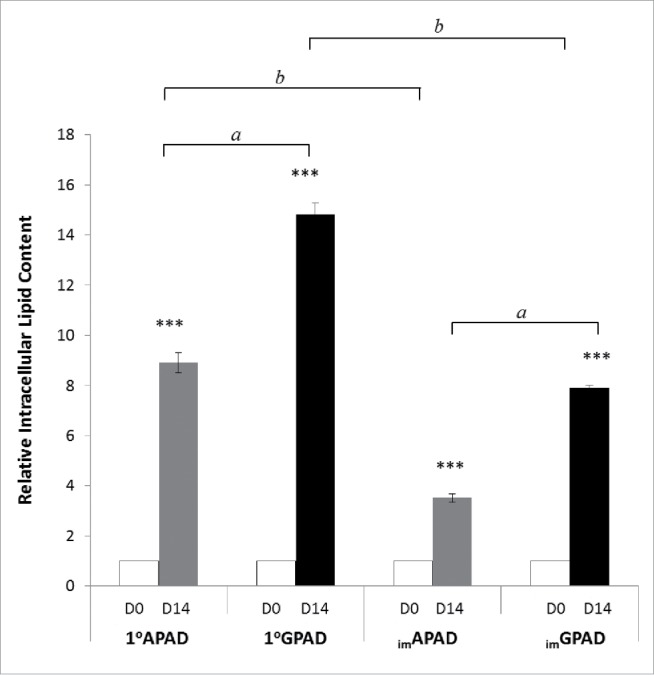
Intracellular lipid accumulation in imAPAD and imGPAD cell lines. Lipid accumulation was measured by AdipoRed assay in imAPAD and imGPAD cell lines (passage 10; n = 8) and 1°APAD and 1°GPAD cells (passage 8; n = 8). Lipid accumulation was determined on day 0 (D0) and day 14 (D14) of adipogenic differentiation and corrected for cell number. Data presented are relative to day 0 ± SEM. ***P < 0.0005; aAPAD vs. GPAD cells, bprimary vs. cell lines).
Figure 6.
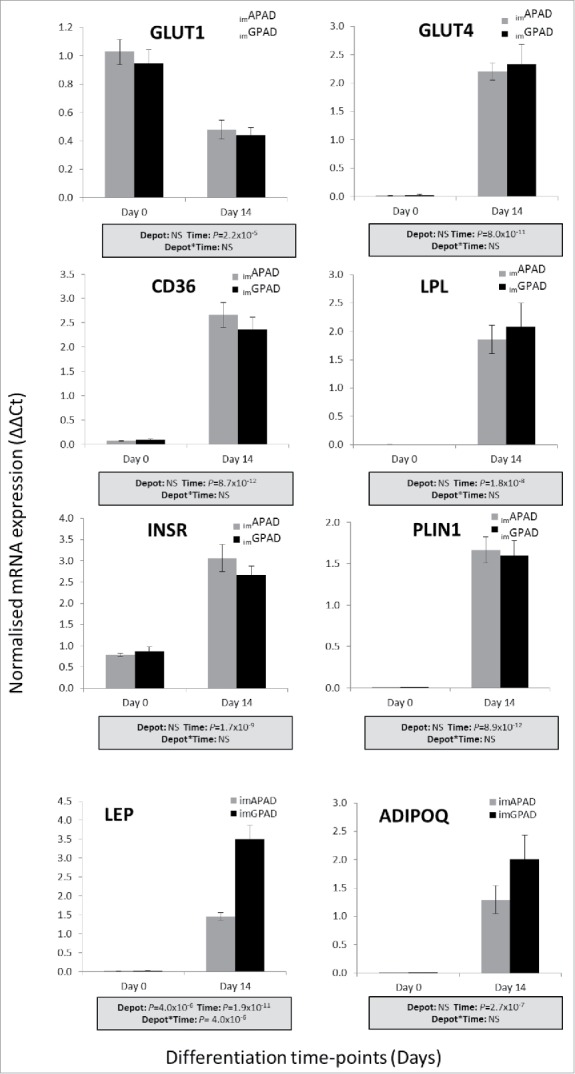
mRNA expression of genes involved in lipid and glucose metabolism in imAPAD and imGPAD cell lines. mRNA expression of INSR, GLUT1, GLUT4, CD36, LPL, PLIN1, ADIPOQ and LEP at day 14 day of adipogenic differentiation was determined by real-time qPCR in imAPAD and imGPAD cell lines (passage 8–9). Data are shown as ΔΔCt (normalized to PPIA and PGK1; n = 6, mean ± SEM). A multivariate general linear model was used to test for statistical significance between depots and time, and to assess depot × time interactions. P-values are presented in the shaded boxes, NS: non-significant.
Intracellular triglyceride (TAG) fatty acid composition of differentiated imAPAD and imGPAD cells (passage 17) was examined by gas chromatography and revealed the principle fatty acid constituents in both cell lines to be: 16:0, 16–1n-7, 18:0, 18:1n-9 and 18:1n-7 (Table 1). Since no exogenous fatty acids were added to the culture medium the TAG composition was in keeping with synthesis and modification of these endogenous fatty acids by intrinsic DNL, Δ9desaturation and elongation pathways. Consistent with this, mRNA expression of key enzymes involved in each of these pathways (ACACA, FASN, SCD, ELOVL3 and ELOV5) was readily detected in both imAPAD and imGPAD preadipocytes (Table 1). Notably, imGPAD cells contained a higher proportion of 18:1n-7 (vaccenic acid), the elongation product of Δ9 desaturase (SCD)-derived 16:1n-7 (palmitoleic acid), compared with imAPAD cells (Table 1). Fatty acid ratios were calculated as indices of SCD and elongase activity. Both 18:1n-7/16:0 and 18:1n-7/16:1n-7 ratios were higher in imGPAD cells. ELOVL3 gene expression was also significantly higher in imGPAD compared with imAPAD at day 14, however there was no significant difference in SCD mRNA expression between imAPAD and imGPAD cells. Finally, the imGPAD cells showed a tendency for higher total TAG content than the imAPAD cells (Table 1) which was consistent with AdipoRed data from 1°APAD and 1°GPAD cells and earlier passage imAPAD and imGPAD cells.
Table 1.
TAG fatty acid composition and mRNA expression of lipid metabolism genes in imAPAD and imGPAD cell lines at day 14.
| Glucose media |
Glucose + fatty acid media |
|||
|---|---|---|---|---|
| imAPAD | imGPAD | imAPAD | imGPAD | |
| Fatty acid (mol %) | ||||
| 14:0 | 4.80 ± 1.00 | 2.70 ± 0.10 | 0.50 ± 0.07 | 1.00 ± 0.04* |
| 16:0 | 36.2 ± 3.90 | 28.3 ± 0.30 | 27.2 ± 0.13 | 26.0 ± 0.15* |
| 16:1n-7 | 9.30 ± 0.40 | 10.3 ± 0.90 | 2.00 ± 0.04 | 4.20 ± 0.10* |
| 18:0 | 10.1 ± 0.60 | 7.00 ± 0.8 | 2.20 ± 0.01 | 2.60 ± 0.02* |
| 18:1n-9 | 28.0 ± 2.60 | 27.5 ± 0.80 | 50.6 ± 0.10 | 51.8 ± 0.24 |
| 18:1n-7 | 9.90 ± 0.12 | 22.7 ± 0.12* | N.D. | N.D |
| 18:2n-6 | 3.30 ± 0.80 | 1.60 ± 0.40 | 17.6 ± 0.08 | 14.4 ± 0.19* |
| Total fatty acids (µmol/l) | 37.0 ± 1.4 | 100.8 ± 29.5 | 352.7 ± 28.0 | 456.7 ± 5.6* |
| Fatty acid ratios | ||||
| 16:1n-7/16:0 | 0.26 ± 0.03 | 0.36 ± 0.04 | 0.07 ± 0.002 | 0.16 ± 0.005* |
| 18:1 n-7/16:0 | 0.29 ± 0.06 | 0.80 ± 0.05* | N.D. | N.D. |
| 18:1 n-7/16:1n-7 | 1.06 ± 0.09 | 2.22 ± 0.10* | N.D. | N.D. |
| 18:0/16:0 | 0.28 ± 0.02 | 0.25 ± 0.03 | 0.08 ± 0.001 | 0.10 ± 0.001* |
| [13C] DNL calculations | ||||
| 16:0 content1 | 1.73 ± 0.25 | 3.64 ± 1.04 | 12.3 ± 1.03 | 15.2 ± 0.27 |
| [13C]16:0 content1 | 0.21 ± 0.01 | 0.55 ± 0.05* | 0.30 ± 0.05 | 0.62 ± 0.06* |
| [13C]16:0 carbon label (%) | 12.5 ± 1.07 | 16.5 ± 2.69 | 2.50 ± 0.56 | 4.06 ± 0.37* |
| mRNA expression | ||||
| ACACA | 2.35 ± 0.11 | 2.36 ± 0.17 | 1.51 ± 0.08 | 1.63 ± 0.07* |
| FASN | 2.25 ± 0.19 | 2.30 ± 0.33 | 1.29 ± 0.18 | 1.06 ± 0.16 |
| SCD | 1.88 ± 0.23 | 2.13 ± 0.38 | 1.25 ± 0.20 | 1.20 ± 0.06 |
| ELOVL3 | 0.22 ± 0.03 | 0.45 ± 0.03* | 0.20 ± 0.01 | 0.36 ± 0.03* |
| ELOVL5 | 0.63 ± 0.04 | 0.48 ± 0.08 | 0.56 ± 0.05 | 0.34 ± 0.01* |
Note. Cells were differentiated in media containing 17.5 mM glucose or 17.5 mM glucose + 200µM fatty acid mixture (45% oleate, 30% palmitate, 25% linoleate). 12.5 mM of the final glucose concentration was isotopically labeled with [U-13C] to assess de novo lipogenesis (DNL); 1 µg per 4 × 10⁵ cells. Data are presented as means ± SEM (n = 3). *P < 0.05; imAPAD vs. imGPAD; paired samples t-test.
To examine handling of exogenous fatty acids by the imAPAD and imGPAD cells a fatty acid mixture comprising of oleate:palmitate:linoleate (45:30:25%) was added to the culture medium for the last 7 d of differentiation. This led to a significant increase in intracellular TAG content in the imAPAD (5.0 ± 0.2 vs. 48.3 ± 3.8 µg/ 4 × 10⁵ cells; P < 0.05) and imGPAD cell lines (13.6 ± 4.0 vs. 62.4 ± 0.7 µg/ 4 × 10⁵ cells; P < 0.05). Despite both being exposed to the same fatty acid mixture there were significant differences in TAG fatty acid composition between imAPAD and imGPAD cells; 95% of imAPAD TAG was accounted for by the exogenous fatty acids. By comparison TAG in imGPAD cells comprised 92% exogenous and 8% endogenous fatty acids. Specifically, 14:0 and 16:1n-7 were 2-fold higher in imGPAD compared with imAPAD cells. Consistent with a higher capacity for synthesis of endogenous fatty acids the rate limiting enzyme for DNL, ACACA, was found to be more highly expressed in imGPAD cells than imAPAD cells, as was ELOVL3 (Table 1).
To further examine differences in DNL between the imAPAD and imGPAD cells isotopically labeled D-[U-13C] glucose was added to the differentiation medium, and 13C-enrichment of TAG-16:0 was measured at day 14 by gas-chromatography mass-spectrometry (GC-MS). In line with previous work,38 the mass isotopomer spectrum showed greater labeling from M+1 to M+5, with decreased higher labeling up to M+16; the proportion of TAG-16:0 derived from [U-13C] glucose was calculated as 12.5% in imAPAD cells and 16.5% in imGPAD cells (Table 1). This equated to a significantly (2-fold) higher total amount of 13C-labeled TAG-16:0 in imGPAD cells compared with imAPAD cells (Table 1). No differences in expression of glucose transporters, GLUT1 and GLUT4, were observed between imAPAD and imGPAD cells (Fig. 6). In experiments where exogenous fatty acids were added to the differentiation medium 13C-labeled TAG-16:0 was also 2-fold higher in imGPAD cells. Overall these data suggest that the imGPAD cells possess a higher intrinsic capacity for DNL, Δ9 desaturation and 16:1n-7 elongation than the imAPAD cells.
Catecholamine-stimulated lipolysis in imAPAD and imGPAD cells
To further examine functionality of the in vitro differentiated imAPAD and imGPAD cell lines (passage 16–17) glycerol release was determined as a direct measure of lipolysis (Fig. 7). Basal lipolysis was approximately 2-fold higher in the imGPAD cells compared with imAPAD cells and this tracked closely with intracellular TAG content (Fig. 7A). Therefore catecholamine-stimulated glycerol release data were normalized to intracellular TAG content. The addition of adrenaline (100nM) or isoprenaline (100nM) induced a significant 2-fold increase in the release of glycerol into the culture medium compared with baseline levels (Fig. 7B). No significant difference in glycerol release was observed between the imAPAD and imGPAD cell lines. Consistent with this finding, mRNA expression of adrenergic receptors (ADRB1 and ADRA2A) and adipose tissue lipases (PNPLA2 and LIPE) was not significantly different between the imAPAD and imGPAD cells (Fig. 7C).
Figure 7.
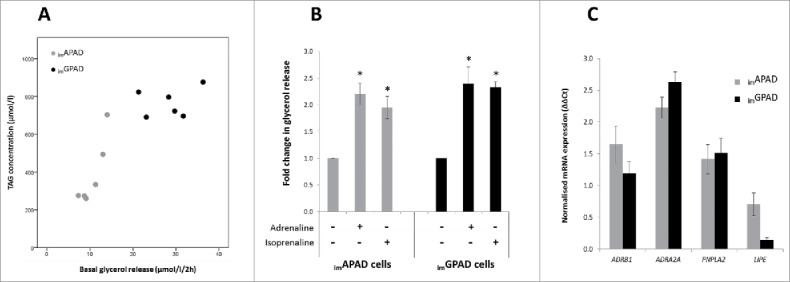
Lipolysis in imAPAD and imGPAD cell lines. (A) Basal glycerol release plotted against total TAG content in imAPAD and imGPAD cell lines (passage 16–17). (B) Catecholamine-stimulated glycerol release in imAPAD and imGPAD cells relative to basal glycerol release. Cells were treated with 5 mM KRH buffer containing either adrenaline (100nM) or isoprenaline (100nM) (n = 3, mean ± SEM, normalized for total TAG content; *P < 0.05, Wilcoxon signed-rank). (C) mRNA expression of adrenergic receptors and lipases at day 14 of adipogenic differentiation in imAPAD and imGPAD cells (passage 8–9). Data are shown as ΔΔCt values (normalized to PPIA and PGK1; n = 6, mean ± SEM).
Inherent depot-specific developmental gene expression in imAPAD and imGPAD cell lines
We previously reported that undifferentiated imAPAD and imGPAD cell lines retain inherent depot-specific mRNA expression patterns which mirror those seen in whole ASAT and GSAT.39 Here we selected 2 of the previously reported genes with the most differential expression (HOXA5 and HOTAIR) and examined their expression pattern across a differentiation time-course in imAPAD and imGPAD cell lines (passage 8–9) compared with 1°APAD and 1°GPAD cells (passage 6–8). Both HOXA5 and HOTAIR displayed strong depot-specific expression between the imAPAD and imGPAD cell lines (Fig. 8A and B); HOXA5 expression was significantly higher in imAPAD compared with imGPAD whereas the opposite was observed for HOTAIR. Both genes were significantly upregulated over the differentiation time course in imAPAD and imGPAD, suggesting a regulated role in adipogenesis. The depot-specific expression patterns were retained across the entire 14 day differentiation time-course, and were consistent with expression patterns observed in the 1°APAD and 1°GPAD cells (Fig. 8C and D). Depot-specific expression of HOXA5 and HOTAIR was retained in imAPAD and imGPAD cells up to passage 30 indicating that depot differences between imAPAD and imGPAD cells are maintained across multiple cell generations (Supplementary Fig. 5A and B).
Figure 8.
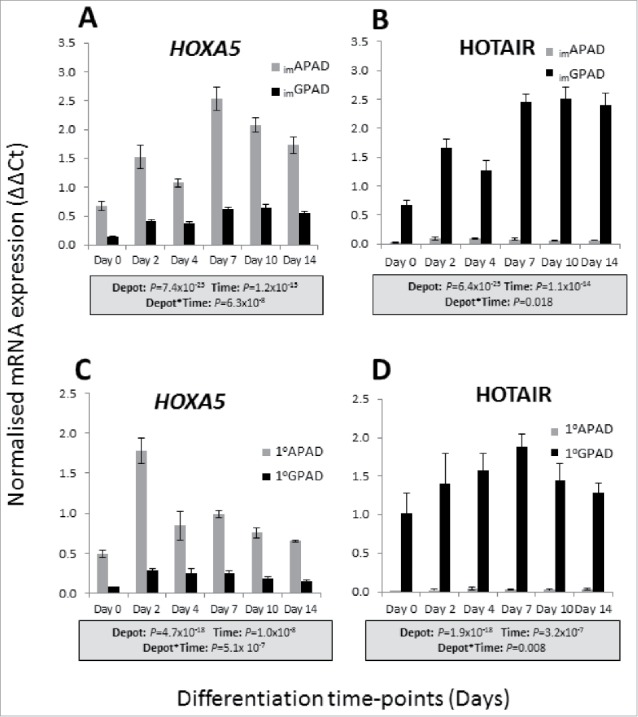
Inherent depot-specific expression of developmental genes in imAPAD and imGPAD cells. mRNA expression of HOXA5 and HOTAIR over a 14 day adipogenic differentiation time-course was determined by real-time qPCR in imAPAD and imGPAD cell lines (A and B) and 1°APAD and 1°GPAD cells (C and D). Data are shown as ΔΔCt (normalized to PPIA and PGK1; n = 6, mean ± SEM). A multivariate general linear model was used to test for statistical significance between depots and time, and to assess depot x time interactions. P-values are presented in the shaded boxes, NS: non-significant.
Discussion
The imAPAD and imGPAD cell lines reported herein represent a novel tool to aid the investigation of depot-specific adipocyte function. The disparity in metabolic disease risk conferred by GSAT and ASAT accumulation in humans remains largely unexplained.3,6 Consequently, there is an obvious need to explore molecular mechanisms controlling adipocyte commitment, differentiation and function in these contrasting WAT depots. Nonetheless, research in this field has been hampered by the lack of a suitable human in vitro adipogenic model and, to our knowledge, there is currently no paired ASAT-GSAT human preadipocyte cell line in use.
The imAPAD and imGPAD cell lines, which co-express hTERT and HPV16-E7, display enhanced proliferation rates and continue to divide even at passage 30 whereas primary cells fail to proliferate after passage 14. The imAPAD and imGPAD cell lines also retain the capacity for white adipogenic differentiation and de novo synthesis of fatty acids. Thus they overcome some of the main limitations of primary human preadipocyte cultures i.e., limited supply of human WAT, a finite capacity for expansion and loss of adipogenic capacity when cultured in vitro. It should be noted that the capacity for adipogenic differentiation is modestly reduced when compared with that of 1° APAD and 1° GPAD cells. The reason for this is not entirely clear, however, HPV-E7 has been described to inhibit activity of the glycolytic enzyme pyruvate kinase.40 This rate-limiting enzyme regulates the amount of glucose available for de novo lipogenesis and thus may explain the lower lipid accumulation in the immortalised cells compared with the primary cells.
Most importantly the imAPAD and imGPAD cells retain intrinsic functional characteristics of their depot-of-origin. Specifically, imGPAD cells displayed a higher incorporation of 13C-labeled glucose into TAG-palmitate suggesting they possess a higher capacity for DNL than the imAPAD cells. This is consistent with higher mRNA expression of ACACA in the imGPAD cells and mirrors the depot difference in lipid accumulation that was seen in the originating primary cells. Whether differences in insulin-stimulated glucose uptake also contribute to the higher incorporation of 13C-glucose in imGPAD cells cannot be excluded. However, there were no significant depot differences in expression of GLUT1, GLUT4 or INSR. Furthermore, TAG synthesized by imGPAD cells was more enriched for monounsaturated fatty acids (16:1n-7 and 18:1n-7) derived from SCD (Δ9-desaturase) and elongase activity than TAG in the imAPAD cells. Similar findings were previously reported in human primary preadipocytes isolated from different donors.21 The DNL pathway is tightly coupled with these fatty acid modification pathways in adipocytes,41 and our findings of higher fatty acid flux through SCD and elongation pathways in imGPAD cells is consistent with the reported fatty acid composition of in vitro differentiated primary preadipocytes and adipose tissue samples from GSAT and ASAT.21,42 A potential role for 16:1n-7 as an insulin-sensitizing lipokine has previously been proposed although evidence supporting this role in humans remains weak.43,44,45 Nevertheless, the finding that GSAT-derived preadipocytes retain intrinsic mechanisms favoring synthesis of SCD-derived fatty acids highlights notable differences in endogenous fatty acid metabolism between GSAT and ASAT. This functional attribute may in turn be of importance for understanding the differential metabolic risk conferred by these 2 WAT depots, which requires further mechanistic investigation.
The imAPAD and imGPAD cell lines retain striking depot-specific expression of 2 developmental transcription factors involved in embryogenesis and organ development (HOXA5, HOTAIR). The HOXA5 and HOTAIR expression patterns mirror those seen in the originating primary preadipocytes and are consistent with depot-specific expression patterns observed in whole ASAT and GSAT.26,27 These genes have also been implicated in regulation of adipose tissue function.46,47 Therefore differential expression of HOXA5 and HOTAIR may contribute to functional differences seen between depots. These observations support the view that preadipocyte populations from different WAT depots are inherently distinct with depot-specific gene expression likely under epigenetic control. Indeed, we have previously reported depot-specific DNA methylation patterns of several developmental genes (HOTAIR, TBX5) which regulate adipogenesis in the imAPAD and imGPAD cells.27 Thus these cell lines may also prove useful for investigating epigenetic regulation of regional adipocyte biology. Furthermore, inherent differences in components of the WNT-signaling pathway have recently been described between the imAPAD and imGPAD cell lines.48 Notably, in these experiments, knockdown of the Wnt co-receptor, LRP5, led to opposite effects on adipocyte differentiation in imAPAD and imGPAD cells. These experiments demonstrate the usefulness of the imAPAD and imGPAD cells for genetic modification studies. It also highlights the importance of performing studies in paired cells rather than cells derived from a single WAT depot when investigating the molecular mechanisms of body fat distribution.
As well as expressing the basic transcriptional machinery required for successful adipogenic differentiation, the in vitro differentiated imAPAD and imGPAD cells responded to catecholamine stimulation with a 2-fold induction in glycerol release. This response was similar in magnitude to that reported for the Chub-S7 human preadipocyte cell line which derives from ASAT and also co-expresses hTERT and HPV16-E7.35 It is well established that human gluteal or femoral adipocytes are less responsive to catecholamine-stimulated lipolysis than subcutaneous abdominal adipocytes.19,49-52 Specifically, gluteofemoral adipocytes are resistant to adrenaline induced-lipolysis while retaining a robust lipolytic response to the β-selective agonist isoprenaline. However, here we report no apparent depot difference in lipolytic response to adrenaline or isoprenaline between the imAPAD and imGPAD cells. It should be noted that previous findings were exclusively based on freshly isolated mature adipocytes50-52 or on in vivo measurements of adipose tissue lipolysis.19,49 Whether depot differences in lipolysis are an intrinsic feature of in vitro differentiated preadipocytes has not been demonstrated. The resistance of gluteal adipocytes to adrenaline has been attributed to an increased anti-lipolytic (α-adrenergic) responsiveness.19,50,51 Although we observed a tendency for higher ADRA2A expression in imGPAD cells the depot differences in gene expression were considerably blunted in comparison to those reported for whole tissue biopsies19 and freshly isolated adipocytes.53 Furthermore, loss of α-adrenergic anti-lipolytic responsiveness has previously been observed for in vitro differentiated primary human preadipocytes, suggesting the loss of depot-specific differences in lipolysis may be a consequence of the in vitro culture conditions, 54 for example the absence of a local paracrine and/or endocrine factor(s). The dose of agonist selected for imAPAD and imGPAD lipolysis studies (10−7M) had previously been shown to induce maximal lipolysis in human abdominal and gluteal adipocytes in vitro and depot-specific glycerol release was also reported at this dose.30,50 However, it is possible that this concentration is suboptimal for detecting depot differences between the imAPAD and imGPAD cells and further studies are required to investigate this.
In summary, we have generated imAPAD and imGPAD cell lines which are a novel in vitro model for investigating depot-specific preadipocyte function. Elucidating the mechanisms that underlie the different risk profiles and metabolic profiles of ASAT and GSAT is important for developing targeted therapies for obesity and its related metabolic disease.
Methods
Isolation and culture of human primary white and brown preadipocytes
Ethical approval for adipose biopsies was granted by Oxfordshire Clinical Research Ethics Committee (WAT study: 08/H0606/107 and brown adipose tissue study: 12/SC/0446) and the study participants gave written informed consent. WAT biopsies were obtained from a 50-year old healthy male (BMI: 24.4 kg/m2) from the Oxford Biobank (http://www.oxfordbiobank.org.uk) who had given consent to be re-approached for research purposes. Paired WAT biopsies were taken under local anesthetic (1% lignocaine) by needle aspiration at the level of the umbilicus (ASAT) and from the upper-, outer-quadrant of the gluteal region (GSAT). Primary preadipocytes (1°) were isolated from ASAT and GSAT biopsies as described previously.41,55 Preadipocytes were cultured in Dulbecco's modified Eagle's medium/F12 Ham's nutrient mixture (v/v, 1:1) containing 17.5 mM glucose and supplemented with 10% foetal calf serum, 0.25 ng/ml fibroblast growth factor, 2 mM glutamine, 100 units/ml penicillin and 100 µg/ml streptomycin. Cell stocks of 1° APAD and 1° GPAD cells were prepared and stored in liquid nitrogen for future studies. A brown adipose tissue biopsy was obtained from a 36-year old male patient undergoing thyroid carcinoma surgery (BMI >30). Preadipocytes were isolated and cultured using the same protocol described above.
Generation of preadipocyte cell lines
The imAPAD and imGPAD preadipocyte cell lines were generated according to the method of Darimont et al.35 with additional modifications. Briefly, human telomerase reverse transcriptase (hTERT) and human papillomavirus type 16 E7 oncoprotein (HPV16-E7) were sub-cloned into the pLenti6.3/V5-DEST lentiviral expression vector (Invitrogen) from the pBABE-neo-hTERT and pGEX2T E7 plasmids (Addgene), respectively. For the constitutive expression of hTERT and HPV16-E7 lentiviral particles were generated in 293FT producer cells using the ViraPower HiPerform Lentiviral Expression System (Invitrogen). 1° APAD and 1° GPAD cells were pre-treated with hexadimethrine bromide (8 µg/ml) and then transduced with hTERT lentiviral particles. To select preadipocytes constitutively expressing hTERT cells were cultured in the presence of blasticidin (2 µg/ml). Blasticidin treatment of non-transduced cells was used to determine the optimal lethal concentration of blasticidin. Blasticidin-resistant cells were then transduced with HPV16-E7 lentiviral particles. Expression of hTERT and HPV16-E7 was driven by the human cytomegalovirus (CMV) immediate early promoter within the pLenti6.3/V5 vector. imAPAD and imGPAD cells were cultured as described for human primary preadipocytes with the addition of blasticidin (2 µg/ml) to the culture medium.
Western blot analysis
Protein expression of hTERT and HPV16-E7 was confirmed by Western blotting. Cell lysates were prepared in ice-cold lysis buffer containing 50 mM Tris pH8.0, 250 mM NaCl, 5 mM EDTA, 0.5% Igepal CA-630, 10 mM sodium fluoride, 1 mM sodium orthovanadate and protease inhibitors (Complete EDTA-free, Roche). Equal amounts of protein (25 µg) were resolved by SDS-PAGE, transferred onto polyvinylidene fluoride membrane (Bio-Rad) and immunoblotted with the following antibodies: anti-HPV16-E7 (1:200, sc-51951: Santa Cruz Biotechnology), anti-hTERT (1:500, Y050419: Applied Biological Materials Inc.), anti-actin (1:2000, sc-1616: Santa Cruz Biotechnology) followed by horseradish peroxidise-conjugated secondary antibodies: goat anti-rabbit IgG (1:2000, #170–6515: Bio-Rad) and goat anti-mouse IgG (1:1000, P0447: Dako). Detection was performed by enhanced chemiluminescence (GE Healthcare).
Telomerase activity
Telomerase activity was measured using the TRAPeze XL Telomerase Detection kit (Millipore; S7707). 1 × 10⁶ cells were lysed in CHAPS lysis buffer. Sample preparation and PCR amplification was performed according to the manufacturer's instructions. Each sample extract was assayed in duplicate either with or without heat treatment (85°C) to provide a negative control. PCR yield was determined by measuring fluorescent signal (excitation: 485 nm and emission: 530 nm) on a CytoFluor Multi-Well Plate Reader series 4000 (PerSeptive Biosystems).
Proliferation
The imAPAD / imGPAD cell lines (passage 9 – 30) and 1° APAD / 1° GPAD cells (passage 9 – 14) were seeded at a low density (2000 cells/cm2)and maintained in growth medium for 4 d at which point the cells were still sub-confluent. Cells were trypsinised and counted manually using a haemocytometer or using an automated Cellometer Auto T4 (Nexcelom Bioscience). Doubling time (DT) was calculated as previously described48 using the following formula: DT = T × ln2/ln(cellsend/cellsstart) where T = culture time (days).
Adipogenic differentiation culture conditions
Fully confluent white preadipocytes were stimulated for 14 d with an adipogenic cocktail consisting of Dulbecco's modified Eagle's medium/F12 Ham's nutrient mixture (v/v, 1:1), 17.5 mM glucose, 2 mM glutamine, 17 μM pantothenate, 100 nM human insulin, 10 nM triiodo-L-thyronine, 33 μM biotin, 10 μg/ml transferrin, 1 μM dexamethasone, 100 units/ml penicillin and 100 µg/ml streptomycin. Troglitazone (4 μM) and 3-isobutyl-1-methylxanthine (0.25 mM) were added to the adipogenic medium for the first 4 d. For experiments using exogenous fatty acids, a fatty acid mixture (200 µM) comprising oleate:palmitate:linoleate (45:30:25%) bound to BSA was added to the differentiation medium from day 7 onwards and troglitazone (4 μM) was included throughout the whole time course. Fully confluent brown preadipocytes were differentiated according to the protocol above for 14 d. Cells were then stimulated with forskolin (10 µM) for 4 h and collected for further analyses.
Gene expression analysis
cDNA was synthesized from 500 µg of total RNA extracted from preadipocytes using the High Capacity cDNA Reverse Transcription Kit (Life Technologies, UK). qPCR was performed on a 1/40 cDNA dilution using Taqman Assays-on-Demand (Applied Biosystems) and Kapa Probe Fast Mastermix (Kapa Biosystems) on an ABI Prism 7900HT. Reactions were performed in a final volume of 6µl in triplicate. Relative transcript expression was calculated using the ΔΔCt relative quantification method56 where ΔCt = Assay efficiency(min CT- SampleCT). The ΔCT values of target genes were normalized to the ΔCt (geometric mean) of reference transcripts PPIA and PGK1.57
Measurement of intracellular lipid content
Intracellular lipid was measured in preadipocytes using the AdipoRed Assay (Lonza) according to the manufacturer's instructions. Fluorescence was measured (excitation: 485 nm and emission: 580 nm) on a CytoFluor Multi-Well Plate Reader series 4000 (PerSeptive Biosystems).
Gas chromatography (GC) analysis of TAG fatty acids
Total lipids were extracted from differentiated preadipocytes at day 14,58 TAG separated and fatty acid methyl esters (FAMEs) prepared and analyzed by GC as previously described.41 Analytic accuracy was assessed using external and in-house quality control samples (AOCS std#6, Thames Restek UK Ltd; Seven Seas Ltd, Hull, UK). Known amounts of an internal standard (glyceryl pentadecanoate (15:0) were added to samples before extraction. Fatty acid concentrations were calculated relative to the internal standard and results were expressed either as µg of fatty acid per 4 × 10⁵ cells or as a mole percentage. Fatty acid product to precursor ratios were calculated from mole percentages as indices of SCD activity (16:1n-7/16:0), elongase activity (18:1n-7/16:1n-7 and 18:0/16:0) and combined SCD and elongase activity (18:1n-7/16:0).
Measurement of [13C]-glucose incorporation into TAG-palmitate
Differentiation medium containing 5 mM glucose and 12.5 mM isotopically [U-13C]-labeled glucose (CK Gas, Cambridgeshire, UK) was added to cells throughout differentiation to determine the contribution glucose makes for DNL. After lipid extraction and separation of the TAG fraction the incorporation of 13C (from glucose) into TAG palmitate was measuring using GC-MS with monitoring ions with mass-to-charge ratios (m/z) of 270.3 (M+0) through to 286.3 (M+16).38,59 Relative abundance values were corrected for natural abundance in cells that were 13C-glucose naïve. The percentage of 13C-labeled carbon atoms in palmitate was determined by quantitative mass spectral analysis (QMSA) calculations were based on the method described by Tayek and Katz, 1996.60 Briefly, we calculated the fraction of all carbon atoms in palmitate that were 13C labeled (from the precursor 13C-glucose) as described.38
Lipolysis
Differentiated (day 14) preadipocytes were cultured for 24 h before experimentation in DMEM/F12 Ham containing 5 mM glucose, 10% foetal calf serum, 100 units/ml penicillin and 0.1 mg/ml streptomycin. On the experimental day cells underwent a 2 h washout period in Krebs Ringer HEPES (KRH) buffer containing 5 mM glucose and 3.5% bovine serum albumin. The cells were then incubated for 2 h in fresh KRH buffer (basal) followed by a 2 h incubation in KRH buffer containing either adrenaline (100 nM) or isoprenaline (100 nM). Samples were collected at the end of each 2 h incubation period and glycerol measurements were made using an enzymatic assay (GY105, Randox Laboratories Ltd). At the end of the experiment cells were harvested in lysis buffer containing 1% IGEPAL CA-630, 150 mM NaCl and 50 mM Tris-HCl (pH8.0). Cell lysates were sonicated and heated at 95°C for 30 minutes. Cooled lysates were centrifuged at 12,000 g for 10 minutes and cellular TAG concentration was measured by enzymatic assay (TAG assay, Instrumentation Laboratory UK). Glycerol and TAG assays were both run on an ILAB 650 clinical analyzer (Instrumentation Laboratory UK). Glycerol measurements were normalized to cellular TAG content.
Statistical methods
Statistical analyses were performed in SPSS 20.0. Statistical tests used were as described in the results section.
Supplementary Material
Abbreviations
- 1° APAD
primary abdominal preadipocytes
- 1° GPAD
primary gluteal preadipocytes
- ASAT
abdominal subcutaneous adipose tissue
- DNL
de novo lipogenesis
- GSAT
gluteal subcutaneous adipose tissue
- imAPAD
immortalised abdominal preadipocytes
- imGPAD
immortalised gluteal preadipocytes
- TAG
triacylglycerol
- WAT
white adipose tissue
Disclosure of potential conflicts of interest
No potential conflicts of interest were disclosed.
Funding
Catriona Hilton is funded by a MRC/Novo Nordisk UK Research Foundation clinical training fellowship. Leanne Hodson is a BHF Senior Fellow in Basic Science. We acknowledge the Oxford Biobank-NIHR Oxford Biomedical Research Center and the British Heart Foundation (BHF) (PG/12/78/29862).
References
- [1].Obesity: preventing and managing the global epidemic. Report of a WHO consultation. World Health Organ Tech Rep Ser 2000; 894:i-xii, 1-253; PMID:11234459 [PubMed] [Google Scholar]
- [2].Haslam DW, James WP. Obesity. Lancet 2005; 366:1197-209; PMID:16198769 10.1016/S0140-6736(05)67483-1 [DOI] [PubMed] [Google Scholar]
- [3].Yusuf S, Hawken S, Ounpuu S, Bautista L, Franzosi MG, Commerford P, Lang CC, Rumboldt Z, Onen CL, Lisheng L, et al.. Obesity and the risk of myocardial infarction in 27,000 participants from 52 countries: a case-control study. Lancet 2005; 366:1640-9; PMID:16271645; http://dx.doi.org/ 10.1016/S0140-6736(05)67663-5 [DOI] [PubMed] [Google Scholar]
- [4].Canoy D, Boekholdt SM, Wareham N, Luben R, Welch A, Bingham S, Buchan I, Day N, Khaw KT. Body fat distribution and risk of coronary heart disease in men and women in the European prospective investigation into cancer and nutrition in Norfolk cohort - A population-based prospective study. Circulation 2007; 116:2933-43; PMID:18071080; http://dx.doi.org/ 10.1161/CIRCULATIONAHA.106.673756 [DOI] [PubMed] [Google Scholar]
- [5].Sluik D, Boeing H, Montonen J, Pischon T, Kaaks R, Teucher B, Tjonneland A, Halkjaer J, Berentzen TL, Overvad K, et al.. Associations between general and abdominal adiposity and mortality in individuals with diabetes mellitus. Am J Epidemiol 2011; 174:22-34; PMID:21616928; http://dx.doi.org/ 10.1093/aje/kwr048 [DOI] [PubMed] [Google Scholar]
- [6].Snijder MB, Dekker JM, Visser M, Bouter LM, Stehouwer CD, Kostense PJ, Yudkin JS, Heine RJ, Nijpels G, Seidell JC. Associations of hip and thigh circumferences independent of waist circumference with the incidence of type 2 diabetes: the Hoorn Study. Am J Clin Nutr 2003; 77:1192-7; PMID:12716671 [DOI] [PubMed] [Google Scholar]
- [7].Manolopoulos KN, Karpe F, Frayn KN. Gluteofemoral body fat as a determinant of metabolic health. Int J Obes (Lond) 2010; 34:949-59; PMID:20065965; http://dx.doi.org/ 10.1038/ijo.2009.286 [DOI] [PubMed] [Google Scholar]
- [8].Malis C, Rasmussen EL, Poulsen P, Petersen I, Christensen K, Beck-Nielsen H, Astrup A, Vaag AA. Total and regional fat distribution is strongly influenced by genetic factors in young and elderly twins. Obes Res 2005; 13:2139-45; PMID:16421348; http://dx.doi.org/ 10.1038/oby.2005.265 [DOI] [PubMed] [Google Scholar]
- [9].Lehtovirta M, Kaprio J, Forsblom C, Eriksson J, Tuomilehto J, Groop L. Insulin sensitivity and insulin secretion in monozygotic and dizygotic twins. Diabetologia 2000; 43:285-93; PMID:10768089; http://dx.doi.org/ 10.1007/s001250050046 [DOI] [PubMed] [Google Scholar]
- [10].Wells JC. Sexual dimorphism of body composition. Best Pract Res Clin Endocrinol Metab 2007; 21:415-30; http://dx.doi.org/ 10.1016/j.beem.2007.04.007 [DOI] [PubMed] [Google Scholar]
- [11].Heid IM, Jackson AU, Randall JC, Winkler TW, Qi L, Steinthorsdottir V, Thorleifsson G, Zillikens MC, Speliotes EK, Magi R, et al.. Meta-analysis identifies 13 new loci associated with waist-hip ratio and reveals sexual dimorphism in the genetic basis of fat distribution. Nat Genet 2010; 42:949-60; PMID:20935629; http://dx.doi.org/ 10.1038/ng.685 [DOI] [PMC free article] [PubMed] [Google Scholar]
- [12].Shungin D, Winkler TW, Croteau-Chonka DC, Ferreira T, Locke AE, Magi R, Strawbridge RJ, Pers TH, Fischer K, Justice AE, et al.. New genetic loci link adipose and insulin biology to body fat distribution. Nature 2015; 518:187-96; PMID:25673412; http://dx.doi.org/ 10.1038/nature14132 [DOI] [PMC free article] [PubMed] [Google Scholar]
- [13].Galic S, Oakhill JS, Steinberg GR. Adipose tissue as an endocrine organ. Mol Cell Endocrinol 2010; 316:129-39; PMID:19723556; http://dx.doi.org/ 10.1016/j.mce.2009.08.018 [DOI] [PubMed] [Google Scholar]
- [14].White UA, Tchoukalova YD. Sex dimorphism and depot differences in adipose tissue function. Biochim Biophys Acta 2014; 1842:377-92; PMID:23684841; http://dx.doi.org/ 10.1016/j.bbadis.2013.05.006 [DOI] [PMC free article] [PubMed] [Google Scholar]
- [15].Karpe F, Pinnick KE. Biology of upper-body and lower-body adipose tissue–link to whole-body phenotypes. Nat Rev Endocrinol 2015; 11:90-100; PMID:25365922; http://dx.doi.org/ 10.1038/nrendo.2014.185 [DOI] [PubMed] [Google Scholar]
- [16].Koutsari C, Dumesic DA, Patterson BW, Votruba SB, Jensen MD. Plasma free fatty acid storage in subcutaneous and visceral adipose tissue in postabsorptive women. Diabetes 2008; 57:1186-94; PMID:18285557; http://dx.doi.org/ 10.2337/db07-0664 [DOI] [PubMed] [Google Scholar]
- [17].McQuaid SE, Humphreys SM, Hodson L, Fielding BA, Karpe F, Frayn KN. Femoral adipose tissue may accumulate the fat that has been recycled as VLDL and nonesterified fatty acids. Diabetes 2010; 59:2465-73; PMID:20682685; http://dx.doi.org/ 10.2337/db10-0678 [DOI] [PMC free article] [PubMed] [Google Scholar]
- [18].Martin ML, Jensen MD. Effects of body fat distribution on regional lipolysis in obesity. J Clin Invest 1991; 88:609-13; PMID:1864970; http://dx.doi.org/ 10.1172/JCI115345 [DOI] [PMC free article] [PubMed] [Google Scholar]
- [19].Manolopoulos KN, Karpe F, Frayn KN. Marked resistance of femoral adipose tissue blood flow and lipolysis to adrenaline in vivo. Diabetologia 2012; 55:3029-37; PMID:22898765; http://dx.doi.org/ 10.1007/s00125-012-2676-0 [DOI] [PubMed] [Google Scholar]
- [20].Nielsen NB, Hojbjerre L, Sonne MP, Alibegovic AC, Vaag A, Dela F, Stallknecht B. Interstitial concentrations of adipokines in subcutaneous abdominal and femoral adipose tissue. Regul Pept 2009; 155:39-45; PMID:19376162; http://dx.doi.org/ 10.1016/j.regpep.2009.04.010 [DOI] [PubMed] [Google Scholar]
- [21].Pinnick KE, Neville MJ, Fielding BA, Frayn KN, Karpe F, Hodson L. Gluteofemoral adipose tissue plays a major role in production of the lipokine palmitoleate in humans. Diabetes 2012; 61:1399-403; PMID:22492525; http://dx.doi.org/ 10.2337/db11-1810 [DOI] [PMC free article] [PubMed] [Google Scholar]
- [22].Fried SK, Bunkin DA, Greenberg AS. Omental and subcutaneous adipose tissues of obese subjects release interleukin-6: depot difference and regulation by glucocorticoid. J Clin Endocrinol Metab 1998; 83:847-50; PMID:9506738 [DOI] [PubMed] [Google Scholar]
- [23].Cancello R, Tordjman J, Poitou C, Guilhem G, Bouillot JL, Hugol D, Coussieu C, Basdevant A, Bar Hen A, Bedossa P, et al.. Increased infiltration of macrophages in omental adipose tissue is associated with marked hepatic lesions in morbid human obesity. Diabetes 2006; 55:1554-61; PMID:16731817; http://dx.doi.org/ 10.2337/db06-0133 [DOI] [PubMed] [Google Scholar]
- [24].Vohl MC, Sladek R, Robitaille J, Gurd S, Marceau P, Richard D, Hudson TJ, Tchernof A. A survey of genes differentially expressed in subcutaneous and visceral adipose tissue in men. Obes Res 2004; 12:1217-22; PMID:15340102; http://dx.doi.org/ 10.1038/oby.2004.153 [DOI] [PubMed] [Google Scholar]
- [25].Gesta S, Bluher M, Yamamoto Y, Norris AW, Berndt J, Kralisch S, Boucher J, Lewis C, Kahn CR. Evidence for a role of developmental genes in the origin of obesity and body fat distribution. Proc Natl Acad Sci U S A 2006; 103:6676-81; PMID:16617105; http://dx.doi.org/ 10.1073/pnas.0601752103 [DOI] [PMC free article] [PubMed] [Google Scholar]
- [26].Karastergiou K, Fried SK, Xie H, Lee MJ, Divoux A, Rosencrantz MA, Chang RJ, Smith SR. Distinct developmental signatures of human abdominal and gluteal subcutaneous adipose tissue depots. J Clin Endocrinol Metab 2013; 98:362-71; PMID:23150689; http://dx.doi.org/ 10.1210/jc.2012-2953 [DOI] [PMC free article] [PubMed] [Google Scholar]
- [27].Pinnick KE, Nicholson G, Manolopoulos KN, McQuaid SE, Valet P, Frayn KN, Denton N, Min JL, Zondervan KT, Fleckner J, et al.. Distinct developmental profile of lower-body adipose tissue defines resistance against obesity-associated metabolic complications. Diabetes 2014; 63:3785-97; PMID:24947352; http://dx.doi.org/ 10.2337/db14-0385 [DOI] [PubMed] [Google Scholar]
- [28].Hilton C, Karpe F, Pinnick KE. Role of developmental transcription factors in white, brown and beige adipose tissues. Biochim Biophys Acta 2015; 1851:686-96 [DOI] [PubMed] [Google Scholar]
- [29].Tchkonia T, Lenburg M, Thomou T, Giorgadze N, Frampton G, Pirtskhalava T, Cartwright A, Cartwright M, Flanagan J, Karagiannides I, et al.. Identification of depot-specific human fat cell progenitors through distinct expression profiles and developmental gene patterns. Am J Physiol Endocrinol Metab 2007; 292:E298-307; PMID:16985259; http://dx.doi.org/ 10.1152/ajpendo.00202.2006 [DOI] [PubMed] [Google Scholar]
- [30].van Harmelen V, Dicker A, Ryden M, Hauner H, Lonnqvist F, Naslund E, Arner P. Increased lipolysis and decreased leptin production by human omental as compared with subcutaneous preadipocytes. Diabetes 2002; 51:2029-36; PMID:12086930; http://dx.doi.org/ 10.2337/diabetes.51.7.2029 [DOI] [PubMed] [Google Scholar]
- [31].Caserta F, Tchkonia T, Civelek VN, Prentki M, Brown NF, McGarry JD, Forse RA, Corkey BE, Hamilton JA, Kirkland JL. Fat depot origin affects fatty acid handling in cultured rat and human preadipocytes. Am J Physiol Endocrinol Metab 2001; 280:E238-47; PMID:11158926 [DOI] [PubMed] [Google Scholar]
- [32].Hocking SL, Wu LE, Guilhaus M, Chisholm DJ, James DE. Intrinsic depot-specific differences in the secretome of adipose tissue, preadipocytes, and adipose tissue-derived microvascular endothelial cells. Diabetes 2010; 59:3008-16; PMID:20841607; http://dx.doi.org/ 10.2337/db10-0483 [DOI] [PMC free article] [PubMed] [Google Scholar]
- [33].Tchkonia T, Tchoukalova YD, Giorgadze N, Pirtskhalava T, Karagiannides I, Forse RA, Koo A, Stevenson M, Chinnappan D, Cartwright A, et al.. Abundance of two human preadipocyte subtypes with distinct capacities for replication, adipogenesis, and apoptosis varies among fat depots. Am J Physiol Endocrinol Metab 2005; 288:E267-77; PMID:15383371; http://dx.doi.org/ 10.1152/ajpendo.00265.2004 [DOI] [PubMed] [Google Scholar]
- [34].Tchkonia T, Thomou T, Zhu Y, Karagiannides I, Pothoulakis C, Jensen MD, Kirkland JL. Mechanisms and metabolic implications of regional differences among fat depots. Cell Metab 2013; 17:644-56; PMID:23583168; http://dx.doi.org/ 10.1016/j.cmet.2013.03.008 [DOI] [PMC free article] [PubMed] [Google Scholar]
- [35].Darimont C, Zbinden I, Avanti O, Leone-Vautravers P, Giusti V, Burckhardt P, Pfeifer AM, Mace K. Reconstitution of telomerase activity combined with HPV-E7 expression allow human preadipocytes to preserve their differentiation capacity after immortalization. Cell Death Differ 2003; 10:1025-31; PMID:12934077; http://dx.doi.org/ 10.1038/sj.cdd.4401273 [DOI] [PubMed] [Google Scholar]
- [36].Fischer-Posovszky P, Newell FS, Wabitsch M, Tornqvist HE. Human SGBS Cells - a Unique Tool for Studies of Human Fat Cell Biology. Obesity Facts 2008; 1:184-9; PMID:20054179; http://dx.doi.org/ 10.1159/000145784 [DOI] [PMC free article] [PubMed] [Google Scholar]
- [37].Armani A, Mammi C, Marzolla V, Calanchini M, Antelmi A, Rosano GMC, Fabbri A, Caprio M. Cellular Models for Understanding Adipogenesis, Adipose Dysfunction, and Obesity. J Cell Biochem 2010; 110:564-72; PMID:20512917; http://dx.doi.org/ 10.1002/jcb.22598 [DOI] [PubMed] [Google Scholar]
- [38].Collins JM, Neville MJ, Pinnick KE, Hodson L, Ruyter B, van Dijk TH, Reijngoud DJ, Fielding MD, Frayn KN. De novo lipogenesis in the differentiating human adipocyte can provide all fatty acids necessary for maturation. J Lipid Res 2011; 52:1683-92; PMID:21677304; http://dx.doi.org/ 10.1194/jlr.M012195 [DOI] [PMC free article] [PubMed] [Google Scholar]
- [39].Pinnick KE, Nicholson G, Manolopoulos KN, McQuaid SE, Valet P, Frayn KN, Denton N, Min JL, Zondervan KT, Fleckner J, et al.. Distinct developmental profile of lower-body adipose tissue defines resistance against obesity-associated metabolic complications. Diabetes 2014; 63(11):3785-97; PMID:24947352 [DOI] [PubMed] [Google Scholar]
- [40].Zwerschke W, Mazurek S, Massimi P, Banks L, Eigenbrodt E, Jansen-Durr P. Modulation of type M2 pyruvate kinase activity by the human papillomavirus type 16 E7 oncoprotein. Proc Natl Acad Sci U S A 1999; 96:1291-6; PMID:9990017; http://dx.doi.org/ 10.1073/pnas.96.4.1291 [DOI] [PMC free article] [PubMed] [Google Scholar]
- [41].Collins JM, Neville MJ, Hoppa MB, Frayn KN. De novo lipogenesis and stearoyl-CoA desaturase are coordinately regulated in the human adipocyte and protect against palmitate-induced cell injury. J Biol Chem 2010; 285:6044-52; PMID:20032470; http://dx.doi.org/ 10.1074/jbc.M109.053280 [DOI] [PMC free article] [PubMed] [Google Scholar]
- [42].Malcom GT, Bhattacharyya AK, Velez-Duran M, Guzman MA, Oalmann MC, Strong JP. Fatty acid composition of adipose tissue in humans: differences between subcutaneous sites. Am J Clin Nutr 1989; 50:288-91; PMID:2756915 [DOI] [PubMed] [Google Scholar]
- [43].Cao H, Gerhold K, Mayers JR, Wiest MM, Watkins SM, Hotamisligil GS. Identification of a lipokine, a lipid hormone linking adipose tissue to systemic metabolism. Cell 2008; 134:933-44; PMID:18805087; http://dx.doi.org/ 10.1016/j.cell.2008.07.048 [DOI] [PMC free article] [PubMed] [Google Scholar]
- [44].Dimopoulos N, Watson M, Sakamoto K, Hundal HS. Differential effects of palmitate and palmitoleate on insulin action and glucose utilization in rat L6 skeletal muscle cells. Biochem J 2006; 399:473-81; PMID:16822230; http://dx.doi.org/ 10.1042/BJ20060244 [DOI] [PMC free article] [PubMed] [Google Scholar]
- [45].Hodson L, Karpe F. Is there something special about palmitoleate? Curr Opin Clin Nutr Metab Care 2013; 16:225-31; PMID:23324899; http://dx.doi.org/ 10.1097/MCO.0b013e32835d2edf [DOI] [PubMed] [Google Scholar]
- [46].Lee KY, Yamamoto Y, Boucher J, Winnay JN, Gesta S, Cobb J, Bluher M, Kahn CR. Shox2 is a molecular determinant of depot-specific adipocyte function. Proc Natl Acad Sci U S A 2013; 110:11409-14; PMID:23798383; http://dx.doi.org/ 10.1073/pnas.1310331110 [DOI] [PMC free article] [PubMed] [Google Scholar]
- [47].Dankel SN, Fadnes DJ, Stavrum AK, Stansberg C, Holdhus R, Hoang T, Veum VL, Christensen BJ, Vage V, Sagen JV, et al.. Switch from stress response to homeobox transcription factors in adipose tissue after profound fat loss. PloS One 2010; 5:e11033; PMID:20543949; http://dx.doi.org/ 10.1371/journal.pone.0011033 [DOI] [PMC free article] [PubMed] [Google Scholar]
- [48].Loh NY, Neville MJ, Marinou K, Hardcastle SA, Fielding BA, Duncan EL, McCarthy MI, Tobias JH, Gregson CL, Karpe F, et al.. LRP5 regulates human body fat distribution by modulating adipose progenitor biology in a dose- and depot-specific fashion. Cell Metab 2015; 21:262-72; PMID:25651180; http://dx.doi.org/ 10.1016/j.cmet.2015.01.009 [DOI] [PMC free article] [PubMed] [Google Scholar]
- [49].Jensen MD, Cryer PE, Johnson CM, Murray MJ. Effects of epinephrine on regional free fatty acid and energy metabolism in men and women. Am J Physiol 1996; 270:E259-64; PMID:8779947 [DOI] [PubMed] [Google Scholar]
- [50].Wahrenberg H, Lonnqvist F, Arner P. Mechanisms underlying regional differences in lipolysis in human adipose tissue. J Clin Invest 1989; 84:458-67; PMID:2503539; http://dx.doi.org/ 10.1172/JCI114187 [DOI] [PMC free article] [PubMed] [Google Scholar]
- [51].Lafontan M, Dang-Tran L, Berlan M. Alpha-adrenergic antilipolytic effect of adrenaline in human fat cells of the thigh: comparison with adrenaline responsiveness of different fat deposits. Eur J Clin Invest 1979; 9:261-6;PMID:230058; http://dx.doi.org/ 10.1111/j.1365-2362.1979.tb00883.x [DOI] [PubMed] [Google Scholar]
- [52].Rosenbaum M, Presta E, Hirsch J, Leibel RL. Regional differences in adrenoreceptor status of adipose tissue in adults and prepubertal children. J Clin Endocrinol Metab 1991; 73:341-7; PMID:1649839; http://dx.doi.org/ 10.1210/jcem-73-2-341 [DOI] [PubMed] [Google Scholar]
- [53].Arner P, Hellstrom L, Wahrenberg H, Bronnegard M. Beta-adrenoceptor expression in human fat cells from different regions. J Clin Invest 1990; 86:1595-600; PMID:2173724; http://dx.doi.org/ 10.1172/JCI114880 [DOI] [PMC free article] [PubMed] [Google Scholar]
- [54].van de Venter M, Litthauer D, Oelofsen W. Catecholamine stimulated lipolysis in differentiated human preadipocytes in a serum-free, defined medium. J Cell Biochem 1994; 54:1-10; PMID:8126079; http://dx.doi.org/ 10.1002/jcb.240540102 [DOI] [PubMed] [Google Scholar]
- [55].Hauner H, Skurk T, Wabitsch M. Cultures of human adipose precursor cells. Methods Mol Biol 2001; 155:239-47; PMID:11293076 [DOI] [PubMed] [Google Scholar]
- [56].Pfaffl MW. A new mathematical model for relative quantification in real-time RT-PCR. Nucleic Acids Res 2001; 29:e45; PMID:11328886; http://dx.doi.org/ 10.1093/nar/29.9.e45 [DOI] [PMC free article] [PubMed] [Google Scholar]
- [57].Neville MJ, Collins JM, Gloyn AL, McCarthy MI, Karpe F. Comprehensive human adipose tissue mRNA and microRNA endogenous control selection for quantitative real-time-PCR normalization. Obesity (Silver Spring) 2011; 19:888-92; PMID:20948521; http://dx.doi.org/ 10.1038/oby.2010.257 [DOI] [PMC free article] [PubMed] [Google Scholar]
- [58].Folch J, Lees M, Sloane Stanley GH. A simple method for the isolation and purification of total lipides from animal tissues. J Biol Chem 1957; 226:497-509; PMID:13428781 [PubMed] [Google Scholar]
- [59].Bickerton AS, Roberts R, Fielding BA, Hodson L, Blaak EE, Wagenmakers AJ, Gilbert M, Karpe F, Frayn KN. Preferential uptake of dietary Fatty acids in adipose tissue and muscle in the postprandial period. Diabetes 2007; 56:168-76; PMID:17192479; http://dx.doi.org/ 10.2337/db06-0822 [DOI] [PubMed] [Google Scholar]
- [60].Tayek JA, Katz J. Glucose production, recycling, and gluconeogenesis in normals and diabetics: a mass isotopomer [U-13C]glucose study. Am J Physiol 1996; 270:E709-17; PMID:8928779 [DOI] [PubMed] [Google Scholar]
Associated Data
This section collects any data citations, data availability statements, or supplementary materials included in this article.