
Figure 1.
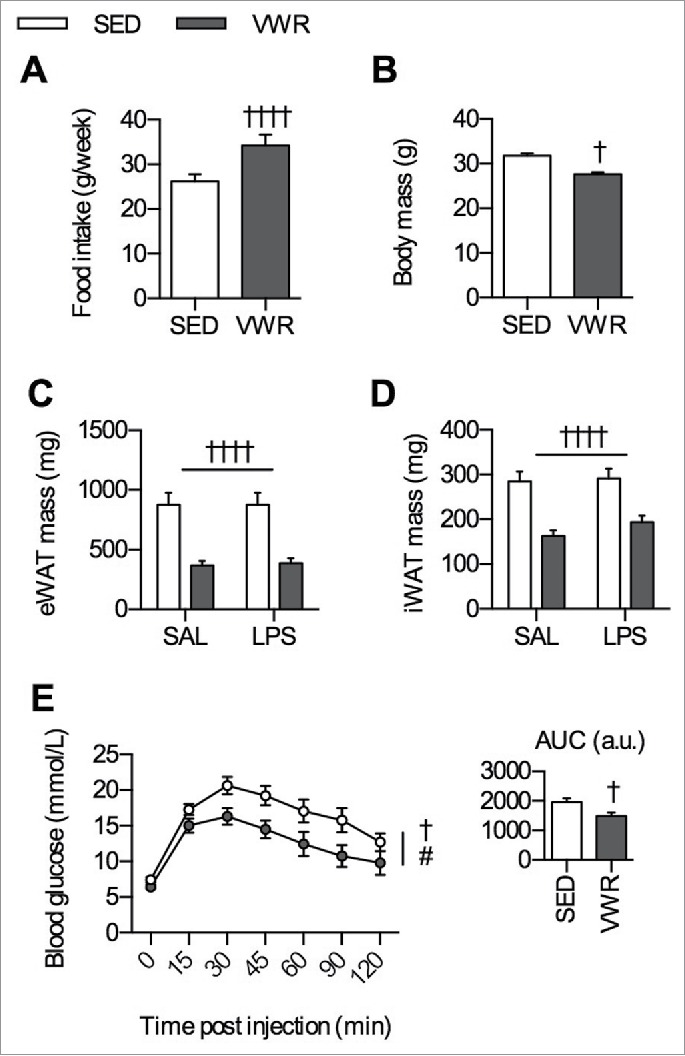
Effects of 10 weeks of VWR. A) Average food intake (g/week) and B) final body mass (g) (n = 20/group). C) eWAT mass (mg), D) iWAT mass (mg), and D) glucose tolerance test curve with inset indicating the area under the curve (n = 10/group). All data are presented as mean ± sem. Significance is displayed as †p < 0.05 and ††††p < 0.0001 for an effect of VWR and #p < 0.05 for an effect of time. Where a 2-way ANOVA was used a flat bar indicates a main effect.