Abstract
Three-dimensional physical interactions within chromosomes dynamically regulate gene expression in a tissue-specific manner1–3. However, the 3D organization of chromosomes during human brain development and its role in regulating gene networks dysregulated in neurodevelopmental disorders, such as autism or schizophrenia4–6, are unknown. Here we generate high-resolution 3D maps of chromatin contacts during human corticogenesis, permitting large-scale annotation of previously uncharacterized regulatory relationships relevant to the evolution of human cognition and disease. Our analyses identify hundreds of genes that physically interact with enhancers gained on the human, many of which are under purifying selection and associated with human cognitive function. We integrate chromatin contacts with non-coding variants identified in schizophrenia genome-wide association studies (GWAS), highlighting multiple new candidate schizophrenia risk genes and pathways, including transcription factors involved in neurogenesis, as well as cholinergic signalling, several of which are supported by independent expression quantitative trait loci and gene expression analyses. Genome editing in human neural progenitors suggests that one of these distal schizophrenia GWAS loci regulates FOXG1 expression, supporting its potential role as a novel schizophrenia risk gene. This work provides a framework for understanding the impact of non-coding regulatory elements on human brain development and the evolution of cognition, and highlights novel mechanisms underlying neuropsychiatric disorders.
Recent advances in genomics have shown that chromatin is organized into hierarchical 3D structures2,3, which are thought to play a role in tissue-specific gene regulation by defining functional units that mediate the effects of cis-regulatory elements via both short- and long-range interactions. Since crucial elements of human brain evolution and a wide spectrum of neuropsychiatric disorders originate during early cortical development7,8, we reason that knowledge of chromatin conformation in the developing human brain would inform efforts to connect gene regulation to human higher cognition and understand the genetic mechanisms of neuropsychiatric disease.
We constructed Hi-C libraries from mid-gestation developing human cerebral cortex during the peak of neurogenesis and migration (Methods) from two major zones: the cortical and subcortical plate (CP), consisting primarily of post-mitotic neurons and the germinal zone (GZ), containing primarily mitotically active neural progenitors (Extended Data Fig. 1, 2a). The global contact profile was highly consistent across technical replicates and between individuals (Extended Data Fig. 1c, 2b). Moreover, this profile captured known relationships with other genomic features9, such as DNaseI hypersensitivity (DHS) (Extended Data Fig. 2c, d). We were also able to observe dynamic switching between type A and type B compartments, which have previously been associated with regional transcriptional activation and repression, respectively1. Compartment changes between GZ and CP also paralleled changes in DHS and other epigenetic marks and reflected expected changes in genes relevant to neurodevelopmental processes (Extended Data Fig. 3a–d).
We next performed several analyses to explore how physical chromatin interactions are related to biological function. First, we hypothesized that highly interacting chromatin regions would be co-regulated at the level of gene expression (Methods). Indeed, highly interacting regions show significant bias towards positive correlations (Extended Data Fig. 4a, b). Further, regions associated with promoters, positive transcriptional regulation, and enhancers were statistically more likely to physically interact (Extended Data Fig. 4d, e). This correlation was tissue specific, as the top Hi-C interacting regions in non-neural cells exhibited substantially less correlation with brain gene expression compared with Hi-C interacting regions in developing brain (Extended Data Fig. 4c).
Topologically associating domains (TADs) are another level of 3D chromosome structure thought to mediate co-transcriptional regulation within their boundaries10. Since TAD boundaries are conserved across different cell types10, we reasoned that changes in epigenetic marks within TADs, rather than changes in TAD boundaries, would be most associated with developmental gene regulation. Accordingly, enhancers are increased in TADs that contain upregulated genes, whereas repressive marks are increased in TADs that contain downregulated genes (Extended Data Fig. 3e, Methods).
Within TADs, it has been postulated that chromatin loops bring distal regulatory elements in close proximity to the target promoter2,11,12. We conducted analyses with three distinct data sets to affirm the ability of chromatin contacts defined by Hi-C to capture predicted functional relationships between distal regulatory and transcribed elements. We first assessed DHS, which represents areas of accessible chromatin associated with transcriptional activity13. Hi-C interacting enhancers and promoters exhibit significantly higher correlations in chromatin accessibility than those lacking physical interactions (Fig. 1a). Physical chromatin contacts have also been implicated in mediating expression quantitative trait loci (eQTL)14,15, so we determined whether Hi-C data could identify functional relationships defined by human brain eQTL16. Indeed, eQTL and associated gene pairs exhibit significantly higher chromatin contact frequency than background across all distance ranges, and in a tissue-specific manner (Fig. 1b, c, Extended Data Fig. 3f, g, Methods). Notably, both the Hi-C and eQTL data consistently show that the region containing the regulatory SNP does not necessarily interact with the nearest gene (Methods). Lastly, since enhancer RNAs (eRNAs) are transcribed from active enhancers and are correlated with their target mRNA expression17, we considered whether Hi-C defined chromatin interactions and eRNA–mRNA co-expression in developing human brain from the FANTOM5 atlas18 were correlated (Methods). Accordingly, we observed significantly higher expression correlations for interacting eRNA–mRNA pairs than non-interacting pairs (Fig. 1d), demonstrating that the relationship between eRNA–mRNA is associated with physical contact between enhancers and promoters.
Figure 1. Chromosome conformation and gene regulatory mechanisms.
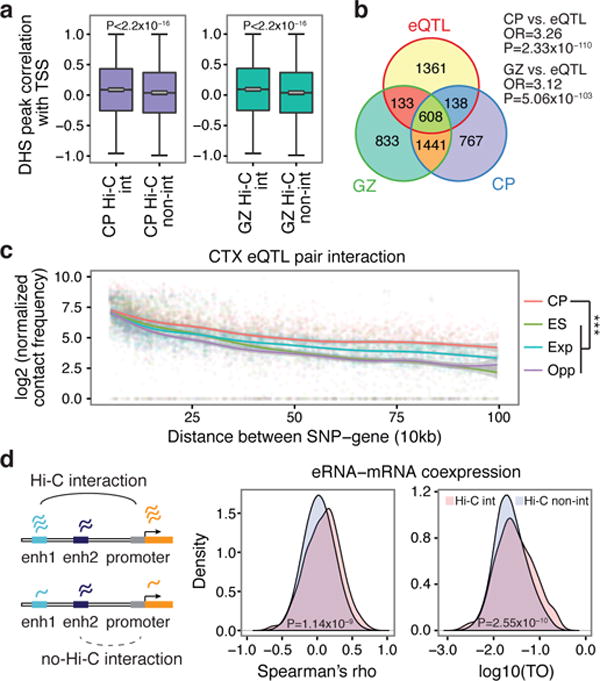
a, DHS peak correlations with the transcription start site (TSS) for putative enhancers that physically interact with promoters by Hi-C (Hi-C int.) vs not (Hi-C non-int.). P values calculated by t-test from correlation values converted to Z scores; whiskers, 1.5 × interquartile range; centre lines, median (black) and mean (grey). b, Overlap between eQTL transcripts and genes physically interacting with eQTL in CP and GZ (Fisher’s test). OR, odds ratio. c, Hi-C interaction frequency between eQTL and associated transcripts. Chromatin contact frequency in CP and ES; Exp., expected interaction frequency; Opp., (opposite) interaction frequency of SNPs and transcripts when the position of genes was mirrored relative to the eQTL. ***P < 0.001, repeated measures ANOVA. LOESS curves and confidence intervals (95%, shaded area) are depicted. d, Hi-C interacting enhancer–gene pairs show increased expression correlation (Spearman, middle) as well as co-expression (TO, topological overlap, right) compared with non-interacting pairs (Wilcoxon signed-rank test).
To further demonstrate the value of these 3D chromatin contact maps, we applied these data to advance our understanding of human brain evolution. We first integrated a recent inventory of 2,104 human-gained enhancers active during cerebral corticogenesis8 with our Hi-C data (Extended Data Fig. 5a, Methods). As expected, regions that physically interact with human-gained enhancers were enriched with enhancers and promoters (Extended Data Fig. 5c); most interactions were within the same TAD (Extended Data Fig. 5d), although the majority of such contacts were relatively long-range (Extended Data Fig. 5b). Most enhancers (~65%) were not interacting with adjacent genes (Fig. 2a) and a substantial number (~40%) of genes interact with human-gained enhancers (Hi-Cevol genes) in a brain-specific manner, emphasizing the importance of defining tissue-relevant chromatin contacts (Fig. 2b). These brain-specific Hi-Cevol genes were highly enriched for neuronal specific functions such as axon guidance and synaptic transmission, whereas genes defined by Hi-C interactions in non-neuronal cells were not (Extended Data Fig. 5e, 6a, b). A notable case is a human-gained enhancer that interacts with a gene ~500 kb away in CP, ARHGAP11B, a recently discovered human-specific gene implicated in the expansion of human neocortex19 (Fig. 2e).
Figure 2. Regulatory architecture of human-gained enhancers.
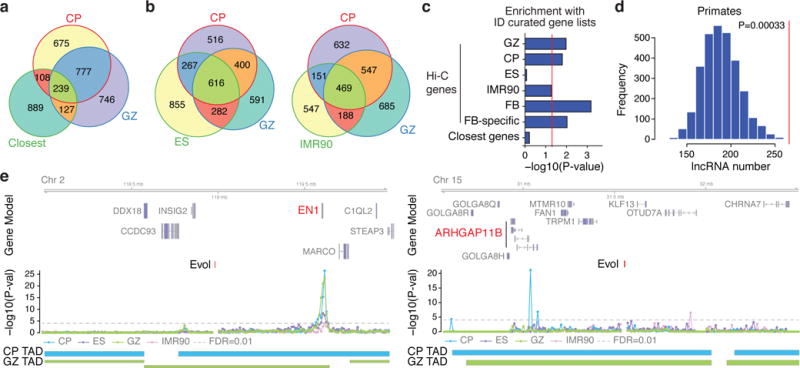
a, b, Overlap between Hi-Cevol genes in CP and GZ with the closest genes (a) and Hi-Cevol genes in ES (left) and IMR90 (right, b) cells. c, Overrepresentation of Hi-Cevol genes in different tissues and closest genes with ID risk genes. GPCR, G-protein coupled receptor; Hi-C genes: GZ, CP, ES, IMR90, Hi-Cevol genes in each cell type; FB (fetal brain), union of Hi-Cevol genes in GZ and CP; FB-specific, Hi-Cevol genes in FB only; Closest genes, closest genes to human-gained enhancers. d, Number of primate-specific lncRNAs interacting with human-gained enhancers in CP (a red vertical line in the graph) against permuted background. e, Representative interaction map of a 10 kb bin, in which human-gained enhancers reside, with the corresponding flanking regions. Chromosome ideogram and genomic axis on the top, possible target genes marked in red; genomic coordinates for human-gained enhancers are labelled as Evol; –log10[P value], significance of the interaction between human-gained enhancers and each 10 kb bin; grey dotted line marks FDR = 0.01; TAD borders in CP and GZ below.
To determine whether human-gained enhancers are associated with human cognition8, we tested whether Hi-Cevol genes were enriched in known intellectual disability (ID) risk genes. Indeed, we find that Hi-Cevol genes, but not genes defined solely by proximity to enhancers, nor those defined by Hi-C interactions in non-neural cells, were significantly enriched with ID risk genes (Fig. 2c; Methods). Salient examples include ASPM, mutations in which cause autosomal recessive primary microcephaly20. Additionally, we find that human-gained enhancers as a group are interacting with protein-coding genes harbouring the signature of purifying selection (Extended Data Fig. 6c), consistent with the model that human-specific traits result primarily from changes in regulatory elements, rather than changes in protein coding sequence7,8. By contrast, lineage-specific interactions with human-gained enhancers are enriched for primate-specific long non-coding RNAs (lncRNAs; Fig. 2d, Extended Data Fig. 6d), consistent with their adaptive evolution21. This distinction between signatures of selection on protein coding genes versus lncRNA is consistent with putative gene regulatory roles for these human-gained enhancer-interacting lncRNAs.
Next, we applied the developing brain Hi-C maps to advance our understanding of a major neuropsychiatric disorder (Methods; Extended Data Fig. 7). A recent landmark study by the Psychiatric Genetics Consortium (PGC) identified 108 genome-wide significant schizophrenia-associated loci22. Since nearly all of these loci reside in relatively uncharacterized non-coding regions of the genome22, understanding which genes they affect and assigning function are major challenges. Since schizophrenia is postulated to have neurodevelopmental origins23, we derived a set of significant schizophrenia SNPs from the PGC GWAS (credible SNPs)24, and assigned intergenic or intronic SNPs to interacting genes defined by Hi-C (Methods; Extended Data Fig. 7a). Consistent with observations that linear chromosomal organization does not capture many regulatory interactions11, Hi-C identified ~500 genes that were neither adjacent to index SNPs, nor in linkage disequilibrium (LD) with them (Fig. 3a, b, Extended Data Fig. 8a–d). These candidate schizophrenia risk genes were enriched for postsynaptic density, acetylcholine receptors, neuronal differentiation, and chromatin remodellers, functions consistent with the convergence of schizophrenia-associated risk variants onto specific pathways in brain development and function23,25,26 (Fig. 3c, d). Using PGC-defined credible SNPs22 identified the same major pathways (Extended Data Fig. 7b). A substantial number of genes (~30%) interact with schizophrenia credible SNPs only in developing brain, and not in the non-neuronal cells, indicative of tissue specificity (Extended Data Fig. 9a–c).
Figure 3. Annotation of schizophrenia-associated loci.
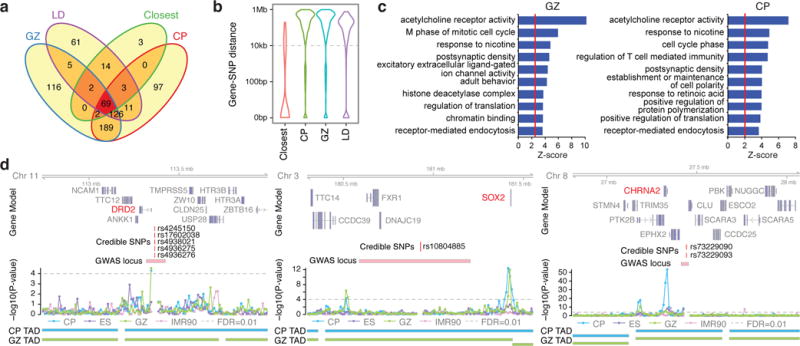
a, Overlap between closest genes and genes in LD with index SNPs, and schizophrenia risk genes in CP and GZ. b, Distance between credible/index SNPs and their target genes for closest, LD, and schizophrenia risk genes in CP and GZ. c, GO enrichment for schizophrenia risk genes in CP (left) and GZ (right). d, Representative interaction map of a 10 kb bin, in which credible SNPs reside, to the corresponding flanking regions. Credible SNPs, genomic coordinates for credible SNPs that interact to the target gene; GWAS locus, LD region for the index SNP.
One notable example is illustrated by credible SNPs that reside 20 kb upstream of DRD2, a target of antipsychotic drugs. Hi-C analysis indicates a physical interaction between this region and the promoter of DRD2, further solidifying its role as a schizophrenia risk gene (Fig. 3d). Credible schizophrenia SNPs also interact with several acetylcholine receptors, including CHRM2, CHRM4, CHRNA2, CHRNA3, CHRNA5, and CHRNB4 (Fig. 3c, d, Extended Data Fig. 8e). Although acetylcholine receptors are emerging targets for treatment in schizophrenia27, they were not previously identified as an enriched pathway contributing to schizophrenia risk22 (Fig. 3c, d).
Another example of a candidate risk gene that is neither the nearest gene, nor in LD with the credible SNPs is SOX2, a transcriptional factor essential for neurogenesis28 (Fig. 3d). Notably, SOX2 is one of several candidate risk genes including FOXG1, EMX1, TBR1, SATB2, CUX2, and FOXP1 that are involved in neurogenesis or cortical lamination and interact with schizophrenia risk loci (Extended Data Fig. 8e). Loci harbouring schizophrenia-associated non-coding SNPs also interact with multiple genes involved in excitatory synaptic transmission, including GRIA1, NLGN4X and GRIN2A, supporting the more established role of glutamatergic transmission defects in schizophrenia pathophysiology25. Notably, we recapitulated the previously identified interaction between CACNA1C and a schizophrenia-associated SNP associated with decreased enhancer activity29.
We next integrated gene expression from the Common Mind Consortium with Hi-C data (Methods), observing a significant overlap of these schizophrenia candidate risk genes with those downregulated in dorsolateral prefrontal cortex (DLPFC) from schizophrenia patients (Fig. 4a). This enrichment was not observed in either embryonic stem (ES) cell or IMR90 cell Hi-C maps, nor in genes in with, nor nearest to, the index SNPs. We identified 12 genes that were dysregulated in schizophrenia brain in the same direction as predicted by eQTL signals, validating the Hi-C predictions, further supporting these eQTL as candidate schizophrenia risk loci (Fig. 4b, Extended Data Fig. 10, Supplementary Table).
Figure 4. Functional validation of schizophrenia risk genes predicted by Hi-C.
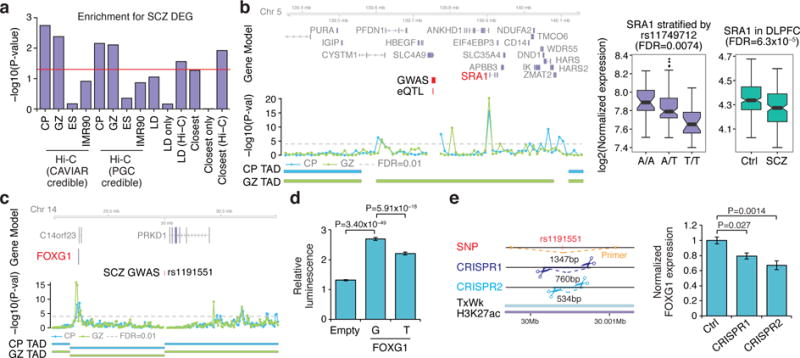
a, Over-representation of schizophrenia risk genes with downregulated genes in schizophrenia DLPFC. Hi-C: CP, GZ, ES, IMR90, genes that are associated with CAVIAR credible SNPs or originally identified credible SNPs (PGC credible) in each tissue/cell type; LD, genes that are in LD with index SNPs, that are identified (LD, Hi-C) and not (LD only) by Hi-C; closest, closest genes to index SNPs, that are identified (closest, Hi-C) and not (closest only) by Hi-C. b, Hi-C interactions and eQTL association identify the same gene (left, marked in red), which is dysregulated in the same direction in schizophrenia DLPFC (right). Coordinates for the 10 kb bin containing credible SNPs (schizophrenia GWAS) and eQTL are indicated. Whiskers, 1.5 × interquartile range; centre lines, median. c, Interaction map of SNP rs1191551 indicates an interaction with FOXG1. d, rs1191551 risk allele (T) decreases luciferase activity (mean ± standard error, n = 32). P values, linear mixed effect model. e, Predicted cleavage sites for two guide RNA pairs (CRISPR1 and CRISPR2); location of primers used to validate deletion are indicated. Rs1191551 is located in a weakly transcribed region (TxWk) containing a predicted active enhancer (H3K27ac) in fetal brain (left). CRISPR/Cas9-mediated deletion of rs1191551 flanking region reduces the expression of FOXG1 (right). Normalized expression levels of FOXG1 relative to control (Ctrl) (mean ± standard error, n = 6 (Ctrl), 4 (CRISPR1 and CRISPR2)). P values, one-way ANOVA and post hoc Tukey test.
To provide experimental support for a functional prediction based on Hi-C, we tested the credible schizophrenia-associated SNP rs1191551 that physically interacts with FOXG1, a gene associated with telencephalic development and ID30, and that is 760 kb away from the schizophrenia-associated region (Fig. 4c). We used a reporter assay to demonstrate the effect of the schizophrenia risk variant on FOXG1 expression, and CRISPR/Cas9-mediated genome editing to corroborate that the region containing the SNP regulates FOXG1 expression, but not the nearby PRKD1 locus (Fig. 4d, e, Extended Data Fig. 9d–f). These data support regulation of FOXG1 by the region containing rs1191551 during human cortical development.
In conclusion, we demonstrate how analysis of genome-wide chromatin contacts provides important biological insights into gene regulatory mechanisms during human corticogenesis. We annotate non-coding regulatory elements based on their long-range chromatin contacts to identify hundreds of novel enhancer–promoter interactions during human brain development, relationships that are likely to be relevant to the evolution of human cognition. We also show how tissue-relevant chromatin contacts can be used to inform the biological interpretation of risk variants for a complex genetic disorder, schizophrenia, and in the process, identify several novel candidate genes and pathways that warrant detailed further study. These comparisons illustrate the added power of 3D genome annotation and provide a template for understanding the role of non-coding variation across complex genetic disorders that may involve tissue-specific gene regulation.
METHODS
Fetal brain layer dissection
Human fetal cortical tissues were obtained from the UCLA Gene and Cell Therapy Core according to IRB guidelines, and frontoparietal cortex was collected from three individuals at gestation week (GW) 17–18 (one sample from GW17 and two samples from GW18). In cold DMEM/F-12 (ThermoFisher, 11320-033), frontoparietal cortex was first dissected to thin (~1 mm) slices to visualize layers. Under the light-field microscope, cortical slice was dissected to germinal zone (GZ) and cortical plates (CP). GZ contains ventricular zone and subventricular zone, and hence is comprised of proliferating neurons. CP refers to intermediate zone, cortical plate, and marginal zone, which are mainly composed of differentiated and migrating neurons. By dissecting layers from same fetal cortices, we can compare progenitors to differentiated neurons with the same genotype and minimize inter-sample heterogeneity.
Hi-C
Collected tissue was dissociated with trypsin and cell number was counted. Ten million cells were fixed in 1% formaldehyde for 10 min. Cross-linked DNA was digested by restriction enzyme HindIII (NEB, R0104). Digested chromatin ends were filled and marked with biotin-14-dCTP (ThermoFisher, 19518-018). Resulting blunt-end fragments were ligated under dilute concentration to minimize random intermolecular ligations. DNA purified after crosslinking was reversed by proteinase K (NEB, P8107) treatment. Biotin from unligated ends was removed by exonuclease activity of T4 DNA polymerase (ThermoFisher, 18005). DNA was sheared by sonication (Covaris, M220) and 300–600-bp fragments were selected. Biotin-tagged DNA, which is an intermolecular ligation product, was pulled down with streptavidin beads (Invitrogen, 65001), and ligated with Illumina paired-end adapters. The resulting Hi-C library was amplified by PCR (KAPA Biosystems HiFi HotStart PCR kit, KK2502) with the minimum number of cycles (typically 12–13 cycles), and sequenced by Illumina 50 bp paired-end sequencing. For comparison with non-neuronal cell types, we also used publicly available Hi-C data on human ES cells and IMR90 cells10,31.
Hi-C reads mapping and pre-processing
Mapping and filtering of the reads, as well as normalization of experimental and intrinsic biases of Hi-C contact matrices were conducted with the following method regardless of cell type to minimize potential variance in the data obtained from different platforms. We implemented hiclib (https://bitbucket.org/mirnylab/hiclib) to perform initial analysis on Hi-C data from mapping to filtering and bias correction. Briefly, quality analysis was performed using a phred score, and sequenced reads were mapped to hg19 human genome by Bowtie2 (with increased stringency, –score-min -L 0.6,0.2–very-sensitive) through iterative mapping. Read pairs were then allocated to HindIII restriction enzyme fragments. Self-ligated and unligated fragments, fragments from repeated regions of the genome, PCR artefacts, and genome assembly errors were removed. Filtered reads were binned at 10 kb, 40 kb, and 100 kb resolution to build a genome-wide contact matrix at a given bin size. Biases can be introduced to contact matrices by experimental procedures and intrinsic properties of the genome. To decompose biases from the contact matrix and yield a true contact probability map, filtered bins were subjected to iterative correction9, the basic assumption of which is that each locus has uniform coverage. Bias correction and normalization results in a corrected heat map of bin-level resolution. 100-kb resolution bins were assessed for inter-chromosomal interactions, 40 kb for TAD analysis, and 10 kb for gene loop detection.
When three replicates for each cortical tissue was processed individually, we found high correlation in chromosome conformation from different individuals from global chromatin contact profile, providing evidence for robustness of the result (Extended Data Fig. 1c). To obtain maximum sequencing depth and resolution of the contact matrix, we used the combined (pooled) data set for the following analyses unless otherwise specified.
Inter-chromosomal principal component analysis
Principal component analysis (PCA) was conducted in a genome-wide inter-chromosome contact map (100-kb binned) as described previously9. Since intra-chromosome conformation may drive the PCA results, cis contacts were iteratively replaced to random trans counts using hiclib command fakeCis. After removing diagonal and poorly covered regions, we performed PCA using hiclib command doEig.
Pearson’s correlations between the first principal components (PC1) from different cell types (CP, GZ, ES, and IMR90) were calculated to compare similarities in inter-chromosomal interactions between different cell types.
Spearman’s correlations between PC1/PC2 and biological traits (GC content, gene density, DHS, gene expression) were calculated. GC content (%) for each 100 kb bin was calculated by gcContentCalc command from R package Repitools. Gene density (number of genes in 100 kb bin) was obtained based on longest isoforms from Gencode v.19. DHS identified in fetal brain from Roadmap Epigenomics32 and gene expression levels from prenatal cerebral cortical layers from Miller et al.33 were used and average values per 100 kb bin were calculated.
Gene enrichment analysis
Gene Ontology (GO) enrichment was performed by GO-Elite Pathway Analysis (EnsMart65, http://www.genmapp.org/go_elite/). All genes in the genome except the ones located in the chromosome Y and mitochondrial DNA were used as a background gene list. Because Hi-C interaction is measured in bins, sometimes we cannot dissect the individual genes when they are clustered in the genome (that is, PCDH locus). To prevent several gene clusters overriding entire GO terms, we removed GO mainly defined by gene clusters (for 100 kb or 40 kb binned data, for example, when more than half of the genes in a GO category reside in the same bin) or we randomly included one gene per cluster (for example, PCDHA1 for PCDHA1-13 cluster) before GO analysis (for 10 kb binned data).
Gene enrichment for the curated gene lists was performed using a binomial generalized linear model. The ID curated gene list from Pariskshak et al.4 and downregulated genes in schizophrenia DLPFC (see below) were used for the enrichment test. Protein-coding genes based on biomaRt (Gencode v.19) were used as the background gene list.
Identification of the regions with largest inter-chromosomal conformation changes
The chromosome contact matrix was normalized with the total interaction counts between two cell types for comparison. Intra-chromosomal interactions were masked from the genome-wide contact matrix, and top 1,000 bins with the largest interaction changes between different cell/tissue types (GZ vs CP or ES vs CP) were selected. As one bin is comprised of two loci that are interacting with each other, this would yield ~2,000 sites in the genome. Genes located in those ~2,000 sites were combined to perform GO analysis.
Co-expression of inter-chromosomal interacting regions
Using transcriptome from fetal cortical layers34, average expression values per 100 kb bin were calculated. The Pearson correlation matrix was calculated from 100 kb binned expression data from all layers to generate the gene co-expression matrix. At this step, the gene co-expression matrix has the same dimension as the inter-chromosomal contact matrix.
We hypothesized that genes would be co-expressed across the layers when they are interacting in all stages (both in CP and GZ), so we selected top 2% highest interacting regions from fetal brains considering both GZ and CP (high interacting regions). We also selected (1) low interacting regions: the top lowest interacting regions (0 interaction from normalized Hi-C contact matrix) from fetal brain (both GZ and CP), (2) variant interacting regions: top 2% highest interacting regions from one stage (for example, GZ) that are top 2% lowest interacting regions from the other stage (for example, CP) for comparison, and (3) top 2% highest interacting regions of ES and IMR90 cells. Expression correlation values of the same regions were selected from the gene co-expression matrix, and expression correlations between different states (high interacting regions vs low interacting regions and high interacting regions vs variant interacting regions) as well as different cell/tissue types (fetal brain vs ES/IMR90) were compared by Wilcoxon signed-rank test.
Epigenetic state enrichment for inter-chromosomal interacting regions
The fetal brain (E081) imputation-based 25 epigenetic state model from Roadmap Epigenomics32,35 was used to generate the epigenetic state combination matrix, which was generated by marking loci where two interacting chromosomal bins (defined as bins with (1) interaction counts >75% quantile interaction count for inter-chromosomal interactions and (2) interaction counts >0 for intra-chromosomal interactions) share an epigenetic signature. For example, the epigenetic combination matrix between the active transcription start site (TssA) and active enhancers (EnhA1) was generated by marking where interacting loci have TssA at one locus and EnhA1 at the other locus. Intra- and inter-chromosomal contact frequency maps were then compared to epigenetic state matrix by Fisher’s exact test to calculate enrichment of shared epigenetic combinations in interacting regions.
Compartment analysis
Expected interaction frequency was calculated from the normalized intra-chromosomal 40 kb binned contact matrix based on the distance between two bins. We summed series of sub-matrices consisting of a 400 kb window size with 40 kb step size from the normalized Hi-C maps to generate observed and expected matrices. The Pearson’s correlation matrix was computed from the observed/expected matrix, and PCA was conducted on the correlation matrix. PC1 from each chromosome was used to identify compartments. Eigenvalues positively correlated with the gene density were set as compartment A, while those negatively correlated were set as compartment B.
Gene expression and epigenetic state change across different compartments
Genomic regions were classified into three categories according to compartments: compartment A in cell type 1 that changes to compartment B in cell type 2 (A to B), compartment B in cell type 1 that changes to compartment A in cell type 2 (B to A), regions that do not change compartment between two cell types (stable).
Genes residing in each compartment category were selected and GO enrichment was performed. Gene expression fold-change (FC) between different cell types was calculated from Miller et al.33 (comparison for CP vs GZ) and CORTECON36 (comparison for ES vs CP and ES vs GZ). Distribution of gene expression FC for genes in different compartment categories was compared by one-way ANOVA and Tukey’s post hoc test.
The DHS FC32 between different cell/tissue types (ES vs CP and ES vs GZ) was calculated and statistically evaluated as in the gene expression comparison. We classified the 15 state chromatin model from Roadmap Epigenomics32 (ES, E003 and fetal brains, E081) based on compartment categories and averaged epigenetic states across 40-kb bins. Each epigenetic state counts32 for one compartment category was normalized by the total epigenetic state number of that compartment category and compared for significant differences between ES and fetal brains using Fisher’s exact test.
TAD analysis
We conducted TAD-level analysis as described previously10. In brief, we quantified the directionality index by calculating the degree of upstream or downstream (2 Mb) interaction bias of a given bin, which was processed by a hidden Markov model (HMM) to remove hidden directionality bias. Regions in between TADs are titled as TAD boundaries for regions smaller than 400 kb and unorganized chromatin for regions larger than 400 kb.
TAD-based epigenetic changes upon differentially expressed genes
Genes were subdivided into 20 groups based on expression FC between ES cells and most differentiated neural states in CORTECON36: genes that are upregulated and downregulated upon differentiation were grouped into ten quantiles, based on the FC. TADs in which genes from one subdivision reside were selected, and epigenetic state changes (from Roadmap Epigenomics, core 15 state epigenetic model in ES, E003 and fetal brains, E08132) in those TADs were normalized with TAD length and compared between ES and fetal brains. As different types of epigenetic states have different absolute genome coverage (for example, there are more quiescent states than enhancer states in the genome), each epigenetic state change was scaled across different quantiles to allow comparison between different states.
DHS peak correlation for Hi-C interacting regions
Fetal brain DNase-seq data sets from 14 individuals32 (GW12-21) were uniformly processed to identify chromatin accessibility peaks. Sequenced reads were mapped to hg19 human genome by Burrows-Wheeler aligner (bwa), and MACS2 was used to call peaks. Correlation between chromatin accessibility peaks was assessed by first identifying seed peak(s) within a 2 kb region upstream of all transcription start sites (TSS) defined in Gencode v.19 and then all potentially interacting target peaks within a ±1 Mb region. Pearson’s correlation was assessed between all seed and target peaks across samples using log2 and conditional quantile normalized read counts. Correction for multiple comparisons was conducted using the false discovery rate was implemented across all seed–target peak pairs. Significant chromatin interaction between each promoter region (2 kb upstream of all transcription start sites defined in Gencode v.19) and 10-kb bins of the genome within ±1 Mb was assessed by comparing to a null background generated from random regions of the genome with matched GC content and in the same chromosome as the promoter regions. The correlation between DHS peaks was separately classified and graphed in bins with significant chromatin interaction versus non-significant chromatin interaction. We describe a calculated P value of exactly zero as P < 2.2 × 10⁻¹⁶.
eRNA–mRNA coexpression
FANTOM5 enhancers18 were filtered to include those that overlapped a robust FANTOM5 CAGE peak (that is, expressed eRNAs), but did not overlap a Gencode v.19 TSS within a window of 2 kb upstream and 1 kb downstream of the TSS. The latter filtering criterion ensured that eRNA expression values were not confounded by mRNA or promoter-antisense RNA expression. The filtered enhancers were classified as ‘interacting’ if they overlapped a genomic region that interacted with TSSs based on Hi-C data, and ‘non-interacting’ otherwise. eRNA and mRNA expression was then calculated as previously37.
The proportions of interacting and non-interacting enhancers that expressed eRNAs in at least one of the five FANTOM5 fetal brain samples38 were compared by a χ2 test implemented in the prop.test function in R. We found that a higher proportion of interacting enhancers expressed eRNAs in at least one of the five fetal brain samples analysed (χ2 test, P = 5.07 × 10⁻⁶).
eRNA–mRNA co-expression was assessed across all 49 FANTOM5 human brain samples, including 5 fetal and 44 adult samples, in order to capture expression variation across brain regions and developmental stages. A topological overlap matrix (TOM)39 was constructed based on FANTOM5 CAGE data38 for all eRNAs and mRNAs expressed in at least two brain samples, above a threshold of 0.5 tags per million. TO was calculated using the TOMsimilarity function implemented in the WGCNA package in R, with the following parameters: TOMType = “signed”, TOMDenom = “min”, soft threshold power for adjacency = 7. TO values and Spearman correlation coefficients for interacting and non-interacting eRNA–mRNA pairs were compared using a Kolmogorov–Smirnov test, as well as a Wilcoxon non-parametric test.
Identification of Hi-C interacting regions
We identified Hi-C interacting regions and target genes for (1) expression quantitative trait loci (eQTL)16, (2) human-gained enhancers8, and (3) schizophrenia credible SNPs22. As the highest resolution available for the current Hi-C data was 10 kb, we assigned these enhancers/SNPs to 10-kb bins, obtained the Hi-C interaction profile for the 1 Mb flanking regions (1 Mb upstream to 1 Mb downstream) of each bin. We also made a background Hi-C interaction profile by pooling (1) 255,698 H3K27ac sites from frontal and occipital cortex at post-conception week (PCW) 12 for human-gained enhancers8 and (2) 9,444,230 imputed SNPs for eQTL and schizophrenia SNPs22. To avoid significant Hi-C interactions affecting the distribution fitting, we used the lowest 95 percentiles of Hi-C contacts and removed zero contact values. Using these background Hi-C interaction profiles, we fit the distribution of Hi-C contacts at each distance for each chromosome using the fitdistrplus package (Extended Data Fig. 5a). Significance for a given Hi-C contact was calculated as the probability of observing a stronger contact under the fitted Weibull distribution matched by chromosome and distance. Hi-C contacts with FDR <0.01 were selected as significant interactions. Significant Hi-C interacting regions were overlapped with Gencode v.19 gene coordinates (including 2 kb upstream to TSS to allow detection of enhancer–promoter interactions) to identify interacting genes. Same analysis was performed on Hi-C contact maps from CP, GZ, ES31 and IMR9010. To address the functional significance of target genes, GO enrichment was performed for the interacting genes. Interaction profiles for human-gained enhancers and schizophrenia credible SNPs are summarized in the Supplementary Table.
Calculation of false-discovery rate for Hi-C interactions
Estimated false-discovery rate for interactions were calculated according to Sanyal et al.11. Briefly, we calculated the fraction of false-positive interactions based on significant interactions from three gene desert ENCODE regions (ENr112, ENr113, and ENr313). For example, 45 significant interactions were detected from gene desert ENCODE regions in CP when tested for 28,783 interactions, giving 45/28,783 = 0.156% as the fraction of false-positive interactions. Assuming this fraction applies to genome-wide interactions and based on the fact that we are testing 381,121 interactions for evolutionary loci, 594.5 interactions (0.00156 × 381,121) are expected false-positive interactions. There are 5,339 significant interactions detected in CP, which gives 594.5/5,339 = 11.16% for the false-discovery rate.
For evolutionary human-gained enhancer interacting regions, the false-discovery rate was 11.16% and 10.34% for CP and GZ pooled lists, respectively. When we focus on high-confidence interactions replicated in more than two individuals and in the pooled list, the false-discovery rate drops to 4.82% and 2.45% for CP and GZ, respectively. For schizophrenia GWAS interacting regions (using genome-wide credible SNPs), we obtained a false-discovery rate of 16.04% and 19.17% for CP and GZ pooled lists, and 6.90% and 6.81% for CP and GZ that are replicated in more than two individuals and in the pooled list.
Protein-coding genes interacting with human-specific evolutionary enhancers
Protein-coding genes based on biomaRt (Gencode v.19) were selected and non-synonymous substitution (dN)/synonymous substitution (dS) ratio was calculated for homologues in mouse, rhesus macaque, and chimpanzee for representation of mammals, primates, and great apes, respectively. log2[dN/dS] distributions for protein-coding genes interacting vs non-interacting to human-specific evolutionary enhancers in each lineage were then compared by Wilcoxon signed-rank test.
LncRNAs interacting with human-specific evolutionary enhancers
Long non-coding RNAs (lncRNAs) classified according to evolutionary lineages21 were used to assess whether lineage-specific lncRNAs interact with human-specific evolutionary enhancers. We randomly selected the same number of enhancers (2,104) to the human-specific ones from the total enhancer pool (255,698), identified interacting regions based on the null distribution generated from a background enhancer interaction profile. Significant interacting regions (FDR < 0.01) identified by Hi-C were intersected with lncRNA coordinates21 and interacting lncRNAs for each lineage were counted. This step was repeated 3,000 times to obtain the null lncRNA lineage distribution. LncRNAs interacting with human-specific evolutionary enhancers were also identified and enrichment was tested by calculating P values as the probability of observing more interacting lncRNAs for a given lineage under the null lncRNA lineage distribution.
Epigenetic mark enrichment for Hi-C interacting regions
The functional framework for (1) eQTL, (2) schizophrenia SNPs, and (3) human-gained enhancer-interacting regions was assessed for epigenetic state enrichment. We implemented the same approach as in GREAT40 using the binomial test to analyse the epigenetic state enrichment for cis-regulatory regions. For example, to evaluate whether schizophrenia SNPs are enriched with DHS, the fraction of genome annotated with DHS (p), the number of schizophrenia SNPs (n), and number of schizophrenia SNPs overlapping with DHS (s) were calculated. Significance of the overlaps was tested by binomial probability of P = Prbinom (k ≥ s | n = n, P = p)40. Histone marks and DHS from fetal brains (E081) and adult frontal cortex (E073)32 were used for epigenetic state enrichment.
eQTL analysis
As a first line verification that Hi-C data could identify known functional relationships between SNPs and gene expression we used cis-eQTL data from adult cerebral cortex16, since such data are not yet available from developing brain. The cis-eQTL signal was selected as previously defined16, resulting in 5,565 sentinel marker–transcript pairs (2,373 transcripts and 5,251 SNPs).
We divided eQTL into those without known function (unannotated) and putative functionally annotated SNPs (SNPs that cause missense, frameshift, and splice variants, and SNPs that fall onto gene promoters). Putative functionally annotated SNPs were directly assigned to the genes in which they are located. For the remaining non-annotated intergenic and intronic SNPs for which standard assignments of functional annotation were not available, we identified the genes interacting with the eQTL harbouring region. Combining genes annotated by functional SNPs and those annotated by their Hi-C interactions, we obtained a total of ~3,000 Hi-C defined eQTL candidate genes. Fisher’s exact test was performed to evaluate the significance of the overlap between Hi-C defined eQTL candidate genes and eQTL-associated transcripts. The background gene list includes genes located in the 1 Mb flanking regions around sentinel SNPs. We also observed that while eQTL are usually in close spatial proximity to their associated genes, this is a relative phenomenon, and in ~70% of cases, the eQTL is not associated with the closest gene, consistent with the Hi-C data.
For 5,565 sentinel marker-transcript pairs, we assigned sentinel markers and genes into 10-kb bins, and obtained Hi-C contacts between sentinel markers and genes from the 10 kb binned Hi-C contact maps. As a gene can span across multiple 10-kb bins, the highest interaction in the gene to a sentinel marker was selected as Hi-C contacts as previously described15. We also calculated expected interaction frequency from the normalized 10 kb binned contact matrix based on the distance between two bins. Opposite interaction frequency was calculated by obtaining Hi-C contacts for the opposite site to the sentinel marker with the same distance. Because interaction counts differ in different chromosomes as well as in different cell types, we normalized interaction by chromosomes and cell types. We performed one-way ANOVA and Tukey’s post hoc test for the comparison between different interaction paradigms.
Identification of credible SNPs for schizophrenia GWAS loci
128 linkage disequilibrium (LD)-independent SNPs with genome-wide significance (P < 5 × 10⁻⁸)22 were used as index SNPs to obtain schizophrenia credible SNPs. All SNPs that are associated with P < 1 × 10⁻⁵ and located in the region containing one or more SNPs in LD (r2 > 0.6) with the index SNP were selected, and correlations (LD structure) among this set of SNPs were calculated. CAVIAR24 was applied to summary association statistics and LD structure for each index SNP, and potentially causal (credible) SNPs for each index SNP were identified. Among 55,000 SNPs that are in LD with 128 index SNPs, 7,613 SNPs were selected as causal by CAVIAR (-r 0.95, posterior probability; -c 2, maximum number of causal SNPs). Here we refer to these CAVIAR-identified SNPs as credible SNPs. Genes interacting to credible SNPs were identified for CP, GZ, ES, and IMR90. A separate set of credible SNPs initially reported from the original study was also processed with the same method22.
Identification of schizophrenia GWAS SNP-associated genes
We classified credible SNPs based on potential functionality (flow chart in Extended Data Fig. 7). For credible SNPs classified as functional (stop gained variant, frameshift variant, splice donor variant, NMD transcript variant, and missense variant) according to biomaRt, we selected genes in which those SNPs locate. For those that are not directly affecting the gene function, we selected SNPs that fall onto the promoter of genes (2 kb upstream to TSS). Remaining un-annotated SNPs were assigned to physically interacting genes based defined by Hi-C in developing brain, since schizophrenia is postulated to have neurodevelopmental origins23,41. This pipeline gives a total of ~900 genes potentially associated with GWAS SNPs.
Identification of closest genes and LD genes
The closest genes to human-gained enhancers and schizophrenia index SNPs were obtained by closestBed command from bedtools. Gene coordinates from Gencode v.19 including 2 kb upstream to TSS were used to identify the closest genes. LD genes refer to all genes in the LD region, defined as 108 schizophrenia-associated genome-wide significant regions in the original study22. We overlapped gene coordinates from Gencode v.19 with LD regions as defined in the original study22 to find genes that reside in LD regions. The closest genes and LD genes were compared with Hi-C interacting genes. Venn diagrams were generated by Vennerable package in R. Only protein-coding genes were included in plotting Venn diagrams.
Calculation of distance between SNPs and genes
For LD genes and closest genes, the shortest distance between an index SNP and a target gene was selected. For credible SNPs, (1) the distance between functional credible SNPs and target genes was set as 0, because functional SNPs reside in the gene, (2) the distance between promoter credible SNPs and target genes was calculated as the distance between SNPs and TSS of a gene, (3) the distance between credible SNPs and Hi-C interacting genes was calculated based on the distance between SNPs and Hi-C interacting bins (note that this distance has a unit of 10 kb). We then combined the distance distributions from the three categories.
Luciferase assay
Regulatory sequence containing rs1191551 (chr14:30,000,155-30,000,655, 250 bp flanking the SNP) was cloned to the pGL4.24 vector (Promega) upstream of minimal promoter. HEK293 cells in 96-well plates were transfected with the luciferase plasmid (100 ng) along with the internal control plasmid (pRL-TK, 10 ng, Promega) by lipofectamine (0.5 μl per well, Invitrogen). Luciferase activity was measured 48 h after the transfection by Dual Luciferase Reporter System (Promega). Firefly luciferase activity was normalized to Renilla luciferase activity. Each experiment was repeated in quadruplicate with eight technical replicates for each experiment. Significance was calculated using a linear mixed effects model with transfection condition as a fixed effect and technical replicate as a random effect.
CRISPR/Cas9-mediated deletion of rs1191551
Guide RNAs (gRNAs) flanking rs1191551 were designed by Benchling (https://benchling.com/). Two sets of gRNA pairs were cloned into pL-CRISPR.EFS.GFP (Addgene, 57818) and pL-CRISPR.EFS.tRFP (Addgene, 57819); the first set (CRISPR1) and the second set (CRISPR2) induce double stranded breaks (DSB) that generate ~760 bp and ~530 bp deletion, respectively. gRNA targeting 5′ of rs1191551 was cloned into pL-CRISPR.EFS.tRFP and gRNA targeting 3′ of rs1191551 was cloned into pL-CRISPR.EFS.GFP. Empty vectors (pL-CRISPR.EFS.GFP and pL-CRISPR.EFS.tRFP) without any gRNA insertion were used as control. Virus was generated by co-transfection of CRISPR vectors with pVSVg (Addgene, 8454) and psPAX2 (Addgene, 12260) in HEK293 cells. Primary human neural progenitor cells (phNPC) were infected with a pair of viruses (empty vectors, CRISPR1, CRISPR2) on the day of split and differentiated as previously described42. These cells have not been tested for mycoplasma contamination. After 2.5 weeks of differentiation, cells that are infected by both gRNAs (RFP+/GFP+) were sorted by FACS. Genomic DNA was extracted by DNeasy Blood and Tissue Kit (Qiagen) and amplified by PCR using Herculase II Fusion DNA Polymerases (Agilent Technologies). RNA was extracted by miRNeasy Mini Kit (Qiagen) and FOXG1 and PRKD1 expression level was measured by qPCR (LightCycler 480 SYBR Green I Master, Roche) and normalized to GAPDH. Each experiment was repeated twice with two (CRISPR1, CRISPR2) or three (empty vector) biological replicates for each experiment. gRNA and primer sequences for both genomic DNA and qPCR are described in the Supplementary Table.
Schizophrenia differential gene expression analysis
RNA-sequencing data from 557 total human post-mortem dorsolateral prefrontal cortex (DLPFC) brain samples were obtained from subjects with schizophrenia (n = 262) and neurotypical controls (n = 295), as part of the CommonMind Consortium (http://commonmind.org). Brain tissue for the study was obtained from the following brain bank collections: the Mount Sinai NIH Brain and Tissue Repository, the University of Pennsylvania Alzheimer’s Disease Core Center, the University of Pittsburgh NeuroBioBank and Brain and Tissue Repositories and the NIMH Human Brain Collection Core. Details of sample collection and processing are described here: (https://www.synapse.org/#!Synapse:syn2759792/wiki/194729).
Reads were mapped to human genome build hg19 with Ensembl v.70 annotations using TopHat version 2.0.9. Quantification was performed using HTSeq-Counts v.0.6.0 in intersection-strict mode. The resulting count level data was made available for downstream analysis through Sage Synapse.
Expression data was filtered to only include genes with 10+ counts in at least half of the samples. Filtered read counts were then log2-transformed and normalized for GC content, gene length, and sequencing depth using the CQN package in R43. Batch correction was performed using ComBat44, for each of four sets of experimental batches: RNA isolation batch, sequencing library batch, flowcell batch, and ribozero batch. Following batch correction, outlier samples were detected by calculating standardized sample network connectivity Z scores, and samples with Z < –2 were removed from downstream analysis as described45.
Given the confounding between diagnostic group and technical/biological covariates, we first separated the data set into a schizophrenia-control subset and then balanced groups by all covariates, such that the case/control status was not significantly associated with any measured covariate (P > 0.05). To control for differences in RNA quality, read depth and other sequencing-related technical artefacts across subjects, we created six ‘sequencing statistics’ referred to as seqPC1–seqPC6 that consisted of the 1st to 6th principle components of RNA-SeQC output metrics. These statistics collectively accounted for 99% of the variance of the RNA-SeQC metrics and were included as covariates in our linear regression framework to control for technical variation.
Differential gene expression of log2[normalized FPKM] expression values was calculated using a multiple linear regression model. To remove the contribution of potential confounding variables from our gene expression analyses, we first regressed biological and technical covariates (except diagnosis) from the expression data, using the model: lm(datExpr ~ Age + Sex + pH + PMI + RIN + 28S/18SRatio + Ethnicity + Institution + SeqPC1 + SeqPC2 + SeqPC3 + SeqPC4 + SeqPC5 + SeqPC6). Group differences in gene expression were then assessed on the regressed expression matrix: lm(datExpr.reg ~ Dx). Regression coefficients (log2 fold-change beta values) for each gene were calculated for each group. P values were FDR-corrected for multiple comparisons.
Extended Data
Extended Data Figure 1. Basic characterization of Hi-C library.
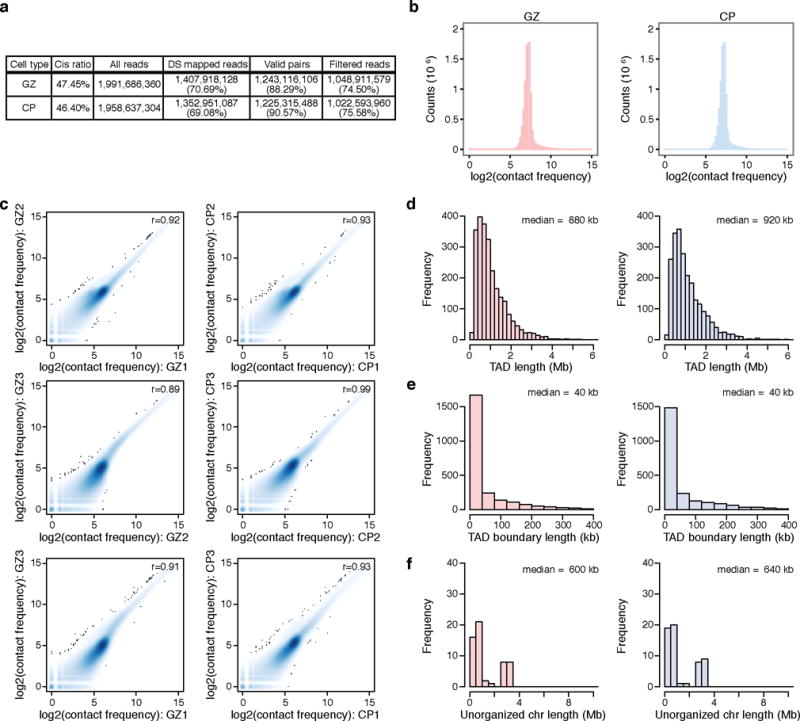
a, Hi-C library sequencing information. Percentage for double-stranded (DS) reads indicates percentage of DS reads to all reads, and percentage for valid pairs and filtered reads indicates percentage of valid pairs and filtered reads to DS reads. Cis ratio, ratio of cis (intra-chromosomal) reads to the total number of reads. b, Frequency distribution of Hi-C contacts in GZ (left) and CP (right). c, Pearson correlation between replicates at 100 kb resolution is >0.8, demonstrating a high degree of correlation between biological replicates from different individuals. d, Size distribution of TADs in GZ (left) and CP (right). e, f, Size distribution of genomic regions in between TADs that are less than (TAD boundaries, e) and bigger than (unorganized chromosome, f) 400 kb in GZ (left) and CP (right).
Extended Data Figure 2. Inter-chromosome conformation is associated with various genomic features.
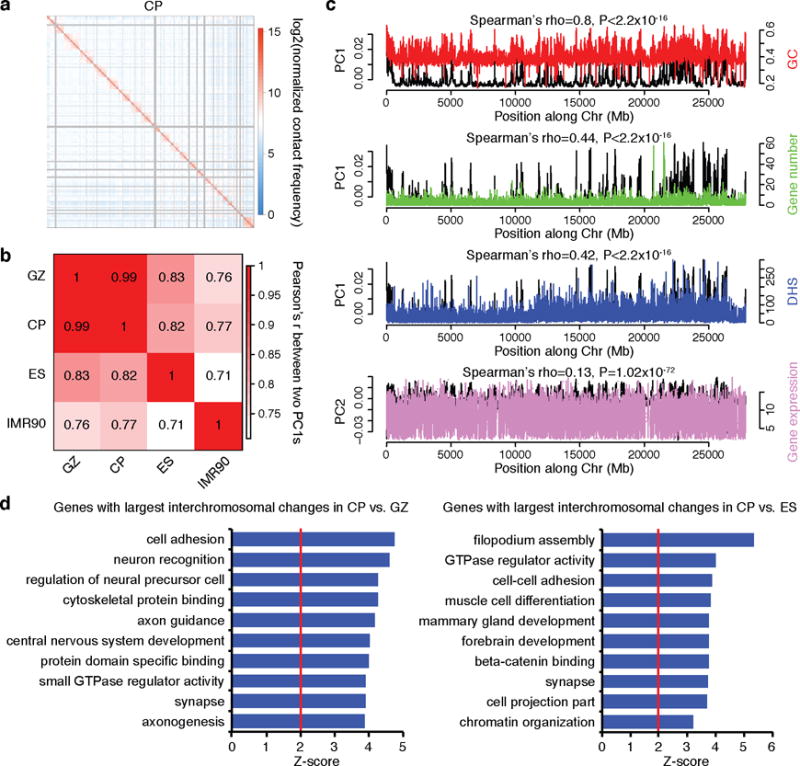
a, Representative heat map of the chromosome contact matrix of CP. Normalized contact frequency (contact enrichment) is colour-coded according to the legend on the right. b, Pearson correlation of the leading principle component (PC1) of inter-chromosomal contacts at 100 kb resolution between in vivo cortical layers and non-neuronal cell types (ES and IMR90). PC1s from neuronal tissues (CP and GZ) have significantly higher correlation than the PC1s between non-neuronal cell types, consistent with the higher similarity between tissues from brain vs the two other cell lines, although batch effects are also likely to contribute. c, Spearman correlation of PC1 of chromatin interaction profile of fetal brain (GZ) with GC content, gene number, DHS of fetal brain, and gene expression level in fetal laminae. d, GO enrichment of genes located in the top 1,000 highly interacting inter-chromosomal regions specific to CP vs GZ (left), and CP vs ES (right), indicating that genes located on dynamic chromosomal regions are enriched for neuronal development.
Extended Data Figure 3. Intra-chromosomal conformation is associated with various genomic features.
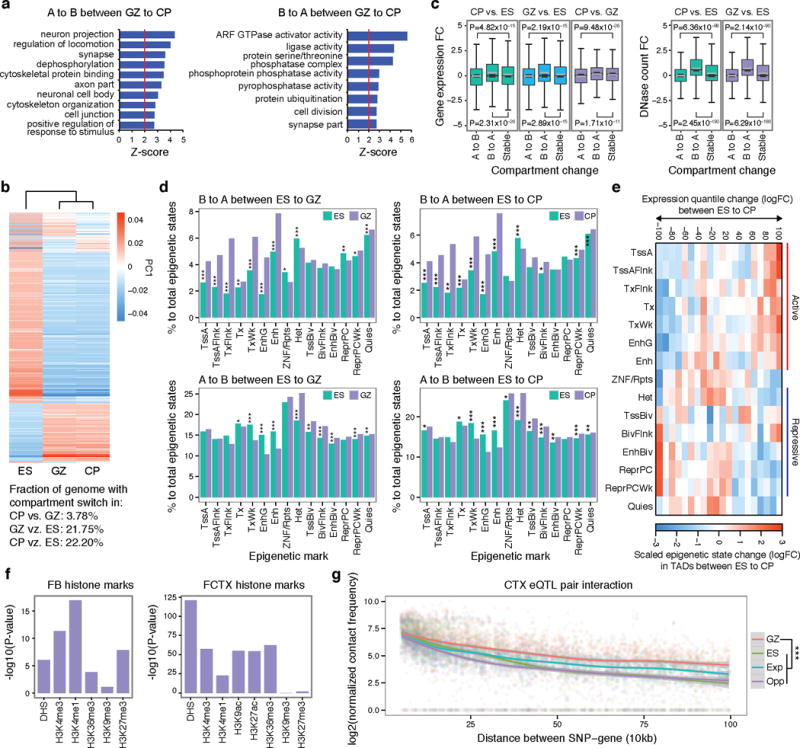
a, GO enrichment of genes that change compartment status from A to B (left) and B to A (right) in GZ to CP. b, Heat map of PC1 values of the genome that change compartment status in different cell types. Fraction of genome with compartment switch in different lineages is described below. c, Distribution of gene expression fold change (FC, left) and DHS FC (right) for genes/regions that change compartment status (‘A to B’ or ‘B to A’) or that remain the same (stable) in different cell/tissue types. B to A compartment shift is associated with increased DHS and gene expression, whereas the A to B shift is associated with decreased DHS and gene expression. P values from one-way ANOVA; whiskers, 1.5 × interquartile range (IQR); centre lines, median (black) and mean (grey). d, Percentage of epigenetic states for genomic regions that change compartment status between ES and GZ (left) and ES and CP (right). Note that B to A shift in ES to GZ/CP is associated with increased proportion of active promoter and transcribed regions (TssA and Tx) and enhancers (Enh, top), while A to B shift in ES to GZ/CP is associated with increased proportions of repressive marks (Het and ReprPCWk, bottom). *P < 0.05, **P < 0.01, ***P < 0.001. P values from Fisher’s test. Annotation for epigenetic marks described in a core 15-state model from ref. 32. e, Epigenetic changes in TADs mediate gene expression changes during neuronal differentiation. Genes were divided by expression FC between ES and differentiated neural cells, and epigenetic states in the TADs containing genes in each group were counted and compared between ES and CP. Upregulated genes in neurons locate in TADs with more active epigenetic marks in CP than in ES, while downregulated genes in neurons locate in TADs with more repressive marks in CP than in ES. Epigenetic states associated with activation and transcription of the genes were marked as red bars, while those associated with repression were marked as blue bars on the right. Annotation for epigenetic states described in ref. 32. f, Histone mark enrichment for adult cortical eQTL in fetal brain (FB, left) and adult frontal cortex (FCTX, right). g, Hi-C interaction frequency between eQTL and associated transcripts. LOESS smooth curve plotted with actual data points. Shaded area corresponds to 95% confidence intervals. GZ, chromatin contact frequency in GZ; ES, chromatin contact frequency in ES; Exp, expected interaction frequency given the distance between two regions; Opp, opposite interaction frequency: interaction frequency of SNPs and transcripts when the position of genes was mirrored relative to the eQTL. ***P < 0.001, P values from repeated measure of ANOVA.
Extended Data Figure 4. Interacting regions share co-expression and epigenetic states.
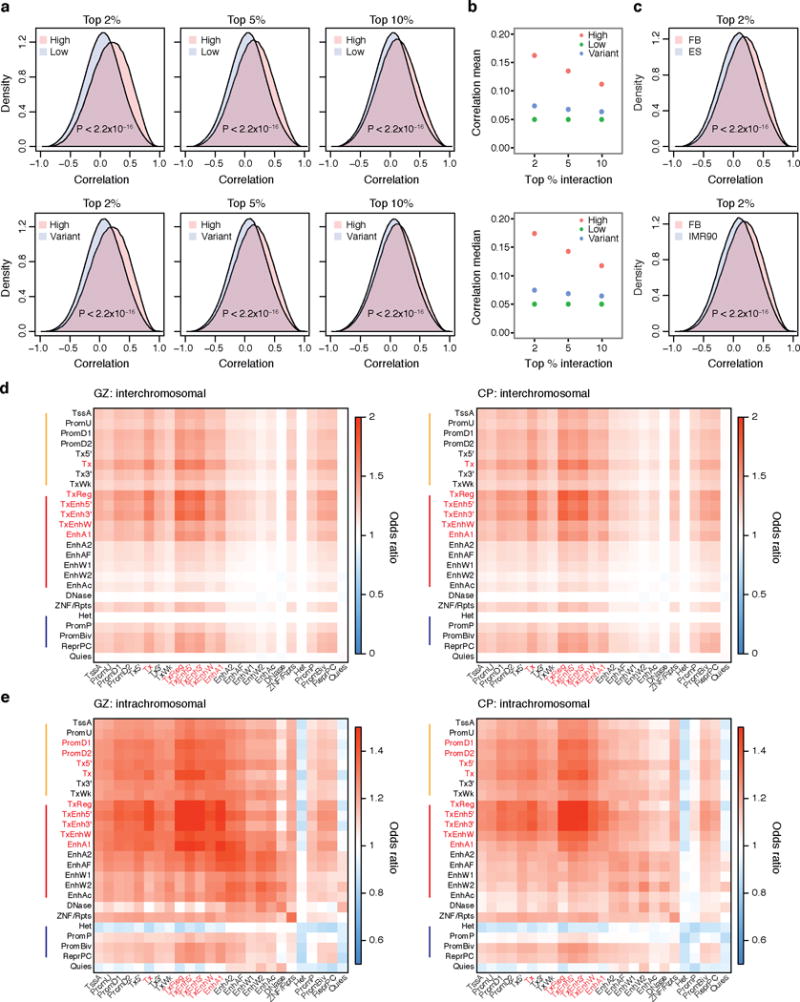
a, Top 2% (left), 5% (middle) and 10% (right) highest interacting regions both in GZ and CP (High) show positive correlation in gene expression, while top lowest interacting regions (Low) and variant interacting regions (Variant) have no skew in distribution. P values from Wilcoxon signed-rank test. b, Mean (top) and median (bottom) values for gene expression correlation for high, low and variant interacting regions with different cut-offs, indicating that higher the interaction, higher the correlation of gene expression. c, Top 2% highest interacting regions in fetal brain (FB) show more positive correlation in fetal brain gene expression compared with top 2% highest interacting regions in non-neuronal cells such as ES and IMR90 cells. d, Epigenetic state combination in inter-chromosomal interacting regions in GZ (left) and CP (right). Enhancers (TxEnh5′, TxEnh3′, TxEnhW, EnhA1), transcriptional regulatory regions (TxReg), and transcribed regions (Tx) interact highly to each other as marked in red. e, Epigenetic state combination in intra-chromosomal interacting regions in GZ (left) and CP (right). Enhancers (TxEnh5′, TxEnh3′, TxEnhW, EnhA1) and transcriptional regulatory regions (TxReg) interact highly to promoters (PromD1, PromD2) and transcribed regions (Tx5′, Tx) as marked in red. Inter- and intra-chromosomal contact frequency map is compared to epigenetic state combination matrix by Fisher’s test to calculate the enrichment of shared epigenetic combinations in interacting regions. Coloured bars on the left represent epigenetic marks associated with promoters and transcribed regions (orange), enhancers (red), and repressive marks (blue). Annotation for epigenetic marks is described in a 25-state model from ref. 35.
Extended Data Figure 5. Characterization of chromatin interactome of human-gained enhancers.
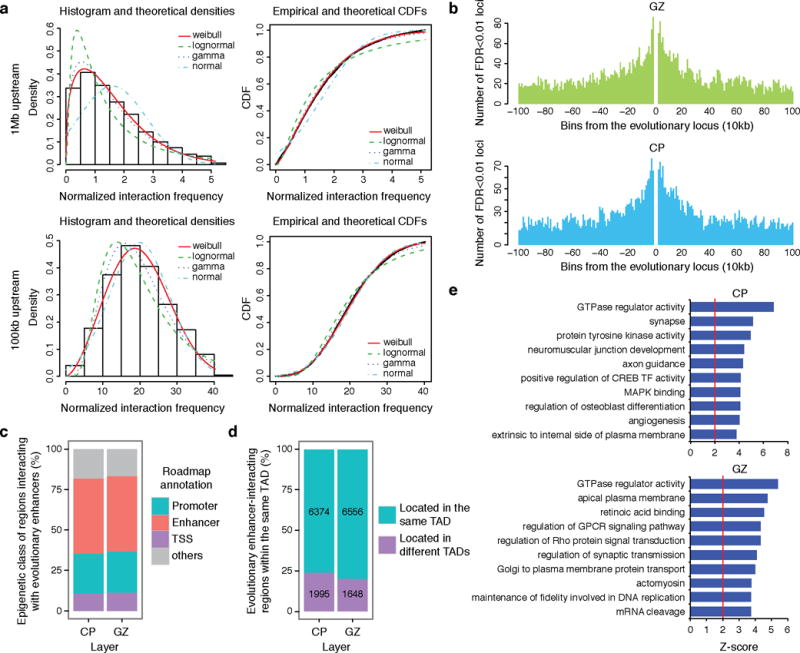
a, Distribution fitting of normalized chromatin interaction frequency between human-gained enhancers and 1 Mb (top) or 100 kb upstream (bottom) regions. Weibull distribution (red line) fits Hi-C interaction frequency the best for every distance range. b, Distribution of the number of significant interacting loci with human-gained enhancers in GZ (top) and CP (bottom). c, The fraction of epigenetic states for loci interacting with human-gained enhancers in CP and GZ. d, The proportions of human-gained enhancers and interacting regions within the same TAD. e, GO enrichment for human-gained interacting genes in CP (left) and GZ (right).
Extended Data Figure 6. Human-gained enhancers interact to evolutionary lineage-specific lncRNAs.
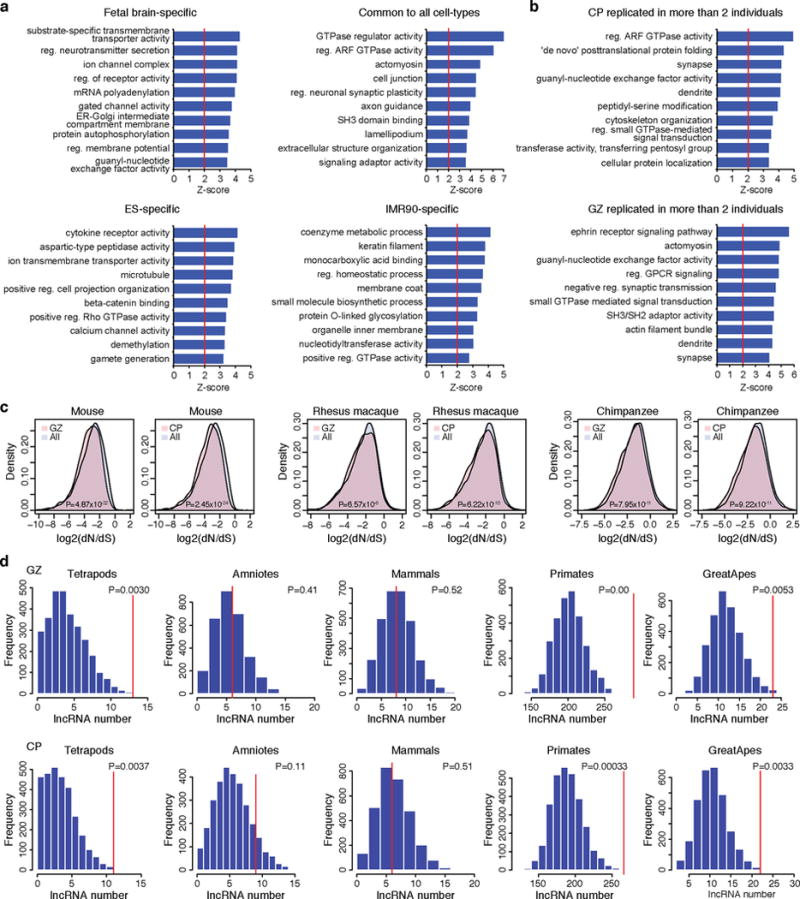
a, GO enrichment for cell type-specific human-gained enhancer interacting genes. b, GO enrichment for human-gained enhancer interacting genes replicated in more than two individuals from CP (top) and GZ (bottom). c, Protein-coding genes interacting with human-gained enhancers in CP and GZ have lower non-synonymous substitutions (dN) to synonymous substitutions (dS) ratio compared to protein-coding genes that do not interact with human-gained enhancers (All) in mammals (mouse), primates (rhesus macaque), and great apes (chimpanzee), indicative of purifying selection. P values from Wilcoxon signed-rank test. d, Number of lineage-specific lncRNAs interacting to human-gained enhancers (red vertical lines in the graph) in GZ (top) and CP (bottom). Null distribution was generated from 3,000 permutations, where the number of lncRNAs interacting to the same number of enhancers pooled from all fetal brain enhancers was counted.
Extended Data Figure 7. Defining schizophrenia risk genes based on functional annotation of credible SNPs.
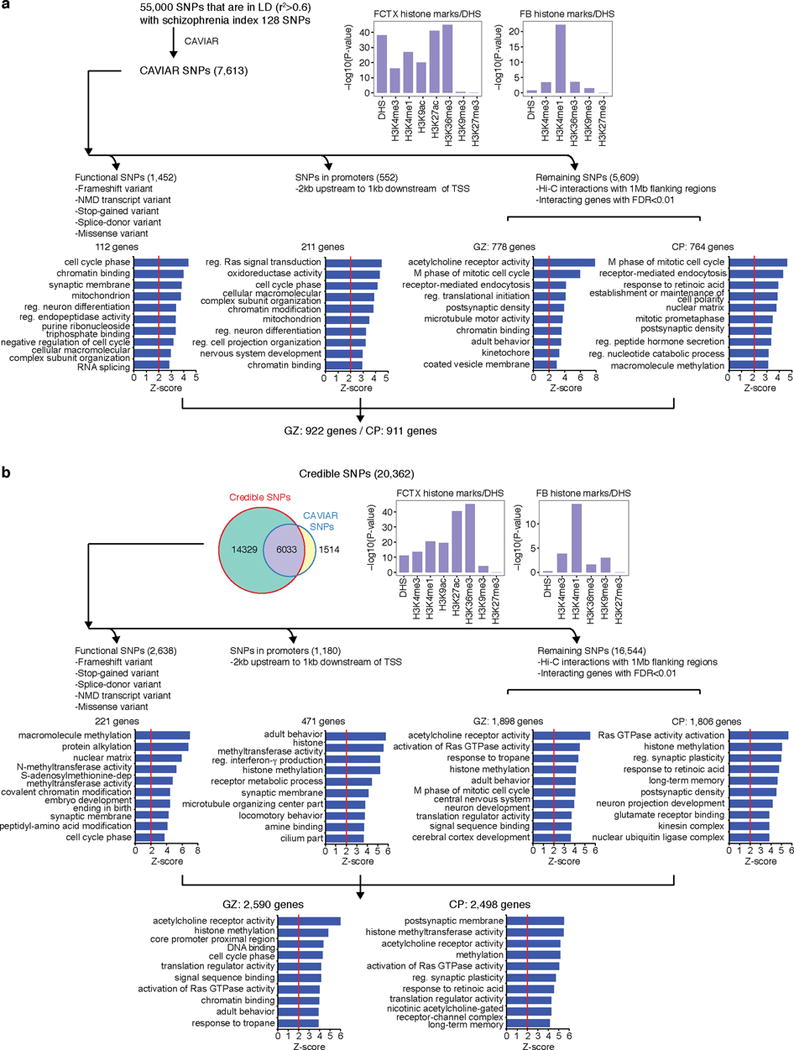
a, b, Credible SNPs identified by CAVIAR (a) and defined in the original study (b) are categorized into functional SNPs, SNPs that fall onto gene promoters, and un-annotated SNPs. DHS and histone marks enrichment of credible SNPs was assessed in fetal brain (FB) and adult frontal cortex (FCTX). Functional SNPs and promoter SNPs were directly assigned to the target genes, while un-annotated SNPs were assigned to the target genes via Hi-C interactions in CP and GZ. GO enrichment for genes identified by each category is shown in the bottom. Note that two credible SNP lists overlap with each other; credible SNPs defined in the original study are not restricted to genome-wide significant loci, so they include broader range (20,362 credible SNPs vs 7,547 CAVIAR SNPs) of SNPs than CAVIAR credible SNPs. NMD, nonsense-mediated decay.
Extended Data Figure 8. Chromatin interactions identify genes that are neither the closest nor in the LD with index SNPs.
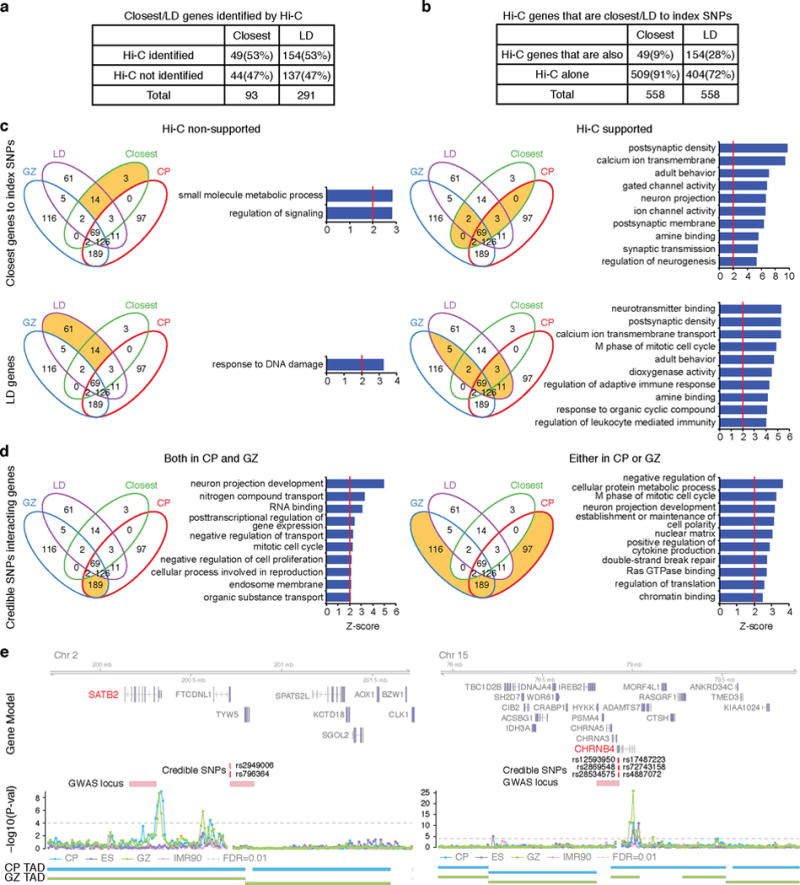
a, Number of closest genes and LD genes that interact with credible SNPs (Hi-C identified) vs not (Hi-C non-identified). b, Number of credible SNP interacting genes that are closest to or in LD with index SNPs (Hi-C genes that are also) vs not (Hi-C alone). Hi-C genes here contain only physically interacting genes, but not genes identified by functional SNPs. c, GO enrichment for the closest genes (top) and genes in LD with index SNPs (bottom) that are identified by the schizophrenia risk gene assessment pipeline in Extended Data Fig. 7 (right) vs not (left). d, GO enrichment for schizophrenia risk genes that are neither the closest genes nor in LD to index SNPs. Intersect (left) and union (right) of genes identified by chromatin contacts in CP and GZ are indicated. Venn diagrams are marked in orange to depict the gene list assessed for GO enrichment. e, Representative interaction map of a 10 kb bin, in which credible SNPs reside, to the corresponding 1 Mb flanking regions. Credible SNPs, genomic coordinates for credible SNPs that interact to the target gene; GWAS locus, LD region for the index SNP.
Extended Data Figure 9. Cell-type specificity and reproducibility of Hi-C interactions with schizophrenia GWAS hits.
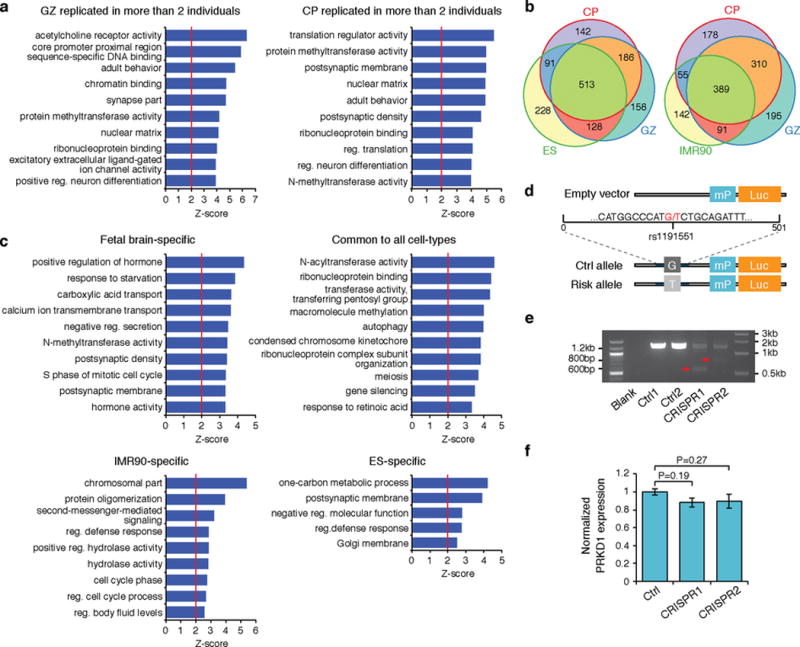
a, GO enrichment for schizophrenia risk genes replicated in more than two individuals in CP (left) and GZ (right). b, Overlap between genes that interact to schizophrenia credible SNPs in CP and GZ vs ES (left) and IMR90 (right). c, GO enrichment for genes that interact to schizophrenia credible SNPs in cell-type specific manner. d, Schematic showing the incorporation of sequence flanking rs1191551 into reporter (Luc) vector with a minimal promoter (mP). e, PCR amplification of targeted genomic region demonstrates deletion of the SNP-containing region. Expected band size, 587 bp (CRISPR1) and 813 bp (CRISPR2). f, CRISPR/Cas9-mediated deletion of rs1191551 flanking region does not affect the closest protein-coding gene PRKD1 expression. Normalized expression levels of PRKD1 relative to control (Ctrl) (mean ± standard error, n = 6 (Ctrl), 4 (CRISPR1 and CRISPR2)). P values, one-way ANOVA and post hoc Tukey test.
Extended Data Figure 10. High probability schizophrenia risk loci predicted by Hi-C interactions and cortical eQTL.
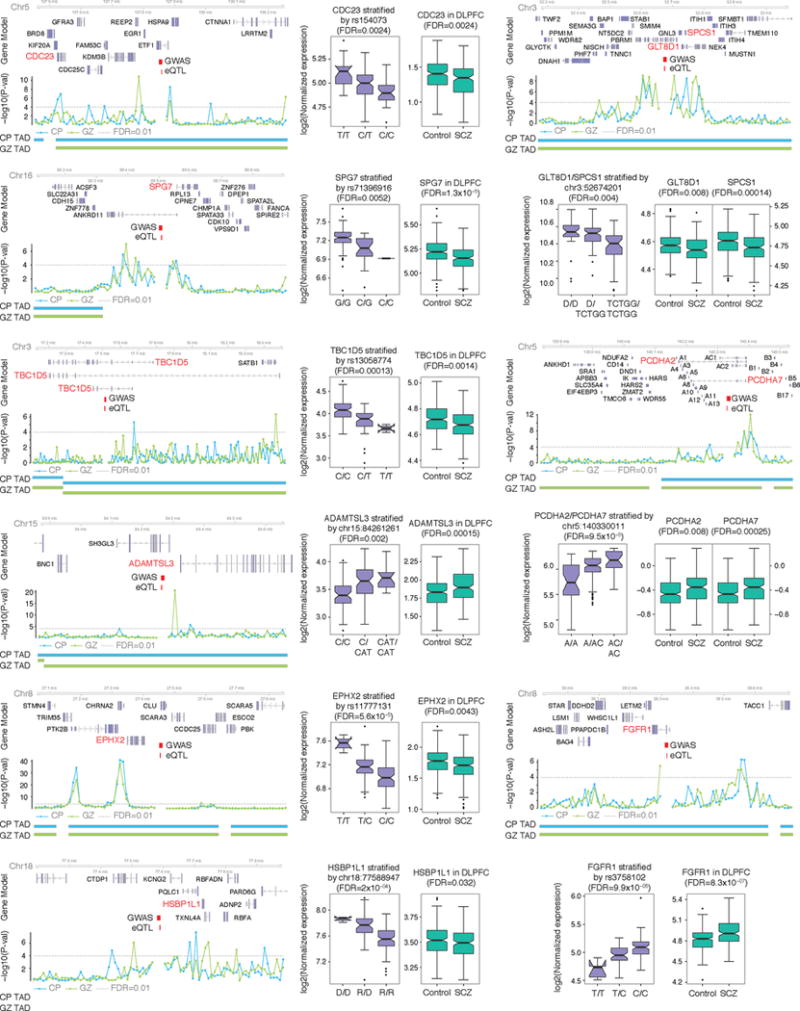
Hi-C interactions and eQTL association target the same gene (marked in red). Risk alleles lead to target gene dysregulation in the same direction as in schizophrenia brains. Chromosome ideogram and genomic axis (top); gene model based on Gencode v.19 and target genes identified by both Hi-C and eQTL are marked in red; Genomic coordinates for the 10 kb bin containing credible SNPs (schizophrenia GWAS) and eQTL; –log10[P value], P value for the significance of the interaction between schizophrenia credible SNPs and each 10 kb bin, grey dashed line denotes FDR = 0.01; TAD borders in CP and GZ are indicated. Protocadherins (PCDH) gene family is marked as A (PCDHA) and B (PCDHB) except target genes, PCDHA2 and PCDHA7. Whiskers and centre lines correspond to 1.5 × IQR and median, respectively.
Supplementary Material
Acknowledgments
This work was supported by NIH grants to D.H.G. (5R01MH060233; 5R01MH100027; 3U01MH103339; 1R01MH110927; 1R01MH094714), F.H. and E.E. (R01MH101782; R01ES022282; T32MH073526), J.L.S. (K99MH102357), and J.E. (R01ES024995), NSF CAREER Award (#1254200) to J.E., Glenn/AFAR Postdoctoral Fellowship Program (20145357) and Basic Science Research Program through the National Research Foundation of Korea (2013024227) to H.W., CIRM- BSCRC Training Grant (TG2-01169) to L.T.U., NRSA Training Grant to N.N.P. (F30MH099886; UCLA MSTP), NHMRC project grant (APP1062510) and ARC DECRA fellowship (DE140101033) to I.V. The Hi-C library was sequenced by the BSCRC, and fetal tissue was collected from the UCLA Center for Aids Research (CFAR, 5P30 AI028697). Schizophrenia RNA-seq data were generated as part of the CommonMind Consortium (see Methods section). eQTL data was provided by M. Ryten and A. Ramasamy. We thank S. Feng, Y. Tian, V. Swarup, and P. S. Mischel for helpful discussions and critical reading of the manuscript.
Footnotes
Supplementary Information is available in the online version of the paper.
Author Contributions H.W. designed and performed the Hi-C experiments, implemented the analysis pipeline, interpreted results of Hi-C and performed integration with other expression and epigenetic data, and co-wrote the manuscript. L.T.U., C.O., D.L. and J.H. performed sample collection, brain dissection, and genome editing experiments. J.L.S. and N.N.P. contributed to integrative and statistical analysis. M.G. analysed the schizophrenia transcriptomic data. G.J.S. and I.V. performed eRNA–mRNA correlation analyses. F.H. and E.E. aided in the implementation of CAVIAR for credible SNP selection and interpretation of the data. C.L. helped establish the initial Hi-C protocol. J.E. aided in the integration and interpretation of epigenetic data, and edited the manuscript. D.H.G. supervised the experimental design and analysis, interpreted results, provided funding, and co-wrote the manuscript.
Author Information Sequencing data from this study have been deposited in the Gene Expression Omnibus and dbGaP under the accession number GSE77565 and phs001190.v1.p1, respectively.
The authors declare no competing financial interests. Readers are welcome to comment on the online version of the paper.
Reviewer Information Nature thanks D. Goldstein, B. Ren and the other anonymous reviewer(s) for their contribution to the peer review of this work.
References
- 1.Lieberman-Aiden E, et al. Comprehensive mapping of long-range interactions reveals folding principles of the human genome. Science. 2009;326:289–293. doi: 10.1126/science.1181369. [DOI] [PMC free article] [PubMed] [Google Scholar]
- 2.Jin F, et al. A high-resolution map of the three-dimensional chromatin interactome in human cells. Nature. 2013;503:290–294. doi: 10.1038/nature12644. [DOI] [PMC free article] [PubMed] [Google Scholar]
- 3.Rao SS, et al. A 3D map of the human genome at kilobase resolution reveals principles of chromatin looping. Cell. 2014;159:1665–1680. doi: 10.1016/j.cell.2014.11.021. [DOI] [PMC free article] [PubMed] [Google Scholar]
- 4.Parikshak NN, et al. Integrative functional genomic analyses implicate specific molecular pathways and circuits in autism. Cell. 2013;155:1008–1021. doi: 10.1016/j.cell.2013.10.031. [DOI] [PMC free article] [PubMed] [Google Scholar]
- 5.McCarthy SE, et al. De novo mutations in schizophrenia implicate chromatin remodeling and support a genetic overlap with autism and intellectual disability. Mol Psychiatry. 2014;19:652–658. doi: 10.1038/mp.2014.29. [DOI] [PMC free article] [PubMed] [Google Scholar]
- 6.De Rubeis S, et al. Synaptic, transcriptional and chromatin genes disrupted in autism. Nature. 2014;515:209–215. doi: 10.1038/nature13772. [DOI] [PMC free article] [PubMed] [Google Scholar]
- 7.Geschwind DH, Rakic P. Cortical evolution: judge the brain by its cover. Neuron. 2013;80:633–647. doi: 10.1016/j.neuron.2013.10.045. [DOI] [PMC free article] [PubMed] [Google Scholar]
- 8.Reilly SK, et al. Evolutionary genomics Evolutionary changes in promoter and enhancer activity during human corticogenesis. Science. 2015;347:1155–1159. doi: 10.1126/science.1260943. [DOI] [PMC free article] [PubMed] [Google Scholar]
- 9.Imakaev M, et al. Iterative correction of Hi-C data reveals hallmarks of chromosome organization. Nat Methods. 2012;9:999–1003. doi: 10.1038/nmeth.2148. [DOI] [PMC free article] [PubMed] [Google Scholar]
- 10.Dixon JR, et al. Topological domains in mammalian genomes identified by analysis of chromatin interactions. Nature. 2012;485:376–380. doi: 10.1038/nature11082. [DOI] [PMC free article] [PubMed] [Google Scholar]
- 11.Sanyal A, Lajoie BR, Jain G, Dekker J. The long-range interaction landscape of gene promoters. Nature. 2012;489:109–113. doi: 10.1038/nature11279. [DOI] [PMC free article] [PubMed] [Google Scholar]
- 12.Mifsud B, et al. Mapping long-range promoter contacts in human cells with high-resolution capture Hi-C. Nat Genet. 2015;47:598–606. doi: 10.1038/ng.3286. [DOI] [PubMed] [Google Scholar]
- 13.Thurman RE, et al. The accessible chromatin landscape of the human genome. Nature. 2012;489:75–82. doi: 10.1038/nature11232. [DOI] [PMC free article] [PubMed] [Google Scholar]
- 14.Cookson W, Liang L, Abecasis G, Moffatt M, Lathrop M. Mapping complex disease traits with global gene expression. Nat Rev Genet. 2009;10:184–194. doi: 10.1038/nrg2537. [DOI] [PMC free article] [PubMed] [Google Scholar]
- 15.Duggal G, Wang H, Kingsford C. Higher-order chromatin domains link eQTLs with the expression of far-away genes. Nucleic Acids Res. 2014;42:87–96. doi: 10.1093/nar/gkt857. [DOI] [PMC free article] [PubMed] [Google Scholar]
- 16.Ramasamy A, et al. Genetic variability in the regulation of gene expression in ten regions of the human brain. Nat Neurosci. 2014;17:1418–1428. doi: 10.1038/nn.3801. [DOI] [PMC free article] [PubMed] [Google Scholar]
- 17.Kim TK, et al. Widespread transcription at neuronal activity-regulated enhancers. Nature. 2010;465:182–187. doi: 10.1038/nature09033. [DOI] [PMC free article] [PubMed] [Google Scholar]
- 18.Andersson R, et al. An atlas of active enhancers across human cell types and tissues. Nature. 2014;507:455–461. doi: 10.1038/nature12787. [DOI] [PMC free article] [PubMed] [Google Scholar]
- 19.Florio M, et al. Human-specific gene ARHGAP11B promotes basal progenitor amplification and neocortex expansion. Science. 2015;347:1465–1470. doi: 10.1126/science.aaa1975. [DOI] [PubMed] [Google Scholar]
- 20.Bond J, et al. ASPM is a major determinant of cerebral cortical size. Nat Genet. 2002;32:316–320. doi: 10.1038/ng995. [DOI] [PubMed] [Google Scholar]
- 21.Necsulea A, et al. The evolution of lncRNA repertoires and expression patterns in tetrapods. Nature. 2014;505:635–640. doi: 10.1038/nature12943. [DOI] [PubMed] [Google Scholar]
- 22.Schizophrenia Working Group of the Psychiatric Genomics Consortium. Biological insights from 108 schizophrenia-associated genetic loci. Nature. 2014;511:421–427. doi: 10.1038/nature13595. [DOI] [PMC free article] [PubMed] [Google Scholar]
- 23.Gulsuner S, et al. Spatial and temporal mapping of de novo mutations in schizophrenia to a fetal prefrontal cortical network. Cell. 2013;154:518–529. doi: 10.1016/j.cell.2013.06.049. [DOI] [PMC free article] [PubMed] [Google Scholar]
- 24.Hormozdiari F, Kostem E, Kang EY, Pasaniuc B, Eskin E. Identifying causal variants at loci with multiple signals of association. Genetics. 2014;198:497–508. doi: 10.1534/genetics.114.167908. [DOI] [PMC free article] [PubMed] [Google Scholar]
- 25.Fromer M, et al. De novo mutations in schizophrenia implicate synaptic networks. Nature. 2014;506:179–184. doi: 10.1038/nature12929. [DOI] [PMC free article] [PubMed] [Google Scholar]
- 26.Network and Pathway Analysis Subgroup of Psychiatric Genomics Consortium. Psychiatric genome-wide association study analyses implicate neuronal, immune and histone pathways. Nat Neurosci. 2015;18:199–209. doi: 10.1038/nn.3922. [DOI] [PMC free article] [PubMed] [Google Scholar]
- 27.Jones CK, Byun N, Bubser M. Muscarinic and nicotinic acetylcholine receptor agonists and allosteric modulators for the treatment of schizophrenia. Neuropsychopharmacology. 2012;37:16–42. doi: 10.1038/npp.2011.199. [DOI] [PMC free article] [PubMed] [Google Scholar]
- 28.Graham V, Khudyakov J, Ellis P, Pevny L. SOX2 functions to maintain neural progenitor identity. Neuron. 2003;39:749–765. doi: 10.1016/s0896-6273(03)00497-5. [DOI] [PubMed] [Google Scholar]
- 29.Roussos P, et al. A role for noncoding variation in schizophrenia. Cell Reports. 2014;9:1417–1429. doi: 10.1016/j.celrep.2014.10.015. [DOI] [PMC free article] [PubMed] [Google Scholar]
- 30.Kortüm F, et al. The core FOXG1 syndrome phenotype consists of postnatal microcephaly, severe mental retardation, absent language, dyskinesia, and corpus callosum hypogenesis. J Med Genet. 2011;48:396–406. doi: 10.1136/jmg.2010.087528. [DOI] [PMC free article] [PubMed] [Google Scholar]
- 31.Dixon JR, et al. Chromatin architecture reorganization during stem cell differentiation. Nature. 2015;518:331–336. doi: 10.1038/nature14222. [DOI] [PMC free article] [PubMed] [Google Scholar]
- 32.Kundaje A, et al. Integrative analysis of 111 reference human epigenomes. Nature. 2015;518:317–330. doi: 10.1038/nature14248. [DOI] [PMC free article] [PubMed] [Google Scholar]
- 33.Miller JA, et al. Transcriptional landscape of the prenatal human brain. Nature. 2014;508:199–206. doi: 10.1038/nature13185. [DOI] [PMC free article] [PubMed] [Google Scholar]
- 34.Miller JA, Horvath S, Geschwind DH. Divergence of human and mouse brain transcriptome highlights Alzheimer disease pathways. Proc Natl Acad Sci USA. 2010;107:12698–12703. doi: 10.1073/pnas.0914257107. [DOI] [PMC free article] [PubMed] [Google Scholar]
- 35.Ernst J, Kellis M. Large-scale imputation of epigenomic datasets for systematic annotation of diverse human tissues. Nat Biotechnol. 2015;33:364–376. doi: 10.1038/nbt.3157. [DOI] [PMC free article] [PubMed] [Google Scholar]
- 36.van de Leemput J, et al. CORTECON: a temporal transcriptome analysis of in vitro human cerebral cortex development from human embryonic stem cells. Neuron. 2014;83:51–68. doi: 10.1016/j.neuron.2014.05.013. [DOI] [PubMed] [Google Scholar]
- 37.Yao P, et al. Coexpression networks identify brain region-specific enhancer RNAs in the human brain. Nat Neurosci. 2015;18:1168–1174. doi: 10.1038/nn.4063. [DOI] [PubMed] [Google Scholar]
- 38.Forrest AR, et al. A promoter-level mammalian expression atlas. Nature. 2014;507:462–470. doi: 10.1038/nature13182. [DOI] [PMC free article] [PubMed] [Google Scholar]
- 39.Zhang B, Horvath S. A general framework for weighted gene co-expression network analysis. Stat Appl Genet Mol Biol. 2005;4:e17. doi: 10.2202/1544-6115.1128. [DOI] [PubMed] [Google Scholar]
- 40.McLean CY, et al. GREAT improves functional interpretation of cis-regulatory regions. Nat Biotechnol. 2010;28:495–501. doi: 10.1038/nbt.1630. [DOI] [PMC free article] [PubMed] [Google Scholar]
- 41.Finucane HK, et al. Partitioning heritability by functional annotation using genome-wide association summary statistics. Nat Genet. 2015;47:1228–1235. doi: 10.1038/ng.3404. [DOI] [PMC free article] [PubMed] [Google Scholar]
- 42.Stein JL, et al. A quantitative framework to evaluate modeling of cortical development by neural stem cells. Neuron. 2014;83:69–86. doi: 10.1016/j.neuron.2014.05.035. [DOI] [PMC free article] [PubMed] [Google Scholar]
- 43.Hansen KD, Irizarry RA, Wu Z. Removing technical variability in RNA-seq data using conditional quantile normalization. Biostatistics. 2012;13:204–216. doi: 10.1093/biostatistics/kxr054. [DOI] [PMC free article] [PubMed] [Google Scholar]
- 44.Johnson WE, Li C, Rabinovic A. Adjusting batch effects in microarray expression data using empirical Bayes methods. Biostatistics. 2007;8:118–127. doi: 10.1093/biostatistics/kxj037. [DOI] [PubMed] [Google Scholar]
- 45.Oldham MC, Langfelder P, Horvath S. Network methods for describing sample relationships in genomic datasets: application to Huntington’s disease. BMC Syst Biol. 2012;6:63. doi: 10.1186/1752-0509-6-63. [DOI] [PMC free article] [PubMed] [Google Scholar]
Associated Data
This section collects any data citations, data availability statements, or supplementary materials included in this article.


