. 2017 Feb 22;6:e22341. doi: 10.7554/eLife.22341

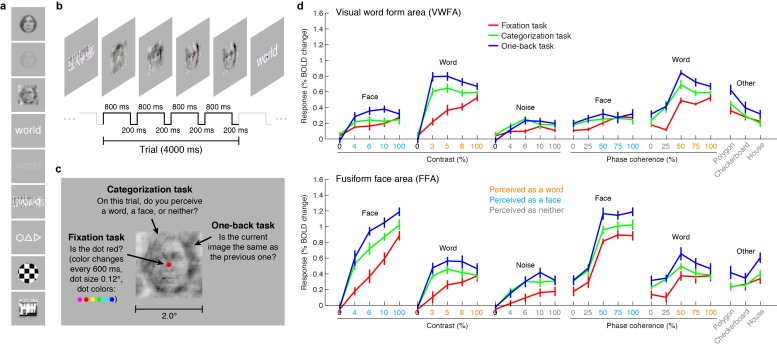
Figure 1. VTC responses depend on both stimulus properties and cognitive task.

(aStimuli. Stimuli included faces, words, and noise patterns presented at different contrasts and phase-coherence levels, as well as full-contrast polygons, checkerboards, and houses. (b) Trial design. Each trial consisted of four images drawn from the same stimulus type. (c) Tasks. On a given trial, subjects performed one of three tasks. (d) Evoked responses in VWFA (top) and FFA (bottom) for different stimuli and tasks. Color of x-axis label indicates the perceived stimulus category as reported by the subjects. Error bars indicate bootstrapped 68% CIs.

DOI: http://dx.doi.org/10.7554/eLife.22341.003

Figure 1.

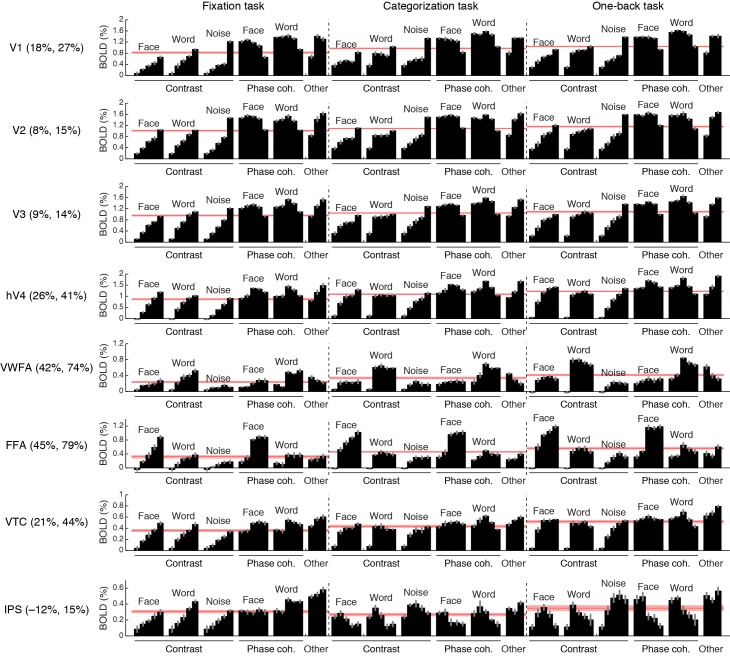
Figure 1—figure supplement 1. Comprehensive summary of fMRI measurements.

Figure 1—figure supplement 1.

Black bars indicate responses (beta weights) evoked by different stimuli and tasks. Red lines indicate the average response across stimuli, computed separately for each task. Error bars indicate bootstrapped 68% CIs (resampling subjects with replacement). Percentages in ROI labels indicate the strength of the response observed during the categorization and one-back tasks relative to the fixation task. For example, in FFA, the average response across stimuli during the one-back task is 79% stronger than the average response across stimuli during the fixation task. Task effects are substantially stronger in VWFA and FFA than in early visual areas V1–V3. The larger apparent task modulation in V1 compared to V2 and V3 might due to small eye movements that may have been made during the categorization and one-back tasks. Our interpretation of the observed IPS activity during the fixation task is that this activity reflects the decision-making process involved in judging the color of the fixation dot. Support for this interpretation comes from the fact that the root-mean-square contrast of the stimuli, computed over a small region surrounding the fixation dot (0.36° × 0.36°), correlates strongly with IPS responses during the fixation task (r = 0.86).