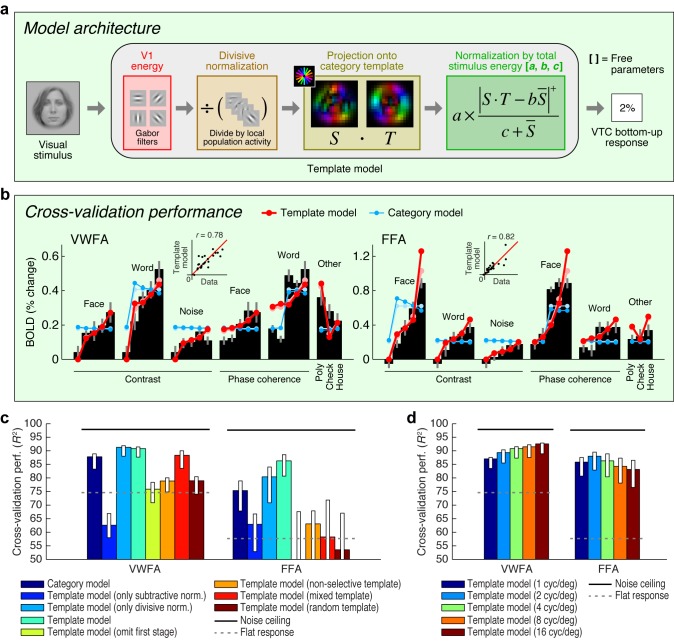
Figure 2. Model of bottom-up computations in VTC.
(a) Model architecture. The predicted response of the Template model is given by a series of image computations (see Materials and methods). (b) Cross-validation performance. Black bars indicate bottom-up stimulus-driven responses measured during the fixation task, dark lines and dark dots indicate model predictions (leave-one-stimulus-out cross-validation), and light lines and light dots indicate model fits (no cross-validation). Scatter plots in the inset compare model predictions against the data. The Template model is compared to the Category model which simply predicts a fixed response level for stimuli from the preferred stimulus category and a different response level for all other stimuli (the slight decrease in response as a function of contrast is a result of the cross-validation process). (c) Comparison of performance against control models. Bars indicate leave-one-stimulus-out cross-validation performance. Error bars indicate 68% CIs, obtained by bootstrapping (resampling subjects with replacement). Solid horizontal lines indicate the noise ceiling, that is, the maximum possible performance given measurement variability in the data. Dotted horizontal lines indicate the cross-validation performance of a model that predicts the same response level for each data point (this corresponds to R2 = 0 in the conventional definition of R2 where variance is computed relative to the mean). The performance of the Template model degrades if the second stage of nonlinearities is omitted (Template model (only subtractive normalization)) or if the first stage of the model involving V1-like filtering is omitted (Template model (omit first stage)). The plot also shows that the precise configuration of the template is important for achieving high model performance (Template model (non-selective, mixed, random templates)). (d) Performance as a function of spatial frequency tuning. Here we manipulate the spatial frequency tuning of the filters in the Template model (while fixing spatial frequency bandwidth at one octave). The Template model uses a single set of filters at a spatial frequency tuning of 4 cycles/degree.


