

Magnetization transfer imaging was used to successfully measure and longitudinally monitor the progression of renal fibrosis in mice with unilateral renal artery stenosis.
Abstract
Purpose
To test the utility of magnetization transfer imaging in detecting and monitoring the progression of renal fibrosis in mice with unilateral renal artery stenosis.
Materials and Methods
This prospective study was approved by the Institutional Animal Care and Use Committee. Renal artery stenosis surgery (n = 10) or sham surgery (n = 5) was performed, and the stenotic and contralateral kidneys were studied longitudinally in vivo at baseline and 2, 4, and 6 weeks after surgery. After a 16.4-T magnetic resonance imaging examination, magnetization transfer ratio was measured as an index of fibrosis (guided by parameters selected in preliminary phantom studies). In addition, renal volume, perfusion, blood flow, and oxygenation were assessed. Fibrosis was subsequently measured ex vivo by means of histologic analysis and hydroxyproline assay. The Wilcoxon rank sum or signed rank test was used for statistical comparisons between or within groups, and Pearson and Spearman rank correlation was used to compare fibrosis measured in vivo and ex vivo.
Results
In the stenotic kidney, the median magnetization transfer ratio showed progressive increases from baseline to 6 weeks after surgery (increases of 13.7% [P = .0006] and 21.3% [P = .0005] in cortex and medulla, respectively), which were accompanied by a progressive loss in renal volume, perfusion, blood flow, and oxygenation. The 6-week magnetization transfer ratio map showed good correlation with fibrosis measured ex vivo (Pearson r = 0.9038 and Spearman ρ = 0.8107 [P = .0002 vs trichrome staining]; r = 0.9540 and ρ = 0.8821 [P < .0001 vs Sirius red staining]; and r = 0.8429 and ρ = 0.7607 [P = .001 vs hydroxyproline assay]).
Conclusion
Magnetization transfer imaging was used successfully to measure and longitudinally monitor the progression of renal fibrosis in mice with unilateral renal artery stenosis.
© RSNA, 2016
Introduction
Renal artery stenosis (RAS) decreases renal blood flow (RBF) and causes a progressive loss of renal mass and function. The affected kidney undergoes a progressive deposition of extracellular matrix components that contain fibronectin and collagen type I, III, and IV, which may evolve into tubulointerstitial fibrosis (1,2). Renal fibrosis is an important marker in the diagnosis and evaluation of renal diseases, as well as kidney outcomes after transplantation (3,4). Currently, renal biopsy is the reference standard method for the assessment of renal fibrosis but is limited by invasiveness, possible sampling error, and intra- and interobserver variability (5).
Several magnetic resonance (MR) imaging techniques have been explored for noninvasive detection of renal fibrosis. Diffusion-weighted imaging is sensitive to changes in microstructure and is capable of demonstrating renal fibrosis (6–9) but is nonspecific and largely affected by structural and functional alterations besides fibrosis (6,7). MR elastography is used to measure the stiffness of tissues, which may be increased because of fibrosis, among other causes (10). Medullary stiffness determined with MR elastography correlated well with medullary fibrosis in swine kidneys with RAS, whereas cortical stiffness was also dependent on perfusion pressure (11,12). Therefore, there is a dire need for a noninvasive method that can be used to directly demonstrate renal fibrosis.
Magnetization transfer (MT) imaging (MTI) can be used to evaluate the presence of macromolecules, such as proteins, lipids, carbohydrates, and nucleic acids in tissues (13,14). MTI has been applied to detect microstructural disruptions in the brain (15,16), lungs (17), and intestines (18–20), as well as rectal cancer (21). Recently, MTI was applied for the evaluation of nephropathy, including unilateral ureteral obstruction (22) and polycystic kidney disease (23). However, the utility of MTI for the detection of renal fibrosis cannot be evaluated easily in these two models because of concomitant accumulation of fluids, which is unlikely to be present in RAS. A previous study showed the promise of MT-weighted imaging with empirically chosen parameters in detecting fibrotic tissues in mice with RAS (24). However, its ability in monitoring the progression of fibrosis in RAS longitudinally was not evaluated. In addition, the suitable MT parameters remain to be determined and refined.
Therefore, in our study, we aimed to test the utility of MTI in noninvasively detecting and monitoring the progression of renal fibrosis in mice with unilateral RAS. We sought to determine appropriate MT parameters for fibrosis detection and hypothesized that in vivo MT findings would correlate with both ex vivo measurement of collagen content and a decrease in renal hemodynamics and oxygenation.
Materials and Methods
Animals
This prospective study was approved by the Institutional Animal Care and Use Committee. Fifteen male 129S1 mice were used. At the age of 10 weeks, all mice underwent baseline MR imaging (K.J. and C.M.F., with 6 and 3 years of experience in small-animal MR imaging, respectively), after which they were selected for RAS (n = 10) or sham (n = 5) surgeries (see Appendix E1 [online]) by an experienced technologist (H.T., with 24 years of experience). To longitudinally monitor progression of fibrosis, follow-up MR imaging was performed (K.J. and C.M.F.) 2, 4, and 6 weeks after surgery, at intervals shown to induce progressive renal injury (25). Animals were weighed, and blood pressure was measured (H.T.) after MR imaging by using a tail cuff (XBP1000 system; Kent Scientific, Torrington, Conn).
MT Parameters
MR imaging studies were performed with a vertical 16.4-T imaging unit equipped with a birdcage coil with an inner diameter of 38 mm (Bruker Biospin, Billerica, Mass). In the MT study, a fast low-angle shot sequence was used. Fast low-angle shot images without MT (M0) were acquired with the following parameters: repetition time (msec)/echo time (msec), 400/2.9; flip angle, 20°; section thickness, 1 mm; number of sections acquired, five; field of view, 3.0 × 3.0 cm; matrix size, 128 × 128; and number of signals acquired, four. Then, MT-weighted images (Mt) were acquired by adding Gaussian MT pulses before fast low-angle shot acquisition.
A robust set of parameters for MT pulses is necessary for effective saturation of collagen without inducing substantial radiofrequency heating. Irradiation offset frequency, which determines the sensitivity of MT saturation, was first determined in a phantom that contained collagen types I and III (NeoCell, Newport Beach, Calif) at 20%, 10%, 5%, and 0% concentrations (Fig 1) (K.J.). To achieve good saturation of collagen molecules, a range of irradiation offset frequencies (−6000 to 6000 Hz) and additional MT parameters (including pulse power, bandwidth, flip angle, and pulse number) were tested, and those judged to yield a high contrast-to-noise ratio were selected for in vivo confirmation.
Figure 1a:

Collagen phantom study. (a) The M0 image (left), Mt image (middle), and MTR map (right) with offset frequency of 1500 Hz and bandwidth of 300 Hz are shown for different concentrations of collagen. (b) Graph shows changes in MTR with offset frequency.
In Vivo MR Imaging
Renal volume, perfusion, and blood flow were measured in both stenotic and contralateral kidneys of anesthetized mice (Appendix E1 [online]).
In the MT examination, the field of view and acquisition matrix were prescribed at 2.56 × 2.56 cm and 256 × 256, yielding an in-plane resolution of 100 × 100 μm. To achieve desirable signal-to-noise ratio, eight averages were used. The following MT parameters, determined from the phantom and preliminary in vivo experiments, were used: offset frequency, 1500 Hz; pulse bandwidth, 300 Hz; pulse power, 10 μT; flip angle, 585°; and number of pulses, two.
Renal oxygenation was assessed with blood oxygen level–dependent (BOLD) MR imaging by using a respiration-gated three-dimensional multiecho gradient-echo sequence to eliminate external field inhomogeneities and susceptibility artifacts (26). The imaging parameters used were 200/3.5–24.5; number of echoes, eight; flip angle, 25°; slab thickness, 1 mm; field of view, 2.56 × 2.56 cm; matrix size, 128 × 128 × 8; and number of signals acquired, two.
Image Analysis
Renal volumes were quantified (T.A.B., with 2 years of experience) by using Analyze software (version 12.0; Biomedical Imaging Resource, Mayo Clinic, Minn), and all other images were quantified by using a module developed in-house in Matlab (The MathWorks, Natick, Mass) (K.J.). The quantification of renal volume, perfusion, and blood flow are described in Appendix E1 (online).
The MT ratio (MTR), calculated pixelwise as (M0 − Mt)/M0, was used as an index of renal fibrosis. To calculate the averaged MTR, cortical and medullary regions of interest (ROIs) were manually traced by two experienced observers (K.J. and C.M.F.) on the Mt image that showed the best contrast between cortex and medulla with reference to the M0 image and MTR map (Fig 2a). Large vessels, pelvis, and necrotic areas were excluded. The same ROIs were propagated and applied for quantification of blood oxygenation, perfusion, and blood flow. Mean values from all ROIs from different sections were averaged.
Figure 2a:

Renal fibrosis in mice according to in vivo MT and ex vivo histologic findings or hydroxyproline assay. (a) Fast low-angle shot MR images obtained without MT pulses (M0, left), MT-weighted fast low-angle shot image (M t ) overlaid with the manually traced ROIs in the cortex and medulla (middle), and calculated MTR maps of both the stenotic and contralateral kidneys overlapped with the M0 image (right) are shown. (b) Representative photomicrographs (original magnification, ×10) are shown for trichrome staining (left) and Sirius red staining viewed under polarized light (middle), with the corresponding MTR map (right) of a stenotic kidney at 6 weeks of RAS. Increasing levels of fibrosis are indicated by the intensifying yellow and the appearance of red coloring. Areas that represent fibrosis, necrosis, and pelvis are marked by red, black, and white arrows, respectively. (c) Plots show the Spearman rank correlation of fibrosis quantified from ex vivo trichrome staining (left), Sirius red staining (middle), and hydroxyproline assay (right), with in vivo MTR. All ROIs from different sections were used to calculate the averaged MTR in vivo and for all histologic slices used for quantification of fibrosis ex vivo.
For BOLD imaging, eight images were reconstructed after zero-filling the k-space data to 256 × 256. T2* was quantified by means of pixelwise monoexponential fitting on the averaged magnitude of all eight images over echo times. R2* (1/T2*) was used as an index of blood oxygenation level.
Histologic Analysis
Mice were euthanized after the 6-week MR imaging examination. Kidneys, blood, and urine samples were collected. One-half of each kidney was fixed in 10% formalin for tissue staining, and the other half was flash-frozen. Masson trichrome and Sirius red staining was performed on 5-μm axial tissue slices that corresponded to MR tomographic sections (H.T.). The degree of fibrosis was quantified as the fraction of fibrotic area over the total cross-sectional area of the tissue by using AxioVision (Carl Zeiss SMT, Oberkochen, Germany).
Blood Test and Hydroxyproline Assay
Refer to Appendix E1 (online) for details.
Statistical Analysis
Statistical analysis was performed by using JMP software version 10.0 (SAS Institute, Cary, NC). All results were expressed as medians and interquartile ranges (IQRs). Box plots illustrate the medians and ranges of values. Owing to our relatively small sample size, nonparametric distribution-free statistical analysis was used. The Kruskal-Wallis test was used to assess differences among multiple groups and time points, including comparisons of all values obtained from the sham (n = 5) and RAS (n = 10) mice at baseline and 2, 4, and 6 weeks after surgery. This was followed by use of the Wilcoxon rank sum test (sham [n = 5] vs stenotic [n = 10] and contralateral [n = 10] kidneys) or signed rank test (paired comparisons between baseline and 2, 4, and 6 weeks after surgery) for statistical comparisons between or within groups, as appropriate. Both Pearson and Spearman rank correlations were used to compare fibrosis measured in vivo and ex vivo. For the 6-week studies, in which RAS kidneys showed the most MTR heterogeneities, interobserver reproducibility was evaluated from the difference in MTR values quantified by two independent operators for ROIs selected manually and independently. A P value up to .05 was considered to indicate a statistically significant difference.
Results
MT Parameter Selection
Representative M0 and Mt images and the MTR map of the collagen phantom with offset of 1500 Hz and bandwidth of 300 Hz are shown in Figure 1a, and MTR values obtained at various offset frequencies are shown in Figure 1b. An offset approaching zero resulted in a higher MT saturation but also in stronger direct saturation of free water signal, inducing artifacts on Mt images and complicating interpretation. An offset frequency at 1500 Hz was identified to achieve a high saturation of collagen magnetization with minimal direct saturation of free water signal. With the MT pulse power empirically set at 10 μT, which resulted in a flip angle of 585°, the MTR maps with one to three pulses were tested in vivo. The use of two pulses yielded the most acceptable MTR map for fibrosis detection (Fig E1 [online]). Thus, the parameters of Gaussian MT pulses were set as offset frequency, 1500 Hz; bandwidth, 300 Hz; pulse power, 10 μT; flip angle, 585°; and number of pulses, two.
Figure 1b:

Collagen phantom study. (a) The M0 image (left), Mt image (middle), and MTR map (right) with offset frequency of 1500 Hz and bandwidth of 300 Hz are shown for different concentrations of collagen. (b) Graph shows changes in MTR with offset frequency.
Animal Characteristics
The animal characteristics and renal hemodynamic indexes are shown in the Table. The body weight of both groups increased from baseline to 6 weeks, but the weight gain was attenuated in RAS mice, possibly due to the surgery and hypertension. Renovascular hypertension in RAS mice was demonstrated by the increased systolic and diastolic blood pressure, which remained unchanged in the control mice. The median serum creatinine and blood urea nitrogen levels in RAS mice were significantly increased when compared with the sham group (0.15 mg/dL [13.26 μmol/L] [IQR, 0.13–0.21 mg/dL {11.49–18.56 μmol/L}] vs 0.09 mg/dL [7.96 μmol/L] [IQR, 0.03–0.12 mg/dL {2.65–10.61 μmol/L}] [P = .0109] and 27.9 mg/dL [9.96 mmol/L] [IQR, 26.8–30.6 mg/dL {9.57–10.9 mmol/L}] vs 22.0 mg/dL [7.85 mmol/L] [IQR, 21.1–23.0 mg/dL {7.53–8.21 mmol/L}] [P = .004], respectively) 6 weeks after surgery, which confirms that RAS was functionally consequential and evoked loss of renal function.
Animal Characteristics and Renal Hemodynamic Indices
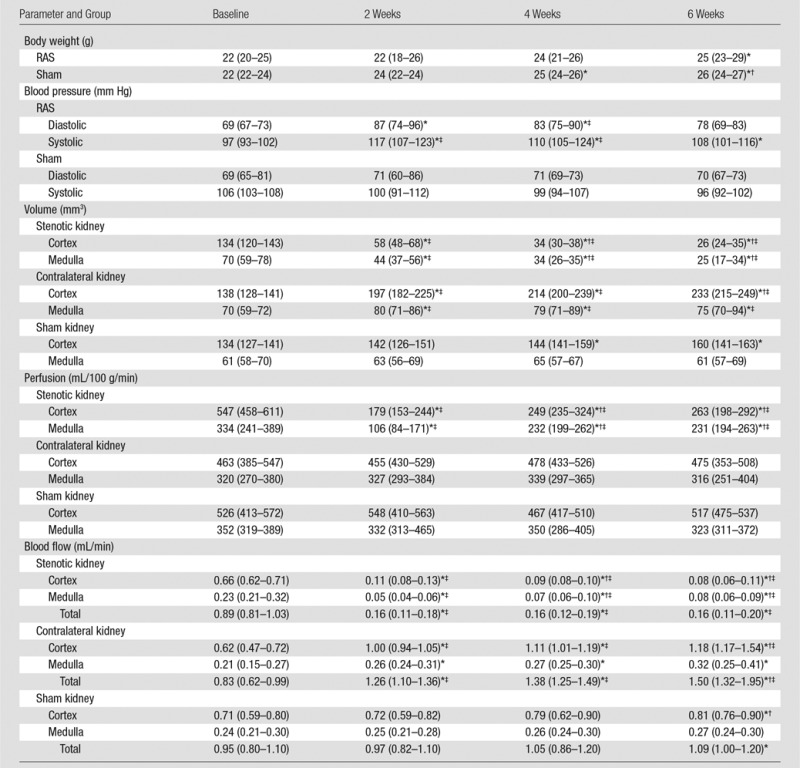
Note.—Data are medians, with IQRs in parentheses.
*P < .05 compared with baseline.
†P < .05 compared with 2 weeks.
‡P < .05 compared with sham.
Renal Hemodynamics
Renal volume.—Stenotic kidney cortical and medullary volumes showed progressive decrease after RAS surgery (Table). After 6 weeks of RAS, the cortex and medulla retained only 19.4% (from 134 mm3 [IQR, 120–143 mm3] to 26 mm3 [IQR, 24–35 mm3], P = .0044) and 35.7% (from 70 mm3 [IQR, 59–78 mm3] to 25 mm3 [IQR, 17–34 mm3], P = .0045) of their baseline volumes, respectively. In contrast, the volume of the contralateral kidney cortex and medulla increased. In control mice, a small increase was observed in cortical volume by 6 weeks, and no increase was observed in medullary volume (Table).
Renal perfusion.—In the stenotic kidney, cortical perfusion decreased 2 weeks after surgery when compared with baseline and recovered slightly thereafter. Similarly, medullary perfusion decreased dramatically at 2 weeks and subsequently recovered slightly but remained lower when compared with baseline (Table). No change was detected in the contralateral and sham kidneys throughout the study.
RBF findings.—In the stenotic kidney, cortical blood flow decreased markedly 2 weeks after surgery, while after an initial dramatic decrease at 2 weeks, medullary blood flow recovered slightly (Table). From baseline to 2 weeks, the median RBF in the whole stenotic kidney decreased by about 82.0% (from 0.89 mL/min [IQR, 0.81–1.03 mL/min] to 0.16 mL/min [IQR, 0.11–0.18 mL/min], P < .0001) and then stabilized. The decreases in RBF suggested 90%–95% RAS (27). While perfusion remained unchanged, contralateral kidney RBF at 6 weeks increased by 80.7% (from 0.83 mL/min [IQR, 0.62–0.99 mL/min] to 1.50 mL/min [IQR, 1.32–1.95 mL/min], P = .0033), due to the increase in renal volume. In contrast, sham kidney RBF at 6 weeks increased only slightly.
Renal Fibrosis
Renal fibrosis in vivo and ex vivo.—By using the selected imaging parameters, the mouse body temperature remained unchanged during MT imaging (data not shown), and discernible contrast between the fibrotic and normal tissue was achieved. The MTR in the stenotic kidney appreciably increased when compared with the contralateral kidney (Fig 2), which suggests excessive collagen deposition, especially in the outer medulla.
Good agreement between ex vivo staining and in vivo MT imaging was observed in regions of fibrosis and edema at 2 weeks, as well as in regions of fibrosis, necrosis, and the collecting system at 6 weeks (Fig 2b, Fig E2 [online]). Good correlation was observed between MTR and fibrosis quantified from corresponding trichrome-stained slices (Pearson r = 0.9038, Spearman ρ = 0.8107 [P = .0002]) and Sirius red–stained slices (r = 0.9504, ρ = 0.8821 [P < .0001]) (Fig 2c). Exclusion of sham kidneys from the correlation analysis decreased the association of MTR with trichrome staining (r = 0.6855, ρ = 0.3939 [P = .2600]) but not Sirius red staining (r = 0.9069, ρ = 0.9152 [P = .0002]).
Figure 2b:

Renal fibrosis in mice according to in vivo MT and ex vivo histologic findings or hydroxyproline assay. (a) Fast low-angle shot MR images obtained without MT pulses (M0, left), MT-weighted fast low-angle shot image (M t ) overlaid with the manually traced ROIs in the cortex and medulla (middle), and calculated MTR maps of both the stenotic and contralateral kidneys overlapped with the M0 image (right) are shown. (b) Representative photomicrographs (original magnification, ×10) are shown for trichrome staining (left) and Sirius red staining viewed under polarized light (middle), with the corresponding MTR map (right) of a stenotic kidney at 6 weeks of RAS. Increasing levels of fibrosis are indicated by the intensifying yellow and the appearance of red coloring. Areas that represent fibrosis, necrosis, and pelvis are marked by red, black, and white arrows, respectively. (c) Plots show the Spearman rank correlation of fibrosis quantified from ex vivo trichrome staining (left), Sirius red staining (middle), and hydroxyproline assay (right), with in vivo MTR. All ROIs from different sections were used to calculate the averaged MTR in vivo and for all histologic slices used for quantification of fibrosis ex vivo.
Figure 2c:

Renal fibrosis in mice according to in vivo MT and ex vivo histologic findings or hydroxyproline assay. (a) Fast low-angle shot MR images obtained without MT pulses (M0, left), MT-weighted fast low-angle shot image (M t ) overlaid with the manually traced ROIs in the cortex and medulla (middle), and calculated MTR maps of both the stenotic and contralateral kidneys overlapped with the M0 image (right) are shown. (b) Representative photomicrographs (original magnification, ×10) are shown for trichrome staining (left) and Sirius red staining viewed under polarized light (middle), with the corresponding MTR map (right) of a stenotic kidney at 6 weeks of RAS. Increasing levels of fibrosis are indicated by the intensifying yellow and the appearance of red coloring. Areas that represent fibrosis, necrosis, and pelvis are marked by red, black, and white arrows, respectively. (c) Plots show the Spearman rank correlation of fibrosis quantified from ex vivo trichrome staining (left), Sirius red staining (middle), and hydroxyproline assay (right), with in vivo MTR. All ROIs from different sections were used to calculate the averaged MTR in vivo and for all histologic slices used for quantification of fibrosis ex vivo.
A significant increase in the hydroxyproline content was also observed in the stenotic kidneys compared with sham kidneys (24.73 mg/mL [IQR, 22.05–47.50 mg/mL] vs 132.94 mg/mL [IQR, 118.23–202.04 mg/mL], respectively; P < .0001), which correlated well (r = 8429, ρ = 0.7607 [P = .001]) with MTR (Fig 2c). Exclusion of sham kidneys abolished this association (r = 0.5438, ρ = 0.3091 [P = .3848]).
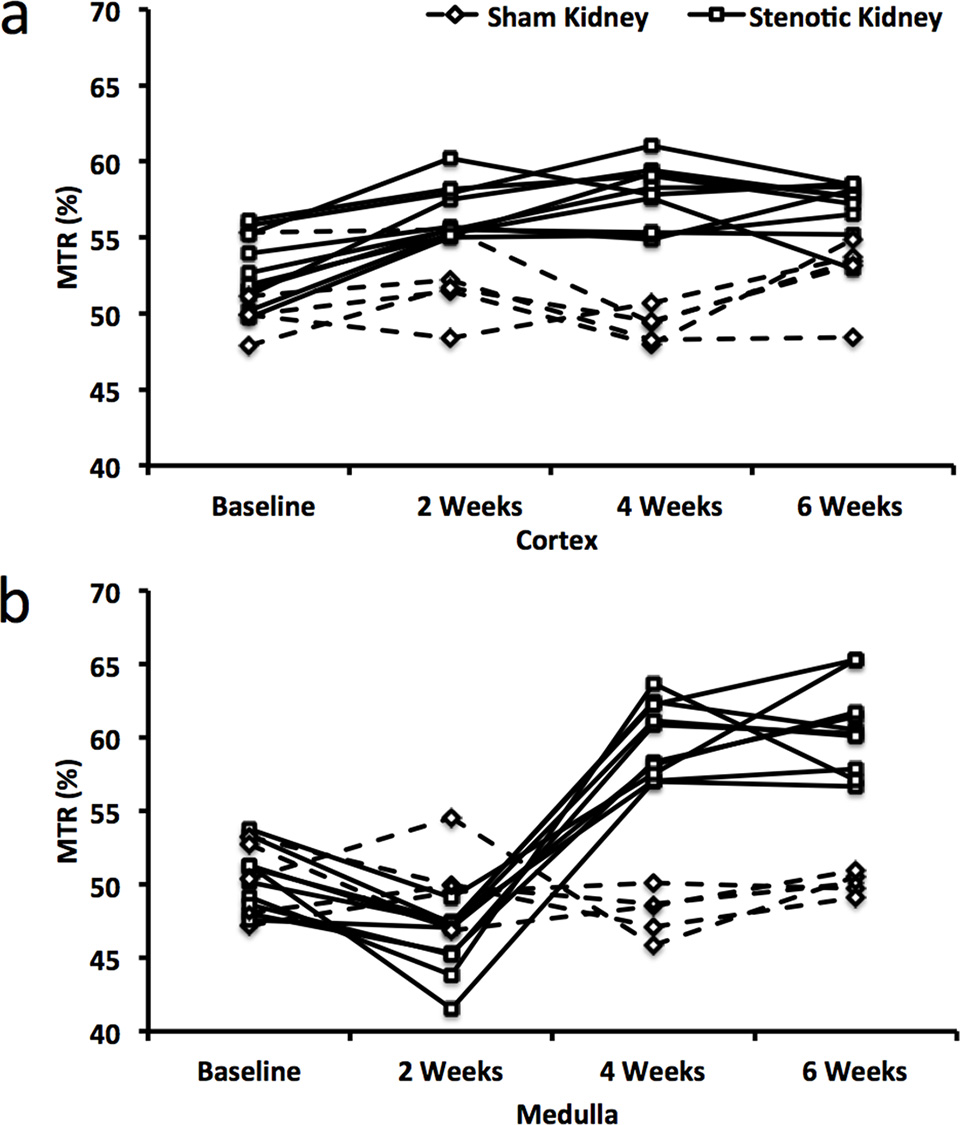
Longitudinal progression of renal fibrosis.—The median MTR in the poststenotic cortex increased markedly from baseline to 2 weeks and then stabilized (Fig 3, D; Fig E3a; Table E1 [online]). Contrarily, medullary MTR initially decreased slightly but subsequently increased dramatically. Both low and high MTR values were particularly apparent at 6 weeks at the corticomedullary boundary (Fig 3, A). In the contralateral kidney, MTR at 6 weeks showed a slight decrease in cortex and medulla, whereas in kidneys that underwent sham surgeries, it remained unchanged (Fig 3, C and D; Fig E3; Table E1 [online]).
Figure 3:

In vivo monitoring of renal fibrosis development in mice with MT. Representative MTR maps of the, A, stenotic, B, contralateral, and, C, sham kidney are shown at baseline and 2, 4, and 6 weeks after surgery. Areas that represent fibrosis, necrosis, and edema and/or inflammation are marked by red, black, and white arrows, respectively. D, Box and whisker plots show MTR quantified in the cortex and medulla of all groups. * = P < .05 compared with baseline, $ = P < .05 compared with observations at 2 weeks, † = P < .05 compared with sham.
Interobserver bias and variation in cortical and medullary MTR quantification were minimal (<3%, Table E3 [online]), which demonstrated good reproducibility of MTR calculation and ROI selection.
Renal oxygenation.—A progressive increase in cortical R2* was detected by 6 weeks of RAS (Fig 4, Table E2 [online]), which indicated evolving hypoxia, whereas medullary R2* initially transiently decreased, followed by a dramatic increase. Areas of increased R2* agreed well with corresponding areas with increased MTR values (Fig 3) yet seemed more extensive. A few areas with extremely low values were observed at the corticomedullary junction on 6-week R2* and MTR maps. No changes were observed in cortex and medullary R2* in kidneys that underwent sham surgeries or contralateral kidneys.
Figure 4:

In vivo assessment of renal oxygenation in the stenotic, contralateral, and sham kidneys of mice according to BOLD MR imaging. A, Representative R2* maps are shown for a stenotic kidney at baseline and 2, 4, and 6 weeks after induction of RAS. Increasing levels of hypoxia are indicated by the intensifying yellow and red colors. Areas that represent fibrosis, possibly necrosis, and fluid (collecting system or edema) are marked by red, black, and white arrows, respectively. B, Box and whisker plots show R2* quantified in the cortex and medulla of all groups. * = P < .05 compared with baseline, $ = P < .05 compared with observations at 2 weeks, † = P < .05 compared with sham.
Discussion
Our study shows that MTI is capable of demonstrating renal fibrosis in RAS. After selecting the MT parameters suitable for collagen saturation at 16.4 T, we demonstrated the feasibility of using MTI to longitudinally measure and monitor the progression of renal fibrosis in a mouse model of unilateral RAS. The fibrosis measured ex vivo by means of histologic analysis and the hydroxyproline assay showed good correlation with in vivo MTR.
Selection of the irradiation offset frequency is of utmost importance in MTI. With a large flip angle, MT pulses may induce radiofrequency heating, especially at high field strengths (28). A high offset frequency necessitates a larger flip angle to maintain MT contrast-to-noise ratio, but when too low, direct saturation of free water signal causes imaging artifacts. We identified an offset frequency at 1500 Hz (approximately 2.14 parts per million downfield from water) with pulse bandwidth at 300 Hz, which yielded desirable collagen saturation with negligible perturbation on free water signal. With offset frequency and bandwidth fixed, other MT parameters, such as pulse power and number, were determined to achieve a desirable MT contrast-to-noise ratio in vivo. Notably, MT imaging parameters selected at an ultra-high field strength (16.4 T) may be different for clinical imaging units at 1.5 or 3 T; further studies are needed to evaluate the appropriate MT parameters for measurement of renal fibrosis by using those imaging units.
The good correlation between in vivo MTR and ex vivo histologic findings further supports the notion that MTI provides reliable measurements of renal fibrosis. Both trichrome and Sirius red staining demonstrated good correlation with the MTR map. However, excluding the sham group demonstrated more modest correlations, mainly owing to the limited range of fibrosis among affected RAS kidneys. Nevertheless, MTR remained well correlated with Sirius red staining, which also correlates with renal function better than trichrome staining (4). Notably, appreciable heterogeneity was evident with both histologic findings and MTR maps, possibly because of inhomogeneous distribution of extracellular matrix.
RAS dramatically decreased stenotic kidney perfusion, evidenced by arterial spin labeling. While not the reference standard for quantification of RBF, this method provides an index of differences in perfusion among experimental groups and time points. The longitudinal MT study then demonstrated the progression of fibrosis over 6 weeks. While the renal cortex showed a progressive increase in MTR, a slight decrease in MTR, as well as R2* in BOLD MR imaging, was observed at the cortical-medullary junction at 2 weeks. This might be attributed to development of edema secondary to inflammation and increased vascular permeability at the early stage of renal injury (29), particularly in the outer medulla (30). Subsequently, chronic inflammation promotes collagen deposition, evidenced by the marked increase in MTR 4 and 6 weeks after surgery. In contrast, the contralateral kidney showed a slight decrease in MTR starting at 4 weeks, possibly due to increased water content because of hyperfiltration. Indeed, the contralateral kidney showed a marked increase in RBF, which likely diluted the macromolecule pool and resulted in a slight decrease in MTR. However, these data should be interpreted with caution, because according to their longitudinal nature, samples at different time points are partially interdependent.
We also had an opportunity to compare changes in MTI and BOLD MR images during the evolution of ischemic injury. Unlike MTI, which demonstrates renal fibrosis, BOLD MR imaging shows tissue hypoxia. Indeed, regions with excessive collagen deposition on MTR maps also exhibited hypoxia on R2* maps. Interestingly, regions with hypoxia were evident earlier and were more extensive than renal fibrosis, which suggests that renal hypoxia precedes fibrosis in RAS. Therefore, BOLD MR imaging can provide information complementary to that of MTI in the evaluation of renal diseases.
There are several limitations to our study. First, although MTI allowed successful delineation of renal fibrosis in the cortex and outer medulla, collagen deposition in the inner medulla was less obvious, presumably because the abundant free water molecules in the inner medullary collecting system reduced apparent MTR values in vivo. Second, factors other than fibrosis, such as reduced renal perfusion, might slightly enhance the observed increase in MTR. Nevertheless, MTR values showed good correlation with independent assessment of renal fibrosis. Further studies are needed to investigate the influence of these factors and additional extracellular matrix protein components on MT. Additional studies are also needed to determine whether hypoxic but nonfibrotic regions represent zones of more readily reversible renal injury. Moreover, despite good agreement between in vivo MTR maps and ex vivo histologic findings, some regional discrepancy might be caused by the thicker MR sections when compared with histologic slices (1 mm vs 5 μm, respectively) and the slight mismatch in coregistration.
In conclusion, MT was used to successfully measure and longitudinally monitor the progression of renal fibrosis in mice with unilateral RAS. Its reproducibility and ability in demonstrating and monitoring renal fibrosis may provide a valuable tool for diagnosis, planning, and evaluation of therapeutic strategies for renal diseases in clinical trials. The pulse sequence used in our study is also widely available and readily implemented on clinical MR imaging units. The diagnosis of other renal diseases with renal fibrosis as a biomarker, such as diabetic nephropathy (31), may also benefit from this technique.
Advances in Knowledge
■ The median cortical and medullary magnetization transfer (MT) ratio in the poststenotic kidney increased by 13.7% (P = .0006) and 21.3% (P = .0005), respectively, 6 weeks after induction of renal artery stenosis.
■ Renal fibrosis assessed with in vivo MT imaging (MTI) and ex vivo methods showed good correlation (Pearson r = 0.9038 and Spearman ρ = 0.8107 [P = .0002 vs trichrome staining]; r = 0.9540 and ρ = 0.8821 [P < .0001 vs Sirius red staining]; r = 0.8429 and ρ = 0.7607 [P = .001 vs hydroxyproline assay]), which suggests that MTI may provide a valuable tool for noninvasive measurement of renal fibrosis.
Implications for Patient Care
■ The ability of MTI to demonstrate renal fibrosis may aid in diagnosing renal diseases and planning therapeutic interventions.
■ The ability of MTI in monitoring the dynamic progression of renal fibrosis may help in the evaluation of new therapeutic methods for treatment of renal diseases.
APPENDIX
SUPPLEMENTAL FIGURES
Received March 7, 2016; revision requested April 25; revision received July 5; accepted July 27; final version accepted August 11.
Supported by the National Heart, Lung, and Blood Institute (HL123160), the National Institute of Diabetes and Digestive and Kidney Diseases (DK102325, DK104273, DK73608), and the National Institute of Allergy and Infectious Diseases (AI-100911).
Disclosures of Conflicts of Interest: K.J. disclosed no relevant relationships. C.M.F. disclosed no relevant relationships. B.E. disclosed no relevant relationships. H.T. disclosed no relevant relationships. T.L.K. disclosed no relevant relationships. T.A.B. disclosed no relevant relationships. P.K.M. disclosed no relevant relationships. J.P.G. disclosed no relevant relationships. S.I.M. disclosed no relevant relationships. L.O.L. Activities related to the present article: disclosed no relevant relationships. Activities not related to the present article: author received grants from AstraZeneca and Stealth; author received personal fees from Novartis. Other relationships: disclosed no relevant relationships.
Abbreviations:
- BOLD
- blood oxygen level–dependent
- IQR
- interquartile range
- MT
- magnetization transfer
- MTI
- MT imaging
- MTR
- MT ratio
- RAS
- renal artery stenosis
- RBF
- renal blood flow
- ROI
- region of interest
References
- 1.Conway B, Hughes J. Cellular orchestrators of renal fibrosis. QJM 2012;105(7):611–615. [DOI] [PubMed] [Google Scholar]
- 2.Liu Y. Cellular and molecular mechanisms of renal fibrosis. Nat Rev Nephrol 2011;7(12):684–696. [DOI] [PMC free article] [PubMed] [Google Scholar]
- 3.Miettinen J, Helin H, Pakarinen M, Jalanko H, Lauronen J. Histopathology and biomarkers in prediction of renal function in children after kidney transplantation. Transpl Immunol 2014;31(2):105–111. [DOI] [PubMed] [Google Scholar]
- 4.Farris AB, Adams CD, Brousaides N, et al. Morphometric and visual evaluation of fibrosis in renal biopsies. J Am Soc Nephrol 2011;22(1):176–186. [DOI] [PMC free article] [PubMed] [Google Scholar]
- 5.Hogan JJ, Mocanu M, Berns JS. The native kidney biopsy: update and evidence for best practice. Clin J Am Soc Nephrol 2016;11(2):354–362. [DOI] [PMC free article] [PubMed] [Google Scholar]
- 6.Ebrahimi B, Rihal N, Woollard JR, Krier JD, Eirin A, Lerman LO. Assessment of renal artery stenosis using intravoxel incoherent motion diffusion-weighted magnetic resonance imaging analysis. Invest Radiol 2014;49(10):640–646. [DOI] [PMC free article] [PubMed] [Google Scholar]
- 7.Eisenberger U, Binser T, Thoeny HC, Boesch C, Frey FJ, Vermathen P. Living renal allograft transplantation: diffusion-weighted MR imaging in longitudinal follow-up of the donated and the remaining kidney. Radiology 2014;270(3):800–808. [DOI] [PubMed] [Google Scholar]
- 8.Takahashi T, Wang F, Quarles CC. Current MRI techniques for the assessment of renal disease. Curr Opin Nephrol Hypertens 2015;24(3):217–223. [DOI] [PMC free article] [PubMed] [Google Scholar]
- 9.Ebrahimi B, Textor SC, Lerman LO. Renal relevant radiology: renal functional magnetic resonance imaging. Clin J Am Soc Nephrol 2014;9(2):395–405. [DOI] [PMC free article] [PubMed] [Google Scholar]
- 10.Muthupillai R, Lomas DJ, Rossman PJ, Greenleaf JF, Manduca A, Ehman RL. Magnetic resonance elastography by direct visualization of propagating acoustic strain waves. Science 1995;269(5232):1854–1857. [DOI] [PubMed] [Google Scholar]
- 11.Warner L, Yin M, Glaser KJ, et al. Noninvasive in vivo assessment of renal tissue elasticity during graded renal ischemia using MR elastography. Invest Radiol 2011;46(8):509–514. [DOI] [PMC free article] [PubMed] [Google Scholar]
- 12.Korsmo MJ, Ebrahimi B, Eirin A, et al. Magnetic resonance elastography noninvasively detects in vivo renal medullary fibrosis secondary to swine renal artery stenosis. Invest Radiol 2013;48(2):61–68. [DOI] [PMC free article] [PubMed] [Google Scholar]
- 13.Wolff SD, Balaban RS. Magnetization transfer imaging: practical aspects and clinical applications. Radiology 1994;192(3):593–599. [DOI] [PubMed] [Google Scholar]
- 14.Henkelman RM, Stanisz GJ, Graham SJ. Magnetization transfer in MRI: a review. NMR Biomed 2001;14(2):57–64. [DOI] [PubMed] [Google Scholar]
- 15.Dousset V, Grossman RI, Ramer KN, et al. Experimental allergic encephalomyelitis and multiple sclerosis: lesion characterization with magnetization transfer imaging. Radiology 1992;182(2):483–491. [DOI] [PubMed] [Google Scholar]
- 16.Ge Y, Grossman RI, Udupa JK, Babb JS, Kolson DL, McGowan JC. Magnetization transfer ratio histogram analysis of gray matter in relapsing-remitting multiple sclerosis. AJNR Am J Neuroradiol 2001;22(3):470–475. [PMC free article] [PubMed] [Google Scholar]
- 17.Kuzo RS, Kormano MJ, Lipton MJ. Magnetization transfer magnetic resonance imaging of parenchymal lung disease. Invest Radiol 1995;30(2):118–122. [DOI] [PubMed] [Google Scholar]
- 18.Adler J, Swanson SD, Schmiedlin-Ren P, et al. Magnetization transfer helps detect intestinal fibrosis in an animal model of Crohn disease. Radiology 2011;259(1):127–135. [DOI] [PMC free article] [PubMed] [Google Scholar]
- 19.Pazahr S, Blume I, Frei P, et al. Magnetization transfer for the assessment of bowel fibrosis in patients with Crohn’s disease: initial experience. MAGMA 2013;26(3):291–301. [DOI] [PubMed] [Google Scholar]
- 20.Dillman JR, Swanson SD, Johnson LA, et al. Comparison of noncontrast MRI magnetization transfer and T2-weighted signal intensity ratios for detection of bowel wall fibrosis in a Crohn’s disease animal model. J Magn Reson Imaging 2015;42(3):801–810. [DOI] [PubMed] [Google Scholar]
- 21.Martens MH, Lambregts DM, Papanikolaou N, et al. Magnetization transfer ratio: a potential biomarker for the assessment of postradiation fibrosis in patients with rectal cancer. Invest Radiol 2014;49(1):29–34. [DOI] [PubMed] [Google Scholar]
- 22.Wang F, Jiang R, Takahashi K, et al. Longitudinal assessment of mouse renal injury using high-resolution anatomic and magnetization transfer MR imaging. Magn Reson Imaging 2014;32(9):1125–1132. [DOI] [PMC free article] [PubMed] [Google Scholar]
- 23.Kline TL, Irazabal MV, Ebrahimi B, et al. Utilizing magnetization transfer imaging to investigate tissue remodeling in a murine model of autosomal dominant polycystic kidney disease. Magn Reson Med 2016;75(4):1466–1473. [DOI] [PMC free article] [PubMed] [Google Scholar]
- 24.Ebrahimi B, Macura SI, Knudsen BE, Grande JP, Lerman LO. Fibrosis detection in renal artery stenosis mouse model using magnetization transfer MRI. In: Weaver JB, Molthen RC, eds. Proceedings of SPIE: medical imaging 2013—biomedical applications in molecular, structural, and functional imaging. Vol 8672. Bellingham, Wash: International Society for Optics and Photonics, 2013; 867205. [Google Scholar]
- 25.Hartono SP, Knudsen BE, Lerman LO, Textor SC, Grande JP. Combined effect of hyperfiltration and renin angiotensin system activation on development of chronic kidney disease in diabetic db/db mice. BMC Nephrol 2014;15:58. [DOI] [PMC free article] [PubMed] [Google Scholar]
- 26.Ebrahimi B, Crane JA, Knudsen BE, Macura SI, Grande JP, Lerman LO. Evolution of cardiac and renal impairment detected by high-field cardiovascular magnetic resonance in mice with renal artery stenosis. J Cardiovasc Magn Reson 2013;15:98. [DOI] [PMC free article] [PubMed] [Google Scholar]
- 27.Rognant N, Rouvière O, Janier M, et al. Hemodynamic responses to acute and gradual renal artery stenosis in pigs. Am J Hypertens 2010;23(11):1216–1219. [DOI] [PubMed] [Google Scholar]
- 28.Bernstein MA, Huston J, 3rd, Ward HA. Imaging artifacts at 3.0T. J Magn Reson Imaging 2006;24(4):735–746. [DOI] [PubMed] [Google Scholar]
- 29.Sutton TA, Fisher CJ, Molitoris BA. Microvascular endothelial injury and dysfunction during ischemic acute renal failure. Kidney Int 2002;62(5):1539–1549. [DOI] [PubMed] [Google Scholar]
- 30.Chade AR, Zhu XY, Grande JP, Krier JD, Lerman A, Lerman LO. Simvastatin abates development of renal fibrosis in experimental renovascular disease. J Hypertens 2008;26(8):1651–1660. [DOI] [PubMed] [Google Scholar]
- 31.Fernandez-Fernandez B, Ortiz A, Gomez-Guerrero C, Egido J. Therapeutic approaches to diabetic nephropathy—beyond the RAS. Nat Rev Nephrol 2014;10(6):325–346. [DOI] [PubMed] [Google Scholar]
Associated Data
This section collects any data citations, data availability statements, or supplementary materials included in this article.