

Abstract
Objective
This study evaluated the effects of two grading zirconia techniques on the fatigue limit of 3-unit fixed dental prostheses (FDPs).
Methods
Presintered blocks of 3Y-TZP were milled to obtain sixty-nine 3-unit FDPs, which were divided into three groups (n = 23). The control group (CTL) was sintered and glazed following manufacturer’s instructuctions. The two experimental groups presintered FDPs received a surface silica/glass infiltration treatment before the sintering process. Silica sol-gel group (SSG) was graded by the sol-gel processing route, while the glass-zirconia-glass group (GZG) was graded by an enameling technique. Graded groups did not receive a glaze layer after sintering. All FDPs were then luted with a dual-curing resin cement on composite abutments, embedded in polyurethane and stored in water for five days. The initial load of the fatigue test was calculated based on the results of the monotonic testing applied on three specimens of each group. To determine the fatigue limit, 20 samples of each group were subjected to staircase testing (100,000 cycles/5 Hz).
Results
The fatigue limits (in Newtons) were CTL = 1607.27, SSG = 1824.31, and GZG = 2006.57, and the Dixon and Mood test indicated statistically significant differences among groups (95% confidence interval).
Significance
The infiltration of silica and glass on bulk zirconia, by two different grading methods, increased the fatigue limits of monolithic zirconia FDPs.
Keywords: Zirconium, Fatigue, Silicon dioxide, Stress, mechanical, Fixed dental prostheses
1. Introduction
The advances in CAD/CAM (computer-aided design and manufacturing) technology made possible to produce full-contour or monolithic zirconia restorations with occlusal design that do not need to be veneered, thus avoiding the clinical problem of chipping of the veneering porcelain [1–3]. Conservative monolithic zirconia restorations with less than 1 mm can be milled and still present strength similar or superior to that of metal-ceramic and lithium disilicate crowns [4–6]. However, concerns like the challenge of promoting enhanced adhesion between substrate and zirconia ceramic [7], aging (hydrothermal degradation) [8–9], and wear of antagonist teeth [10] have limited the use of monolithic zirconia.
When subjected to fatigue and moisture, zirconia-based materials suffer from stress corrosion, and their strength is compromised [9,11–14]. In the veneered zirconia restoration, the overlay porcelain could protect zirconia against direct exposure to moisture, pH and temperature variations, and impact from chewing forces [11]. Conversely, monolithic zirconia restorations would have only a thin glaze layer on top. Indeed, investigators [15] have shown that glaze application prevents hydrothermal degradation. But, we must also consider that such a thin layer may be removed during function (wear) [16] and, consequently, that zirconia would again be prone to aging. In fact, recent research has shown that a glazed zirconia surface causes greater wear of the antagonist tooth relative to an as-polished surface [16,17]. Nevertheless, Hmaidouch and Weigl [2] considered that studies on this topic are subject to both evaluation and confounding bias, making it impossible to associate tooth wear with any specific causal agent.
A promising technique recently proposed for dental applications is the grading of zirconia [18–20]. The glass infiltration method, proposed by Zhang and Kim [20], on the surfaces of Y-TZP aims to promote better stress distribution, resulting in enhanced flexural strength compared with that achievable with monolithic zirconia [21]. The glass layer on the external surface also protects against hydrothermal degradation, avoids antagonist wear, and allows for color variations, improving the esthetics of monolithic restorations [22]. At the same time, the glass layer formed on the cementation surface of the restoration makes etching and silanization possible, improving adhesion to resin cements [23].
The main feature of functionally graded materials (FGM) such as the zirconia described above is a gradual variation of composition and/or phases and, consequently, properties, inside the same material [24–26]. Another FGM processing route is silica infiltration of zirconia by a sol-gel method, which allows for the modification of the zirconia surface by reactive diffusion of silica into zirconia during the sintering process. This method does not require additional thermal treatment and forms a zirconium silicate, which affects the mechanical properties of zirconia and improves its structural homogeneity [27].
However, the ability of these next-generation functionally graded Y-TZP multiple-unit FDPs to resist fatigue damage remains unknown. Therefore, the purpose of this current study was to evaluate the effect of glass/silica infiltration on the fatigue limit of 3-unit fixed dental prostheses manufactured with monolithic 3 mol% Y-TZP. The null hypothesis was that the fatigue limit of monolithic zirconia bridges would not be affected by glass/silica infiltration.
2. Materials and methods
2.1. Materials
Sixty-nine presintered 3Y-TZP blocks (40 × 15 × 14 mm, VITA In-Ceram YZ Vita for inLab, VITA) were milled to obtain 3-unit FDPs extending from the second mandibular premolar to the second mandibular molar. Technical data of the VITA In-Ceram® YZ for inLab® provided by the manufacturer are presented in the table 1.
Table 1.
Mean of single-cycle fracture load (in Newton), parameters [initial load (IL in Newton) and step size (SS in Newton)], and results [fatigue limit (FL in Newton), standard deviation, confidence intervals, and decrease from fracture load to fatigue limit (decrease in %)]. Abbreviations: (CTL) control group; (SSG) Silica sol-gel group (GZG); Glass-zirconia-glass group.
| Groups | Fracture load | Staircase parameters | Staircase results | |||
|---|---|---|---|---|---|---|
| IL | SS | FL (N)* | CI (95%) | decrease (%) | ||
| GZG | 3235.50 | 2264.85 | 113.24 | 2006.57 (104.2)a | 1934.3 – 2078.7 | 37.9 |
| SSG | 2619.17 | 1833.42 | 91.67 | 1824.31 (69.7)b | 1759.5 – 1889.1 | 30.3 |
| CTL | 1907.66 | 1335.36 | 66.77 | 1607.27 (91.4)c | 1542.9 – 1671.6 | 15.8 |
The statistically significant differences are indicated by different superscript letters.
2.2. Specimen preparation
The dies (2nd mandibular premolar and 2nd mandibular molar) were milled from a dentin composite analogue (NEMA grade G10, Accurate Plastics Inc., Falmouth, MA, USA). The prosthetic preparations had the following caractheristics [28]: 6 mm in height; 120° circumferential chamfer (radius = 0.5 mm); 6° occlusal convergence angle (Fig. 1A, 1B); all transitions from the axial to the occlusal surfaces were rounded, and a central mesiodistal sulcus was simulated on the occlusal surface (Fig. 1C, 1D).
Figure 1.
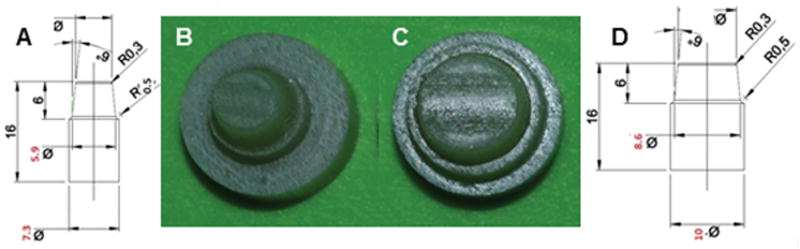
Specifications for premolar (A) and molar (D) preparations; (B, C) the dies were milled from dentin composite analogue (NEMA grade G10). Based on Campos F et al. 2016
Using a adapted surveyor for keeping long-axis of prepatations perpendicular to the ground (x axis), the abutments were embedded into polyurethane (F 16 e F 16 ISO, Axson Technologies, Eaton Rapids, MI, USA) at distances of 17 mm from each other. The obtained sets were scanned (InEos, Sirona Dental Systems GmbH, Bensheim, Germany), and the corresponding three-unit FDPs were created in a CAD system (inLab SW4.2, Sirona) according to the requirements for full anatomic restorations of posterior teeth: the minimum wall thickness was 0.7 mm in the occlusal area, 0.7 mm from the bottom of the fissure, 0.5 at the lateral walls, and 0.2 mm at the cervical region, and anatomical connectors were within the minimum section area of 9 mm2. The milling of the restorations was performed with a CAM unit (CEREC InLab MC XL, Sirona Dental Systems GmbH, Bensheim, Germany), under constant water cooling. After being milled, the restoration was separated from the block-holder, and each one of them was evaluated by stereomicroscopy (Discovery V20, Carl Zeiss, Göttingen, Germany) at 7.5× and 25× magnifications. Grooves on the vestibular wall (close to connector) and mesial walls (where the block holder was cut) of the premolars were seen in all FDPs. The restorations were then cleaned with distilled water (grade 3) in an ultrasonic bath (Digital Dental Ultrasonic CD-4820, Shenzhen Codyson Electrical Ltd, Guangdong, China) for 10 min and left undisturbed to dry in air.
2.3. Grading and sintering procedures
After the milling and cleaning process, the 69 FDPs were divided into three experimental groups (n = 23), according to the grading and sintering protocols (Fig. 2):
Figure 2.
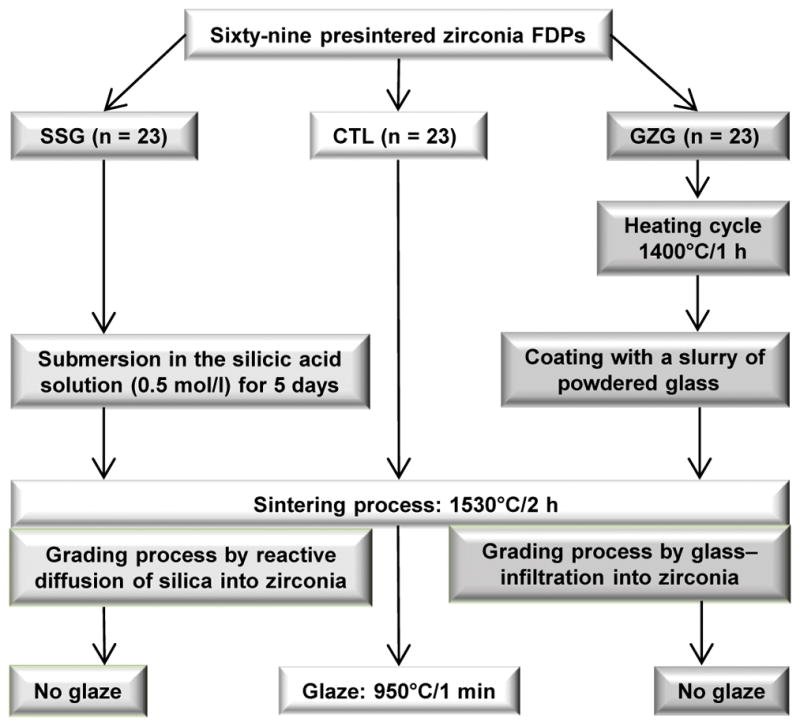
The grading and sintering protocols of each experimental group.
Control group (CTL)
FDPs were sintered in an appropriate furnace (Vita Zyrcomat T, VITA) as follows: time for increasing temperature, 1.5 h→ending temperature, 1530°C→holding time at ending temperature, 2 h→cooling to 400°C with firing chamber being closed. After cooling, FDPs were glazed (VITA Akzent Plus Glaze, VITA) accordingly: time for increasing temperature, 11.37 min→ending temperature, 950°C→holding time at ending temperature, 1 min.
Silica sol-gel group (SSG)
FDPs underwent silica infiltration by the sol-gel method, according to Campos TM et al. [27]. The silicic acid was obtained by the passing of sodium metasilicate (Na2SiO3·5H2O) aqueous solution (10% m/m) through an ion-exchanging resin (IR120 – Rohm and Haas). FDPs were submerged in the silicic acid solution, 0.5 mol/l, for 120 h in a hermetically sealed container with the occlusal surface facing down, at room temperature. FDPs were then removed from the gel and allowed to dry at room temperature, with the occlusal surface facing up. They were then sintered according to the parameters described above, in the same furnace. The FDPs did not receive a glaze layer.
Glass-zirconia-glass group (GZG)
The glass infiltration followed the protocol proposed by Zhang and Kim [20]. Presintered FDPs were heated to 1400°C for 1 h in air. After cooling, all accessible surfaces were coated with a slurry of powdered glass composed of SiO2 (65.5 %), Al2O3 (11.7%), K2O (10.0 %), Na2O (7.3%), CaO (3.0 %), and Tb4O7 (1.9 %). The glass composition was formulated so that the glass and zirconia had similar coefficients of thermal expansion (CTE). Glass infiltration and densification were carried out simultaneously at 1530°C for 2 h in air. As aforementioned, the FDPs were not glazed also.
2.4. Luting procedure
The composite dies were treated with hydrofluoric acid (10% CondAC-porcelana, FGM, Joinville, Brazil) for 1 min, rinsed with water, and dried, after which they received one layer of silane agent (RelyX™ Ceramic Primer, 3M ESPE, St. Paul, MN, USA).
The cementation surfaces of 3-unit zirconia bridges were treated according to the recommended protocols for each production method:
CTL group
FDPs were abraded with 30 μm silica-coated alumina particles (Rocatec Soft, 3M ESPE) with pressure of 2.8 bar, distance of 10 mm, and time of 10 s, followed by silanization (RelyX™ Ceramic Primer, 3M ESPE) for 1 min.
SSG group
FDPs were etched with 2% hydrofluoric acid (Fórmula e Ação Farmácia, São Paulo, Brazil) for 15 s. The adhesive (Single Bond Universal, 3M/ESPE) and optimizer agent (OPC, 3M do Brasil Ltda, São José do Rio Preto, SP, Brasil) were mixed (1:1) for 5 s, and rubbed over the cementation surface for 20 s. The excess was removed with an oil-free air jet, and polymerization was performed for 10 s (Radii-cal High Powered LED, SDI, Victoria, Australia).
GZG group
FDPs were etched with 5% hydrofluoric acid (Fórmula e Ação Farmácia, São Paulo, Brazil) for 1 min, rinsed with water, and dried. Adhesive and optimizer agent were applied following the same steps aforementioned.
A dual-cured resin cement (Variolink II, Ivoclar Vivadent, Schaan, Liechtenstein) was poured and mixed as recommended by the manufacturer and applied to the intaglio surfaces of the FDPs, which were seated on the preparations. Each bridge was then held in position by a metal rod (26.45 oz) positioned in the center of the occlusal surface, excess cement was removed, and each abutment was light-activated for 40 s on the buccal, lingual, and occlusal surfaces by a LED curing light with a wavelength ranging from 440 to 480 nm (Radii-cal, SDI). Then, the cemented sets (Fig. 3A) were positioned in a rectangular metallic matrix, which was filled by polyurethane (F 16 and F 16 ISO, Axson Technologies, Eaton Rapids, MI, USA) until 1mm apart from the finishing line of preparations (Fig. 3B). This made possible an easily insertion of the polyurethane blocks on the device designed for mechanical testing (Fig. 3C). After the polyurethane was cured, the sets were stored in grade 3 distilled water for five days before the fatigue test.
Figure 3.
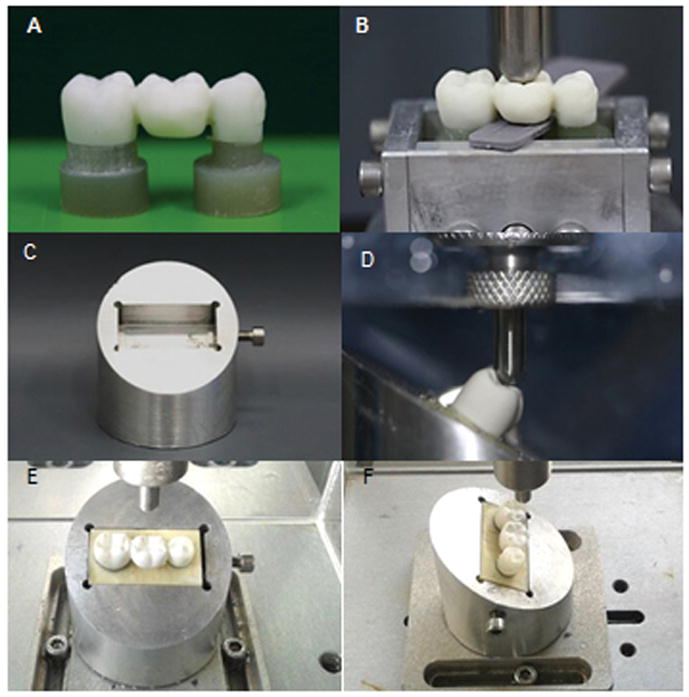
(A) FDP luted on the composite preparations; (B) the cemented sets positioned in a rectangular metallic matrix for embedding on polyurethane; (C) aluminum device designed for mechanical testing shows a rectangular site for the correct insertion of the polyurethane blocks ; (D) samples tilted 30° relative to the horizontal plane. A tungsten-carbide tip contacts the pontic on its inner inclines of the buccal cusps (E, F) sample positioned for staircase testing. The mesio-distal (E) and buccal-lingual position (F) relative to the tip.
2.5. Fatigue limit evaluation (staircase test)
Before fatigue testing, the monotonic failure loads were determined from three specimens of each experimental group. In a universal testing machine (Emic DL 1000, Emic, São José dos Pinhais, Brazil), samples were tilted 30° relative to the horizontal plane, immersed in water, and a tungsten-carbide round tip (6 mm in diameter) applied a crescent load to the inner inclines of the buccal cusps of the pontic (1st molar) until the samples fractured (load cell 1000 Kgf, 1 mm/min) (Fig. 3D).
The starting values of the staircase test were obtained by using 70% of the mean of monotonic load-to-fracture of 3 samples from each experimental group. The purpose of this procedure was to obtain a value near the endurance limit (stress below which failure never occurs, even for an indefinitely large number of loading cycles) of each group. The staircase test was performed in an electric machine (Instron Electropuls E-3000, Instron, Glenview, IL, USA), with the samples arranged at the same manner that were positioned in the monotonic testing (Fig. 3E – F). The test was set at 100,000 cycles, at 5 Hz frequency. The load increment (or step) was defined as 5% of the initial load. Samples were tested sequentially. Each experimental group followed its own load regimes, because the initial load and step sizes were derived from the respective means of load for fracture. Thus, the first sample was tested under the predetermined initial load for 100,000 cycles. If it survived, it was counted as a runout or ‘pass’ and its successor was tested one stress step higher. If the sample failed, its successor was tested one step lower. Twenty tests were carried out for each group. Upon completion of testing, it was determined the less frequent event (failure or survival), because only the less frequent was used in the analysis. Then, the data were tabulated in five-colunm table: I) load values experienced by the less frequent event; II) load levels are numbered in order of increasing magnitude, where the number 0 is assigned to the lowest load value (i); III) number of times the event occurred at each load level (ni); IV) the product of i*ni; V) the product of (i2*ni) and the letters N, A e B (the sun of ni, i*ni e i2*ni, respectively). Those data allowed the determination of the fatigue limit (FL) and the standard deviation (SD) from equations:
The statistical estimate of mean fatigue strength was calculated by:
where:
S0=lowest load value experienced by the less frequent event;
d= load increment value;
A= sum of the colunm IV;
N= número total de eventos menos frequentes.
The plus sign (+) was used if the more frequent event was survival and the minus sign (−) was used if the more frequent event was failure.
For the standard deviations the equation was:
and for confidence interval:
2.6. Data analysis
The Kolmogorov-Smirnov test was applied to test data distribution and the Grubbs test for testing the presence of outliers at a significance level of 5%. After that, data were subjected to the Dixon and Mood method, which involves maximum-likelihood estimation techniques for analytical solutions to the problem of determining the mean and standard deviation [29,30]. This method assumes that the fatigue limit follows a normal distribution. The two statistical properties are determined by either using only the failures or only the survivals, depending on the least frequent event that had the smaller total numbers. The fixed stress increment should be in the range of half to twice the standard deviation of the fatigue limit.
However, the Dixon and Mood method cannot be used in the following situations:
the fatigue limit is not normal and cannot be transformed to be normal;
the stress increments are not identical at the difference stress levels.
the stress increment is greater than twice the standard deviation.
In such cases, or when the data follows a Weibull distribution, the statistical analysis should be done by Zhang and Kececioglu method [31,32].
2.7. Failure analysis
Fracture analysis was firstly performed by means of a binocular stereomicroscope (Discovery V20, Carl Zeiss, Göttingen, Germany) for determination of the spatial relationships of the observed fracture features [33,34]. The fragments were then cleaned in an ultrasonic bath (Ultrasonic CD-4820, Shenzhen Codyson Electrical Ltd, Guangdong, China) with isopropyl alcohol for 10 min, dried, and coated by gold-sputtering (Emitech SC7620, Quorum Technologies Ltd, Laughton, UK). They were then analyzed by scanning electron microscopy (INSPECT S50, FEI, Brno, Czech Republic).
3. Results
3.1. Data distribution
The Kolmogorov-Smirnov test indicated that there was no violation of the normality assumption, and Grubbs’ test did not detect outliers (at the 5% level of significance).
3.2. Fatigue limit – Staircase test
The normal data distribution, the step values ranging from half to twice the standard deviation (fixed for each group), the sample size higher than 15, and three or more load levels for failure and survival allowed for the use of Dixon and Mood data analysis, with low risk of bias [30,31,35,36]. Table 1 presents parameters for staircase test and the results.
Statistical differences were observed among the fatigue limits of the three groups, given that the non-overlapping of the confidence intervals was noted: the control group had the lowest fatigue limit, while GZG group obtained the highest one. Still, the control group presented the lowest decrease regarding initial load to fracture (15.8% decrease), and the GZG group presented a decrease of almost 40% regarding initial load to fracture (Table 1). The SSG group presented the lowest standard deviation.
The profiles generated by the staircase test are presented in Fig. 4.
Figure 4.
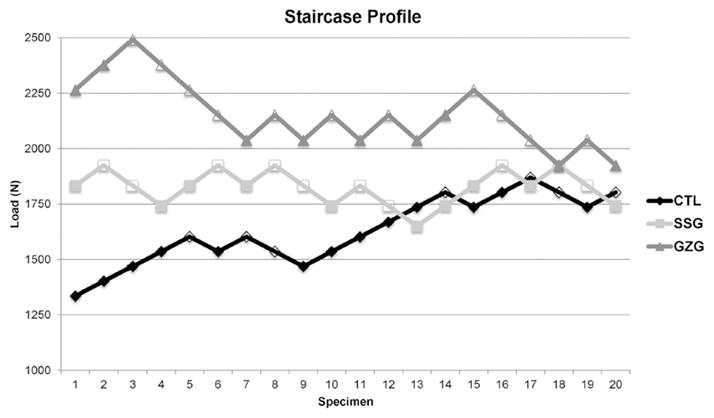
Staircase profiles generated after the test for each group. Fractured specimens are represented by empty forms.
3.3. Failure analysis and topographic features
All failures were catastrophic, but different patterns were observed. The CTL group presented a higher number of failures (n = 5) at the distal connector. For the GZG group, the main failure mode originated at the occlusal surface of the pontic (n = 6), and the SSG group presented the failure origin of seven samples located at the mesial connector. Fig. 5 presents the different failure patterns observed in each experimental group.
Figure 5.

Different failure patterns found for each test group.
Fracture mapping of a representative sample from each experimental group is shown in Figure 6.
Figura 6.
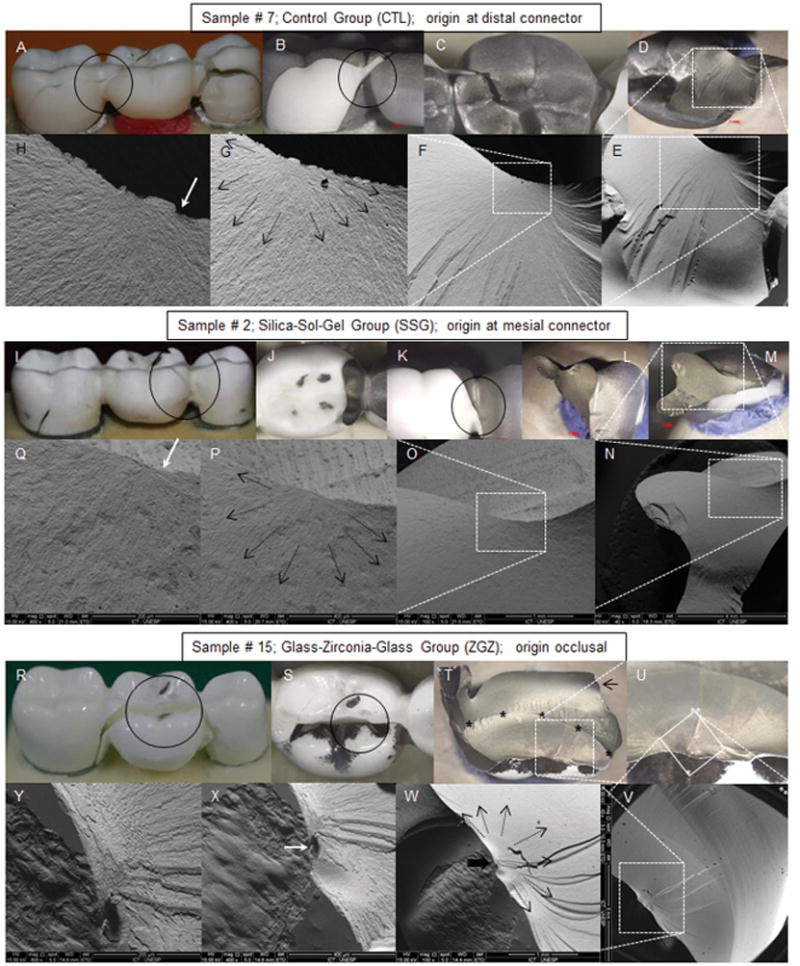
Fracture origin mapping from one sample of each experimental group. The black circles delimits the investigated areas. The dotted white lines mark the regions suspected of containing the fracture origin. The black arrows indicate the direction of crack propagation from the fracture initiator defect and the white arrows indicate the origin of the fracture. (A – H – clockwise): Sample #7 from the control group (CTL): (A) the reassembly of the sample fragments indicates that the fracture ran from distal to mesial origin at the distal connector, (B) buccal view o of the distal connector; (C) occlusal view of the pontic; (D) internal view of the distal connector; (E – H) SEM images of the suspected areas with crescent magnifications (40×; 100 ×; 400 × and 1000 × respectively). (L – Q – clockwise): sample #2 from the silca sol-gel group (SSG): (L) the reassembly of the sample fragments indicates that the fracture ran from mesial to distal; (J) occlusal view of the pontic; (K, L) buccal view o of the mesial connector; (M) internal view of the mesial connector; (N – Q) SEM images of the suspected areas with crescent magnifications (40x; 100 x; 400 × and 800 × respectively). (R – Y clockwise): sample #15 from the GZG group: (R) the reassembly of the sample fragments indicates that the fracture initiated from occlusal, ran to distal and then to mesial; (S) occlusal view of the pontic; (T) internal view of the buccal fragment. Black asterisks marks the arrest line, and the black arrow indicates the compression curl; (V – Y) SEM images of the suspected areas with crescent magnifications (40 ×; 100 ×; 400 × and 800 × respectively).
4. Discussion
To our knowledge, this is the first study to test full-contour zirconia 3-unit fixed dental prostheses made of graded 3Y-TZP. According to the findings, the glass/silica infiltration techniques in the monolithic zirconia bridges significantly increased the fatigue limits compared with the glazed control group (CTL). Therefore, the null hypothesis was rejected.
Glass- and silica-infiltrated zirconia ceramics were tested in previous studies in different geometric forms: plates, beams, discs and single crowns [6,21,27]. The specimen geometry may influence stress concentration [37], and the use of geometric forms similar to those used in the mouth for in vitro studies is important for its clinical relevance and predition [6,38]. It has been reported that the fracture loads were lower in curved surfaces of anatomically correct crowns than in flat specimens [39].
The effects of minor additions of silica to 3Y-TZP have been discussed in previous studies that reported increase in resistance to low-temperature degradation (LTD), with no effect on resistance to slow crack growth (SCG). In the same way, mechanical properties, grain size, and densities were not affected [40,41]. In the present study, in the SSG group, the grooves generated by the CAD/CAM process were filled by silica. During the sintering process, silica on the zirconia surface can suffer a reaction in its solid state, resulting in zirconia silicate, without the amorphous glassy phase. Therefore, silica is not in its free form, the layer of ZrSiO4 formed on the 3Y-TZP surface reduces the number of flaws [27], and, consequently, the possibility of these defects, when subjected to mechanical stress, becomes the initial crack point in the ceramic material.
The increase in fatigue limit in the GZG group may be associated with the glass-filling of intergranular spaces and also by the residual glass layer on the surface of the infiltrated FDP, which has lower elastic modulus and better distributes stresses [42]. The higher variability in the results of GZG is probably due to variations in the material [43], such as different thicknesses of the residual glass layer.
Different load levels were used as initial loading for the fatigue test, depending on the group. This means, although the three groups are essentially the same in the bulk, their surface characteristics determined the resistance to monotonic loading and, finally, their resistance to fatigue.
The increase in structural homogeneity of silica infiltrated zirconia though sol-gel method had already been shown [27] which was confirmed by the low variability in the fatigue limit results found in the present study. We suggest that the silica infiltrated in the grooves produced by the milling process [27] and a lower tendence of zirconia for suffering degradation in water [44] explain the differences in the fatigue behavior of SSG and CTL specimens. Finally, the GZG group presented superior performance than monolithic zirconia and porcelain fused to zirconia specimens in several studies. Zhang and Kim [45] observed that glass-infiltrated zirconia showed better resistance to sliding damage than did monolithic zirconia and glazed zirconia, which can justify the higher fatigue limit than in the other groups. The interfacial fracture energy of graded zirconia, which had been previsously veneered was superior than that of the non-graded counterparts [46].
For the silica infiltrated specimens and the other glazed specimens, failure was caused predominantly by flexural damage, where cracks grew to only a relatively small critical size and then quickly become unstable.
Chipping was not observed in this study, probably because chipping is most likely to occur in veneering porcelain under lower occlusal loads [3]. All failures were catastrophic, indicating a high resistance to fracture load. This is in agreement with Srikanth et al. [46], who observed an increase in flexural strength in glass-infiltrated specimens.
Unlike ductile materials, a crack does not initiate naturally in brittle ceramic materials. Typically, it is initiated from any pre-existing defects, and when in tension, they cause localized stress concentrations when loaded at more than a bearable level [47,48]. The analysis of the samples before sintering showed irregularities introduced from the CAM process, at the mesial connector, and at the mesial surface of the premolar. We did not observe fractures departing from these sites in the control group, but we also found origins away from these damage zones such as in the SSG specimens, which were mostly in the distal connector.
It is possible that an increase in the monoclinic phase in the cervical region [49] was not enough to initiate the fracture, and the major factor was the association between pre-existing flaws in the radii of the approximal curvature of the finishing line, as shown in the study by Øilo et al. [50]. But other factors may also play a role in the fractures of posterior fixed dental all-ceramic prostheses, including prosthesis design, flaw distribution, and direction and magnitude of occlusal loading [51].
In the current study, we attempt to simulate a clinical situation. Thus, we selected the worst scenario, according Kou et al. [52], with samples positioned 30° under loading on the buccal cusps. Furthermore, crown-shaped test specimens cemented on preparations of tooth-like material may bring the test conditions even closer to the clinical situation [53]. In addition, a wet environment could decrease the fracture resistance of ceramics [12,54,55]. However, despite the efforts to simulate a clinical scenario, the applied loads were not similar to the ones that naturally occur in the mouth, and it was noted that the tip contacted a portion of the non-functional cusps. In fact, one of the limitations of in vitro studies is the challenge in simulating a real clinical situation. Despite the limitations regarding the loading conditions, we believe that our results were not biased, since the fractographic analysis (macro and micro) showed that the fractures originated at occlusal surface always iniciated in functional cusps.
5. Conclusions
Silica infiltration and glass infiltration were efficient methods for obtaining graded zirconia, since it notes improvements for fatigue limit of the FDPs compared with glazed monolithic zirconia restorations.
Acknowledgments
This work was sponsored by funding from the Coordination for the Improvement of Higher Education Personnel (CAPES) and the United States National Institute of Dental & Craniofacial Research, National Institutes of Health (P.I. Yu Zhang, Grant 2R01 DE017925).
Footnotes
Conflict of interest: none
References
- 1.Gracis S, Thompson VP, Ferencz JL, Silva NRFA, Bonfante EA. A new classification system for all-ceramic and ceramic-like restorative materials. Int J Prosthodont. 2015;28:227–35. doi: 10.11607/ijp.4244. [DOI] [PubMed] [Google Scholar]
- 2.Hmaidouch R, Weigl P. Tooth wear against ceramic crowns in posterior region: a systematic literature review. Int J Oral Sci. 2013;5:183–90. doi: 10.1038/ijos.2013.73. [DOI] [PMC free article] [PubMed] [Google Scholar]
- 3.Zhang Y, Lee JJW, Srikanth R, Lawn BR. Edge chipping and flexural resistance of monolithic ceramics. Dent Mater. 2013;29:1201–8. doi: 10.1016/j.dental.2013.09.004. [DOI] [PMC free article] [PubMed] [Google Scholar]
- 4.Johansson C, Kmet G, Rivera J, Larsson C, Vult Von Steyern P. Fracture strength of monolithic all-ceramic crowns made of high translucent yttrium oxide-stabilized zirconium dioxide compared to porcelain-veneered crowns and lithium disilicate crowns. Acta Odontol Scand. 2014;72:145–53. doi: 10.3109/00016357.2013.822098. [DOI] [PubMed] [Google Scholar]
- 5.Sun T, Zhou S, Lai R, Liu R, Ma S, Zhou Z, et al. Load-bearing capacity and the recommended thickness of dental monolithic zirconia single crowns. J Mech Behav Biomed Mater. 2014;35:93–101. doi: 10.1016/j.jmbbm.2014.03.014. [DOI] [PubMed] [Google Scholar]
- 6.Zhang Y, Mai Z, Barani A, Bush M, Lawn B. Fracture-resistant monolithic dental crowns. Dent Mater. 2016;32:442–9. doi: 10.1016/j.dental.2015.12.010. [DOI] [PMC free article] [PubMed] [Google Scholar]
- 7.Edelhoff D, Özcan M. To what extent does the longevity of fixed dental prostheses depend on the function of the cement? Working Group 4 materials: Cementation. Clin Oral Implants Res. 2007;18:193–204. doi: 10.1111/j.1600-0501.2007.01442.x. [DOI] [PubMed] [Google Scholar]
- 8.Nakamura K, Harada A, Kanno T, Inagaki R, Niwano Y, Milleding P, et al. The influence of low-temperature degradation and cyclic loading on the fracture resistance of monolithic zirconia molar crowns. J Mech Behav Biomed Mater. 2015;47:49–56. doi: 10.1016/j.jmbbm.2015.03.007. [DOI] [PubMed] [Google Scholar]
- 9.Swain MV. Impact of oral fluids on dental ceramics: What is the clinical relevance? Dent Mater. 2014;30:33–42. doi: 10.1016/j.dental.2013.08.199. [DOI] [PubMed] [Google Scholar]
- 10.Stober T, Bermejo JL, Rammelsberg P, Schmitter M. Enamel wear caused by monolithic zirconia crowns after 6 months of clinical use. J Oral Rehabil. 2014;41:314–22. doi: 10.1111/joor.12139. [DOI] [PubMed] [Google Scholar]
- 11.Alghazzawi TF, Lemons J, Liu PR, Essig ME, Bartolucci AA, Janowski GM. Influence of Low-Temperature Environmental Exposure on the Mechanical Properties and Structural Stability of Dental Zirconia. J Prosthodont. 2012;21:363–9. doi: 10.1111/j.1532-849X.2011.00838.x. [DOI] [PubMed] [Google Scholar]
- 12.Kohorst P, Dittmer MP, Borchers L, Stiesch-Scholz M. Influence of cyclic fatigue in water on the load-bearing capacity of dental bridges made of zirconia. Acta Biomater. 2008 Sep;4(5):1440–7. doi: 10.1016/j.actbio.2008.04.012. [DOI] [PubMed] [Google Scholar]
- 13.Studart AR, Filser F, Kocher P, Gauckler LJ. Fatigue of zirconia under cyclic loading in water and its implications for the design of dental bridges. Dent Mater. 2007 Jan;23(1):106–14. doi: 10.1016/j.dental.2005.12.008. [DOI] [PubMed] [Google Scholar]
- 14.Zhang Y, Lawn BR. Long-Term Strength of Ceramics for Biomechanical Applications. Journal of Biomedical Materials Research—Part B Applied Biomaterials. 2004;69B:166–172. doi: 10.1002/jbm.b.20039. [DOI] [PubMed] [Google Scholar]
- 15.al-Wahadni A, Martin DM. Glazing and finishing dental porcelain: a literature review. J Can Dent Assoc. 1998;64:580–3. [PubMed] [Google Scholar]
- 16.Lawson NC, Janyavula S, Syklawer S, McLaren EA, Burgess JO. Wear of enamel opposing zirconia and lithium disilicate after adjustment, polishing and glazing. J Dent. 2014;42:1586–91. doi: 10.1016/j.jdent.2014.09.008. [DOI] [PubMed] [Google Scholar]
- 17.Sabrah AH, Cook NB, Luangruangrong P, Hara AT, Bottino MC. Full-contour Y-TZP ceramic surface roughness effect on synthetic hydroxyapatite wear. Dent Mater. 2013 Jun;29(6):666–73. doi: 10.1016/j.dental.2013.03.008. [DOI] [PubMed] [Google Scholar]
- 18.Du J, Niu X, Rahbar N, Soboyejo W. Bio-inspired dental multilayers: Effects of layer architecture on the contact-induced deformation. Acta Biomater. 2013;9:5273–9. doi: 10.1016/j.actbio.2012.08.034. [DOI] [PubMed] [Google Scholar]
- 19.Tsukada G, Sueyoshi H, Kamibayashi H, Tokuda M, Torii M. Bending strength of zirconia/porcelain functionally graded materials prepared using spark plasma sintering. J Dent. 2014;42:1569–76. doi: 10.1016/j.jdent.2014.09.012. [DOI] [PubMed] [Google Scholar]
- 20.Zhang Y, Kim JW. Graded structures for damage resistant and aesthetic all-ceramic restorations. Dent Mater. 2009;25:781–90. doi: 10.1016/j.dental.2009.01.002. [DOI] [PMC free article] [PubMed] [Google Scholar]
- 21.Zhang Y, Ma L. Optimization of ceramic strength using elastic gradients. Acta Mater. 2009;57:2721–9. doi: 10.1016/j.actamat.2009.02.037. [DOI] [PMC free article] [PubMed] [Google Scholar]
- 22.Ren L, Janal MN, Zhang Y. Sliding contact fatigue of graded zirconia with external esthetic glass. J Dent Res. 2011;90:1116–21. doi: 10.1177/0022034511412075. [DOI] [PMC free article] [PubMed] [Google Scholar]
- 23.Chai H, Kaizer M, Chughtai A, Tong H, Tanaka C, Zhang Y. On the interfacial fracture resistance of resin-bonded zirconia and glass-infiltrated graded zirconia. Dent Mater. 2015;31:1304–11. doi: 10.1016/j.dental.2015.08.161. [DOI] [PMC free article] [PubMed] [Google Scholar]
- 24.Bohidar SK, Sharma R, Mishra PR. Functionally Graded Materials: A Critical Review. [Date accessed: 20 Nov. 2015];International Journal of Research, [Sl] 2014 Aug;1(7):289–301. Available at: < https://edupediapublications.org/journals/index.php/IJR/article/view/378>. [Google Scholar]
- 25.Jha DK, Kant T, Singh RK. A critical review of recent research on functionally graded plates. Compos Struct. 2013;96:833–49. doi: 10.1016/j.compstruct.2012.09.001. [DOI] [Google Scholar]
- 26.Miyamoto Y, Kaysser WA, Rabin BH, Kawasaki A, Ford RG. Functionally Graded Material: Design, Processing and Applications. Vol. 5. Springer; US: 1999. Processing and fabrication; p. 330. eBook. [DOI] [Google Scholar]
- 27.Campos TMB, Ramos NC, Machado JPB, Bottino MA, Souza ROA, Melo RM. A new silica-infiltrated Y-TZP obtained by the sol-gel method. J Dent. 2016;48:2016. doi: 10.1016/j.jdent.2016.03.004. [DOI] [PubMed] [Google Scholar]
- 28.Campos F, Valandro LF, Feitosa SA, Kleverlaan CJ, Feilzer AJ, de Jager N, Bottino MA. Adhesive Cementation Promotes Higher Fatigue Resistance to Zirconia Crowns. Oper Dent. 2016 Nov 28; doi: 10.2341/16-002-L. [Epub ahead of print] [DOI] [PubMed] [Google Scholar]
- 29.Collins JA. Failure of materials in mechanical design. 2. Ohio: Wiley Interscience; 1993. [Google Scholar]
- 30.Pollak R, Palazotto A, Nicholas T. A simulation-based investigation of the staircase method for fatigue strength testing. Mech Mater. 2006;38:1170–81. doi: 10.1016/j.mechmat.2005.12.005. [DOI] [Google Scholar]
- 31.Lin SK, Lee YL, Lu MW. Evaluation of the staircase and the accelerated test methods for fatigue limit distributions. Int J Fatigue. 2001 Jan;23:75–83. [Google Scholar]
- 32.Zhang J, Kececioglu DB. New approaches to determine the endurance strength distribution. The 4th ISSAT International Conference on Reliability and Quality in Design; 1998 Aug 12–14; Seattle, Washington. pp. 297–301. [Google Scholar]
- 33.Quinn GD, Ives L, Jahanmir S. On the nature of machining cracks in ground ceramics: Part I: SRBSN strengths and fractographic analysis. Mach Sci Technol. 2005;9:169–210. [Google Scholar]
- 34.Quinn G. Fractography of ceramics and glasses. National Institute of Standards and Technology; 2007. [Google Scholar]
- 35.Azees AA. Fatique failure and testing method [thesis] Riihimäki: Häme University of Applied Sciences; 2013. [Google Scholar]
- 36.Grove D, Campean F. A comparison of two methods of analysing staircase fatigue test data. Qual Reliab Eng Int. 2008;24:485–97. doi: 10.1002/qre.899. [DOI] [Google Scholar]
- 37.Quinn GD, Studart AR, Hebert C, Verhoef JR, Arola D. Fatigue of zirconia and dental bridge geometry: Design implications. Dent Mater. 2010;26:1133–6. doi: 10.1016/j.dental.2010.07.014. [DOI] [PMC free article] [PubMed] [Google Scholar]
- 38.Bonfante EA, Rafferty B, Zavanelli RA, Silva NR, Rekow ED, Thompson VP, et al. Thermal/mechanical simulation and laboratory fatigue testing of an alternative yttria tetragonal zirconia polycrystal core-veneer all-ceramic layered crown design. Eur J Oral Sci. 2010;118:202–9. doi: 10.1111/j.1600-0722.2010.00724.x. [DOI] [PubMed] [Google Scholar]
- 39.Zhang Y, Chai H, Lee JJ-W, Lawn BR. Chipping resistance of graded zirconia ceramics for dental crowns. J Dent Res. 2012;91:311–5. doi: 10.1177/0022034511434356. [DOI] [PMC free article] [PubMed] [Google Scholar]
- 40.Gremillard L, Chevalier J, Epicier T, Fantozzi G. Improving the Durability of a Biomedical-Grade Zirconia Ceramic by the Addition of Silica. J Am Ceram Soc. 2002;85:401–7. [Google Scholar]
- 41.Samodurova A, Kocjan A, Swain MV, Kosmac T. The combined effect of alumina and silica co-doping on the ageing resistance of 3Y-TZP bioceramics. Acta Biomater. 2015;11:477–87. doi: 10.1016/j.actbio.2014.09.009. [DOI] [PubMed] [Google Scholar]
- 42.Zhang Y, Chai H, Lawn BR. Graded structures for all-ceramic restorations. J Dent Res. 2010;89:417–21. doi: 10.1177/0022034510363245. [DOI] [PMC free article] [PubMed] [Google Scholar]
- 43.Chai H, Lee JJW, Mieleszko AJ, Chu SJ, Zhang Y. On the interfacial fracture of porcelain/zirconia and graded zirconia dental structures. Acta Biomater. 2014;10:3756–61. doi: 10.1016/j.actbio.2014.04.016. [DOI] [PMC free article] [PubMed] [Google Scholar]
- 44.Amaral M, Cesar PF, Bottino MA, Lohbauer U, Valandro LF. Fatigue behavior of Y-TZP ceramic after surface treatments. J Mech Behav Biomed Mater. 2016;57:149–56. doi: 10.1016/j.jmbbm.2015.11.042. [DOI] [PubMed] [Google Scholar]
- 45.Zhang Y, Kim JW. Graded zirconia glass for resistance to veneer fracture. J Dent Res. 2010;89:1057–62. doi: 10.1177/0022034510375289. [DOI] [PMC free article] [PubMed] [Google Scholar]
- 46.Srikanth R, Kosmac T, Della Bona A, Yin L, Zhang Y. Effects of cementation surface modifications on fracture resistance of zirconia. Dent Mater. 2015;31:435–42. doi: 10.1016/j.dental.2015.01.013. [DOI] [PMC free article] [PubMed] [Google Scholar]
- 47.Asoo B, McNaney JM, Mitamura Y, Ritchie RO. Cyclic fatigue-crack propagation in sapphire in air and simulated physiological environments. J Biomed Mater Res. 2000;52:488–91. doi: 10.1002/1097-4636(20001205)52:3<488::AID-JBM6>3.0.CO;2-W. [DOI] [PubMed] [Google Scholar]
- 48.Vult von Steyern P, Ebbesson S, Holmgren J, Haag PNK. Fracture strength of two oxide ceramic crown systems after cyclic pre-loading and thermocycling. J Oral Rehabil. 2006;33:682–9. doi: 10.1111/j.1365-2842.2005.01604.x. [DOI] [PubMed] [Google Scholar]
- 49.Kypraiou V, Pelekanos S, Eliades G. Identification of monoclinic phase in CAD/CAM zirconia FPD frameworks. Eur J Esthet Dent. 2012;7:418–29. [PubMed] [Google Scholar]
- 50.Oilo M, Kvam K, Reisegg K, Gjerdet NR. The Effects of Margin Curvature on Load at Fracture of Ceramic Crowns. Int J Prosthodont. 2015;28:357–9. doi: 10.11607/ijp.4191. [DOI] [PubMed] [Google Scholar]
- 51.Esquivel-Upshaw JF, Mehler A, Clark AE, Neal D, Anusavice KJ. Fracture analysis of randomized implant-supported fixed dental prostheses. J Dent. 2014;42:1335–42. doi: 10.1016/j.jdent.2014.07.001. [DOI] [PMC free article] [PubMed] [Google Scholar]
- 52.Kou W, Qiao J, Chen L, Ding Y, Sjögren G. Numerical simulation of the fracture process in ceramic FPD frameworks caused by oblique loading. J Mech Behav Biomed Mater. 2015 Oct;50:206–14. doi: 10.1016/j.jmbbm.2015.06.017. [DOI] [PubMed] [Google Scholar]
- 53.Kelly JR, Rungruanganunt P, Hunter B, Vailati F. Development of a clinically validated bulk failure test for ceramic crowns. J Prosthet Dent. 2010 Oct;104(4):228–38. doi: 10.1016/S0022-3913(10)60129-1. [DOI] [PubMed] [Google Scholar]
- 54.Aboushelib MN, Feilzer AJ, Kleverlaan CJ. Bridging the gap between clinical failure and laboratory fracture strength tests using a fractographic approach. Dent Mater. 2009 Mar;25(3):383–91. doi: 10.1016/j.dental.2008.09.001. [DOI] [PubMed] [Google Scholar]
- 55.Borges GA, Caldas D, Taskonak B, Yan J, Sobrinho LC, de Oliveira WJ. Fracture loads of all-ceramic crowns under wet and dry fatigue conditions. J Prosthodont. 2009 Dez;18(8):649–55. doi: 10.1111/j.1532-849X.2009.00498.x. [DOI] [PubMed] [Google Scholar]