Abstract
Aims
Heart failure (HF) has been defined classically as a condition in which the heart is unable to deliver sufficient oxygen to match the needs of the metabolizing tissues. Surprisingly, this definition has never been validated. The goal of this study was to determine the prevalence of elevated lactate levels in a cohort of patients with advanced heart failure.
Methods and results
We retrospectively analyzed Arterio-Venous oxygen difference (A-V O2), hemodynamics, and plasma lactate levels in Stage D heart failure patients who were being evaluated for a Left Ventricular Assist Device (LVAD). We identified 359 patients with a right heart catheterization (RHC) performed prior to LVAD implantation. Plasma lactate was available for 96 patients. RHC showed that 93% of the patients had an A-V O2 difference above the upper limit of normal (> 5 ml/100 ml). Among patients with measured lactate levels the prevalence of elevated lactate (> 2.1 mmol/L) was 25% (95% CI 16.7–34.9). A-V O2 was widened in all patients with elevated lactate, but plasma lactate did not correlate with A-V O2 (R=0.02) and only 27% of patients with increased A-V O2 had elevated plasma lactate.
Conclusions
Lactate levels were normal in ~ 75% of the patients with advanced HF and widened A-VO2 difference, suggesting that the cardiac output was sufficient to meet the metabolic needs of the peripheral metabolizing tissues. Given that ~ 4% of HF patients are in NYHA class IV, these findings suggest that the classic definition of heart failure pertains to ~1% of patients with HF.
Keywords: HFrEF, cardiac output, LVAD, lactic acid
INTRODUCTION
The development of conceptual models of diseases has become a cornerstone of the scientific approach to clinical medicine, insofar as they allow scientists and clinicians to integrate vast amounts of experimental and clinical data into a comprehensible working model that permits one to understand a disease process more completely. Indeed conceptual models of disease have enabled physicians to develop effective new therapies, as well as to base their clinical practice patterns upon these conceptual models of disease (e.g.,”neurohormonal antagonism”). However, one unintended consequence of this approach is that certain core beliefs that are based on the “historical context” in which the disease was first characterized, often become engrained in the literature, and therefore escape the same type of intellectual scrutiny that is applied to more contemporary pathophysiological models of disease. A rigorous test of any clinical model, old or new, is to try to refute its predictions, in an effort to determine whether these predictions remain valid. Scientific models and or definitions should persist as long as their predictions remain accurate, and hence potentially useful for the care of patients.
Germane to this discussion, there have been a number of thoughtful attempts to develop a unifying theory that explains the development and progression of the clinical syndrome of heart failure (reviewed in 1). One of the more enduring clinical models/definitions that has withstood the test of time posits that heart failure should be defined as an abnormality of cardiac structure or function leading to failure of the heart to deliver oxygen at a rate commensurate with the requirements of the metabolizing tissues. 2–8 This definition, which was first proposed in 1977, 9 was based on the insights that clinicians made while caring for patients with advanced heart failure. While completely logical for the time, this definition is extremely difficult to reconcile with our current understanding of heart failure, which ranges from patients with asymptomatic structural heart to disease, to patients who require mechanical circulatory support and/or cardiac transplantation. In an effort to determine whether there was a physiological basis for this time honored definition of heart failure, we were surprised to find that no prior studies sought to validate this concept. Accordingly, we sought to validate this concept in a group of patients with advanced heart failure, all of whom had elevated filling pressures, a widened A-VO2 difference and a depressed cardiac output.
METHODS
Patient cohort
We retrospectively identified a cohort of 359 consecutive patients who received a right heart catheterization (RHC) at Barnes-Jewish Hospital (BJH), between May 2005 and May 2013, prior to undergoing implantation of a continuous flow Left Ventricular Assist Device (LVAD). Patient characteristics and clinical data were obtained through review of the medical record. All data were collected and managed using REDCap.10 All the variables of interest were recorded in the study cohort, with a very limited (~ 5.5%) amount of missing data. Arterio-Venous Oxygen difference (A-V O2) at the time of RHC was either measured through sampling of both pulmonary artery and femoral artery blood or through sampling of pulmonary artery and estimation of arterial blood oxygen saturation from pulse oximetry data. Lactate was measured by the Barnes-Jewish Hospital clinical laboratory using the Lactate Reagent from Roche Corporation. The upper level of the reference range for this reagent is 2.1 mmol/l, we therefore defined plasma lactate ≥ 2.1 mmol/L as elevated. Lactate was measured on peripheral venous blood collected on ice within 24h of LVAD placement. None of the studied patients was on metformin or theophylline and none had received sodium nitroprussiate for more than 48h. Cardiac output was measured via the Fick method estimating O2 consumption either as 125ml per m2 of body surface area or using the La Farge formula.11 INTERMACS (Interagency Registry for Mechanically Assisted Circulatory Support) classification at the time of LVAD implant was determined by the implanting surgeon or assigned by the advanced heart failure team.
Statistical analysis
Comparisons of baseline characteristics between patients having lactate measured versus those who did not were conducted using Student’s t-test for independent groups and Fisher’s exact test for continuous and categorical variables, respectively. The median, 1st quartile and 3rd quartile were calculated for variables that were highly skewed, which were compared between groups using the Kruskal-Wallis test. Similar comparisons were made for A-V O2 ≤ 5 vs. A-V O2 > 5 and for lactate < 2.1 vs. lactate ≥ 2.1. Exact confidence intervals for proportion of patients fitting into various A-V O2 and lactate categories were created using Clopper-Pearson method for binomial proportions. The Cochran-Armitage test for trend was conducted to evaluate lactate < 2.1 and A-V O2 > 5 across INTERMACS profile categories 1, 2, and 3+. Spearman correlations were created to evaluate the linear relationship between lactate and A-V O2 and cardiac index as well as AST and lactate. All analyses were conducted in SAS v9.4 (SAS Institute Inc., Cary, NC). The study was reviewed and approved by Washington University in St Louis Institutional Review Board.
RESULTS
Patient characteristics
The characteristics of the patient cohort with advanced heart failure are displayed in Table 1. As shown, the patients were predominantly Caucasian males, age 57.2 ± 11.5 years. Seventy percent of the patients were INTERMACS class 1 and 2 at the time of LVAD implant. The mean wedge pressure was 27.5 ± 8.2 mmHg, the cardiac Index was 1.8 ± 0.8 L/min m2, and the mean LVEF was 18.2% ± 6.9%, The median number of days between right heart catheterization and LVAD implant was 9±6 days. Within the cohort of 359 patients, we identified a sub-group of 96 patients who had serum lactate levels measured prior to LVAD implant. When compared with the larger sub-group of patients who did not have lactate measured, patients that underwent assessment of plasma lactate had lower INTERMACS profile levels (47% vs 13% in INTERMACS class 1, p<0.001), as well as slightly higher RA pressure (17 vs 15 mmHg, p = 0.016), serum creatinine (1.68 vs 1.5 g/dl, p = 0.050), serum AST (47 vs 35.5 U/L, p < 0.001) and slightly lower serum albumin (3.4 vs 3.7 g/dl, p < 0.001) (Table 1). However, there was no statistically significant (p > 0.05) difference between the two subgroups in terms of hemodynamic or echocardiographic parameters.
Table 1.
Patient Demographics
| Variable | Total (N=359) | Lactate Not measured (N=263) | Lactate Measured (N=96) | P-value |
|---|---|---|---|---|
| Age, years | 57.21 ± 11.46 | 57.28 ± 11.63 | 57.01 ± 11.04 | 0.85 |
| Caucasian, No. (%) | 272 (76%) | 202 (77%) | 70 (73%) | 0.49 |
| Male, No. (%) | 290 (81%) | 216 (82%) | 74 (77%) | 0.29 |
| Bmi, Kg/m2 | 29.35 ± 6.09 | 29.20 ± 6.15 | 29.77 ± 5.93 | 0.44 |
| Bsa, m2 | 2.08 ± 0.29 | 2.09 ± 0.30 | 2.07 ± 0.27 | 0.60 |
| Intermacs profile, No. (%) | <.001 | |||
| . Intermacs 1 | 79 (22%) | 34 (13%) | 45 (47%) | |
| . Intermacs 2 | 208 (58%) | 163 (62%) | 45 (47%) | |
| . Intermacs 3 | 47 (13%) | 42 (16%) | 5 (5%) | |
| . Intermacs 4 | 19 (5%) | 18 (7%) | 1 (1%) | |
| . Intermacs 5 | 2 (1%) | 2 (1%) | 0 (0%) | |
| . Intermacs 6 | 2 (1%) | 2 (1%) | 0 (0%) | |
| RA pressure, mmHg | 15.18 ± 7.37 | 14.54 ± 6.74 | 16.95 ± 8.68 | 0.016 |
| Wedge pressure, mmHg | 27.54 ± 8.19 | 27.27 ± 8.20 | 28.28 ± 8.15 | 0.30 |
| Cardiac index, L/min m2 | 1.79 ± 0.47 | 1.80 ± 0.47 | 1.73 ± 0.44 | 0.21 |
| Cardiac output, L/min | 3.69 ± 1.10 | 3.72 ± 1.10 | 3.62 ± 1.10 | 0.43 |
| LV EF, % | 18.20 ± 6.88 | 18.45 ± 6.89 | 17.53 ± 6.83 | 0.27 |
| LVEDD, cm | 6.89 ± 1.09 | 6.92 ± 1.07 | 6.82 ± 1.16 | 0.47 |
| RV TEI | 0.64 ± 0.27 | 0.64 ± 0.25 | 0.65 ± 0.32 | 0.77 |
| INR | 1.45 ± 0.36 | 1.43 ± 0.33 | 1.51 ± 0.44 | 0.09 |
| AST, U/L, Median (Q1, Q3) | 37.0 (26.0, 58.0) | 35.5 (26.0, 48.0) | 47.0 (30.0, 142.0) | <.001 |
| Albumin, g/dl | 3.64 ± 0.48 | 3.72 ± 0.46 | 3.42 ± 0.47 | <.001 |
| Creatinine, g/dl | 1.55 ± 0.75 | 1.50 ± 0.74 | 1.68 ± 0.75 | 0.050 |
Prevalence of elevated lactic acid levels
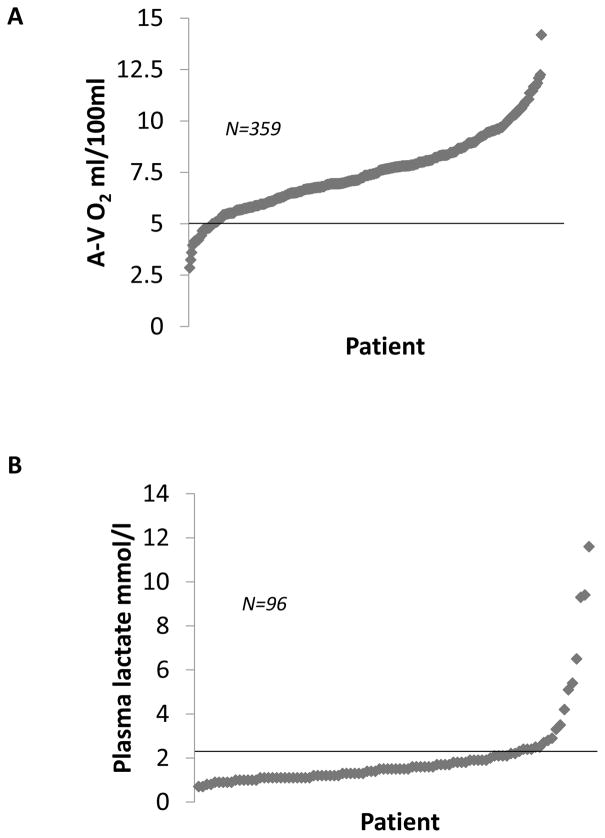
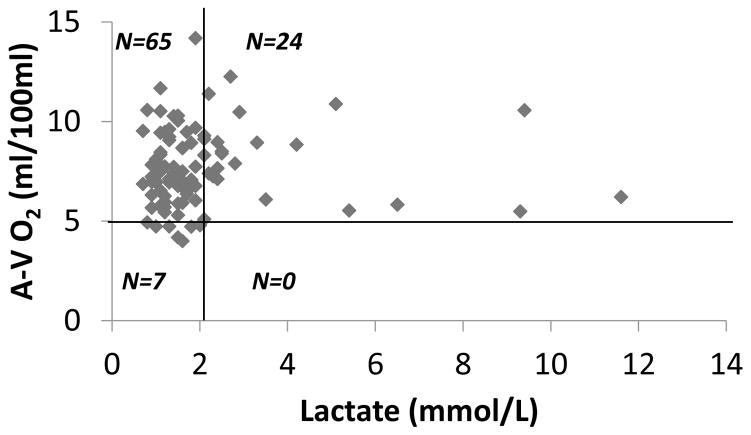
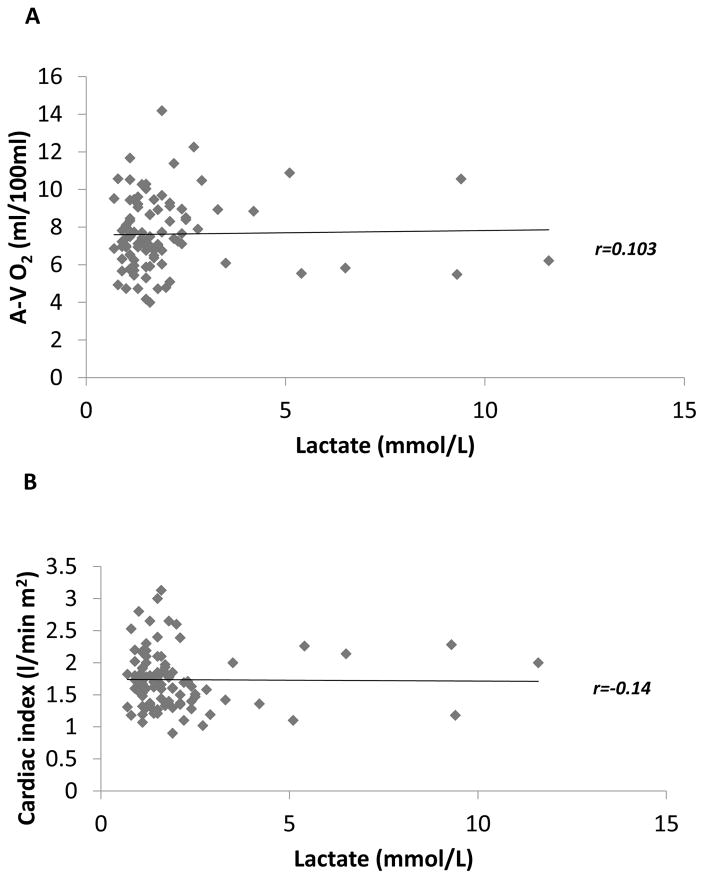
In order to determine the hemodynamic status of the cohort of patients in whom lactic acid measurements were performed, we analyzed the arterial-venous oxygen difference (A-V O2) in relation to the plasma lactate levels obtained prior to LVAD implantation. As shown in Figure 1A, 93% of patients in the study cohort had abnormally elevated A-V O2 difference (>5 ml/100ml), consistent with the reduced cardiac output in these patients with advanced heart failure. Remarkably, only 25% (95% CI 16.7–34.9) had elevated lactate levels of > 2.1 mmol/L (Figure 1B). To further explore the relationship between the A-V O2 and plasma lactate, we divided the patients into 4 groups: widened A-V O2 with normal lactate, widened A-V O2 with elevated lactate, normal A-V O2 with normal lactate, and normal A-V O2 with elevated lactate. As shown in Figure 2, the A-V O2 difference was widened in all patients who had elevated lactate levels; however, only 24 of 89 patients with widened A-V O2 (27%, 95% CI 18.1, 37.4) had elevated plasma lactate levels. Thus, < 30% of the patients who had evidence of a widened A-V O2 secondary to a decreased cardiac output had suggestive evidence that the decreased cardiac output possibly resulted in a shift from aerobic to anaerobic metabolism secondary to a decreased cardiac output. As an additional sensitivity analysis we also examined not only the correlation between the cardiac output and the circulating level of plasma lactate, but also the correlation between A-V O2 difference and the circulating level of plasma lactate. As shown in Figures 3A and 3B, the plasma lactate levels did not correlate with A-V O2 (r = 0.103; p = 0.32), nor did the cardiac index (r=0.14; p = 0.16) correlate with A-V O2.
Figure 1. A-V O2 and plasma lactate in the study cohort.
A) A-V O2 values from the 359 stage D heart failure patients in the study cohort. The upper limit of normal (A-V O2 = 5 mmol/100ml) is marked by an horizontal black line. 93% of patients (n=334) had an elevated AV O2; B) Plasma lactate levels measured within the study cohort. The upper limit of the reference range for the essay used (2.1 mmol/l) is marked by an horizontal black line. Only 25% of patients were found to have elevated plasma lactate.
Figure 2. Distribution of A-V O2 relative to plasma lactate.
The value of A-V O2 and the value of plasma lactate for each patient is represented on a scatter plot. The upper limit of normal A-V O2 (5 ml/100ml) is marked by an horizontal black line and the upper limit of normal plasma lactate (2.1 mmol/L) is marked by a vertical black line identifying 4 quadrants: normal lactate/normal A-V O2 (lower left, n=7), normal lactate and elevated A-V O2 (upper left, n=65), elevated A-V O2 and elevated lactate (upper right, n=24), elevated lactate and normal A-V O2 (lower right, n=0).
Figure 3. Correlation between plasma lactate and A-V O2 or Cardiac Index.
The values of plasma lactate were plotted as a function of A-V O2 (panel A) or Cardiac index (panel B). Spearman correlations were created to evaluate the linear relationship between the variables. As indicated by the linear trendline and the calculated r factor, plasma lactate had no correlation with A-V O2 or cardiac index.
Characteristics of patients with normal and elevated circulating plasma lactate levels
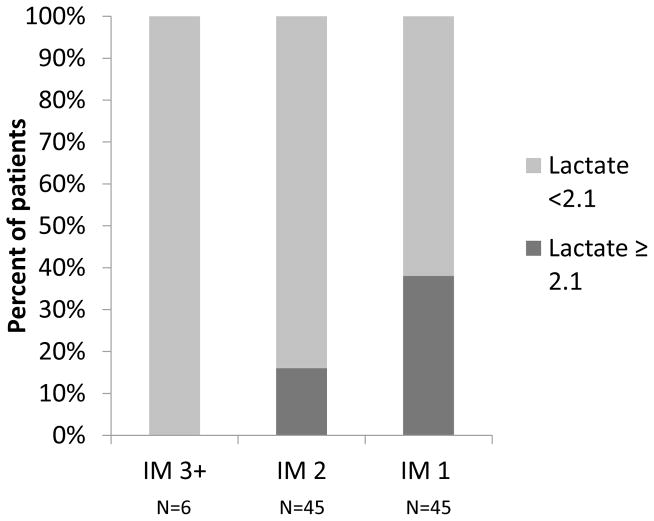
In order to gain further insight into the subsets of patients in whom resting cardiac output was insufficient to meet the metabolic demands of the peripheral metabolizing tissue, we compared the baseline characteristics of the patients with a widened A-V O2 with normal circulating levels of plasma lactate to patients with a widened A-V O2 and an elevated levels of circulating lactate. As shown in Table 2, there was no significant difference in hemoglobin concentration between the two groups. Patients with elevated plasma lactate had significantly higher INR (1.71 vs 1.45, p < 0.001), higher AST (126 vs 42 U/L, p < 0.013) and lower albumin level (3.23 vs 3.48 g/dl,p = 0.015) suggestive of liver disease despite no significant difference in RV function as suggested by similar RV TEI and RA pressures. In addition, while the INTERMACS levels were not significantly different between patients with a normal A-V O2 and patients with a widened A-V O2 (not shown), among patients with measured plasma lactate the proportion of patients with elevated lactate increased significantly (p-value for trend based on Cochran-Armitage test 0.006) as the INTERMACS classification worsened (Figure 4). As shown in Figure 4, none of the patients in INTERMACS class 3+ had elevated lactate levels, whereas 15.6 % of patients in INTERMACS class 2 and 37.8% of patients in INTERMACS class 1 heart failure had elevated lactate levels. This suggests that the prevalence of hyperpactatemiaincreasesin heart failure patients as the clinical condition worsens.
Table 2.
Comparison of Patients with a widened A-V O2 difference with normal and elevated plasma lactate levels
| Variable | Total (N=96) | Lactate ≥2.1 (N=24) | Lactate < 2.1 (N=72) | P-value |
|---|---|---|---|---|
| Age, years | 57.01 ± 11.04 | 53.98 ± 12.93 | 58.02 ± 10.24 | 0.12 |
| Caucasian, No. (%) | 70 (73%) | 15 (63%) | 55 (76%) | 0.20 |
| Male, No. (%) | 74 (77%) | 20 (83%) | 54 (75%) | 0.58 |
| Bmi, Kg/m2 | 29.77 ± 5.93 | 29.70 ± 5.36 | 29.79 ± 6.15 | 0.95 |
| Bsa, m2 | 2.07 ± 0.27 | 2.09 ± 0.27 | 2.06 ± 0.27 | 0.75 |
| Intermacs profile, No. (%) | 0.019 | |||
| . Intermacs 1 | 45 (47%) | 17 (71%) | 28 (39%) | |
| . Intermacs 2 | 45 (47%) | 7 (29%) | 38 (53%) | |
| . Intermacs 3+ | 6 (6%) | 0 (0%) | 6 (8%) | |
| AVO2 | 7.63 ± 1.91 | 8.23 ± 1.97 | 7.43 ± 1.86 | 0.08 |
| Lactate, Median (Q1, Q3) | 1.5 (1.1, 2.1) | 2.6 (2.3, 4.7) | 1.3 (1.1, 1.6) | <.001 |
| RA pressure, mmHg | 16.95 ± 8.68 | 17.79 ± 7.17 | 16.66 ± 9.16 | 0.58 |
| Wedge pressure, mmHg | 28.28 ± 8.15 | 27.52 ± 7.86 | 28.53 ± 8.28 | 0.61 |
| Cardiac index, L/min m2 | 1.73 ± 0.44 | 1.58 ± 0.40 | 1.79 ± 0.45 | 0.049 |
| Cardiac output, L/min | 3.62 ± 1.10 | 3.37 ± 1.04 | 3.70 ± 1.11 | 0.21 |
| LV EF, % | 17.53 ± 6.83 | 16.48 ± 4.97 | 17.83 ± 7.28 | 0.43 |
| LVEDD, cm | 6.82 ± 1.16 | 6.75 ± 1.24 | 6.84 ± 1.14 | 0.75 |
| RV TEI | 0.65 ± 0.32 | 0.58 ± 0.22 | 0.67 ± 0.34 | 0.17 |
| Continuous Inotropes | 92.7% | 91% | 92.5% | 0.74 |
| Vasopressors | 13.5% | 20% | 14.3% | 0.48 |
| INR | 1.51 ± 0.44 | 1.71 ± 0.40 | 1.45 ± 0.43 | 0.012 |
| Hemoglobin, mg/dl | 10.79 ± 2.07 | 11.21 ± 2.58 | 10.61 ± 1.82 | 0.23 |
| AST, U/L, Median (Q1, Q3) | 47.0 (30.0, 142.0) | 126.0 (41.5, 216.0) | 42.0 (30.0, 83.0) | 0.013 |
| Glucose, mg/dl | 173 ±74 | 175 ±60 | 173 ± 52 | 0.87 |
| Albumin, g/dl | 3.42 ± 0.47 | 3.23 ± 0.35 | 3.48 ± 0.49 | 0.026 |
| Creatinine, g/dl | 1.68 ± 0.75 | 1.72 ± 0.60 | 1.66 ± 0.79 | 0.71 |
Figure 4. Prevalence of elevated lactate by INTERMACS class.
The prevalence of patients with elevated plasma lactate is indicated among patients in INTERMACS class 3 or higher (IM 3+), patients in INTERMACS class 2 (IM 2) and patients in INTERMACS class 1 (IM 1). The prevalence of patients with elevated plasma lactate increases with worsening clinical status as indicated by lower INTERMACS class (p-value for trend based on Cochran-Armitage test 0.006).
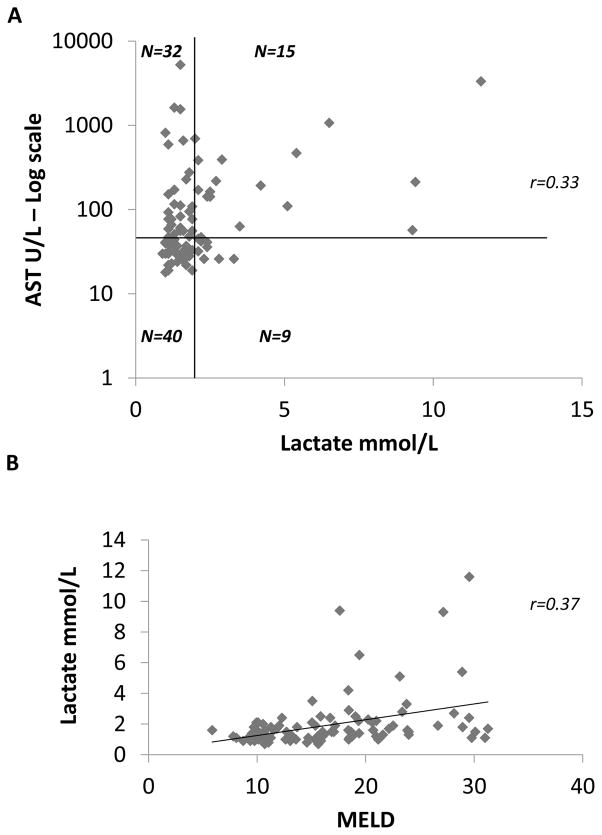
To investigate the role of liver dysfunction in relation to elevated plasma lactate levels, we evaluated the relationship between AST and lactate and the relationship between MELD (Model for End-stage Liver Disease) score and lactate. As shown in figure 5A, we found that out of 24 patients with elevated plasma lactate, only 15 had AST elevation. There was a weak correlation between plasma lactate levels and AST (r=0.33, p<0.001). We found also a weak correlation between MELD score and lactate levels (r=0.37, p<0.001, Figure 5B). These findings suggest that the observed elevations in lactate were not entirely the result of an impairment of hepatic clearance of plasma lactate.
Figure 5. Distribution of AST and MELD score relative to plasma lactate.
The value of plasma lactate weas plotted against Aspartate Amino Transferase in U/l and MELD score for each patient on a scatter plot. The relationship between AST and lactate is represented in panel A. The upper limit of normal AST (47 U/l) is marked by a horizontal black line and the upper limit of normal plasma lactate (2.1 mmol/L) is marked by a vertical black line identifying 4 quadrants: normal lactate/normal AST (lower left, n=40), normal lactate and elevated AST (upper left, n=32), elevated AST and elevated lactate (upper right, n=15), elevated lactate and normal AST (lower right, n=9). The values of AST are plotted on a log scale. There is a weak linear correlation between AST and plasma lactate as shown by a Spearman correlation coefficient r=0.33 (p<0.001). In panel B plasma lactate levels are plotted against MELD score. There is a weak linear correlation also between MELD score and plasma lactate as shown sy a Spearman correlation coefficient r=0.37 (p<0.001).
DISCUSSION
The major new and important finding of this study is that the prevalence of lactic acidemia is surprisingly low (~25%) among a cohort of patients with stage D heart failure who had a depressed cardiac output and decreased oxygen delivery to the peripheral metabolizing tissues. Two related lines of evidence support this statement. First, although the A-V O2 difference was widened in all patients who had elevated lactate levels, only 24 of 89 patients with widened A-V O2 difference had elevated plasma lactate levels, suggesting that a severely depressed cardiac output in heart failure patients is not invariably associated with a shift from aerobic to anaerobic metabolism in peripheral tissues (Figure 2). Second, there was no correlation between cardiac index and the periperhal lactate levels (Figure 3B). Indeed, we observed that the proportion of patients with elevated lactate increased significantly as the INTERMACS classification worsened (Figure 4), suggesting that increased lactate production is a very late event in subset of patients with Stage D heart failure who have a depressed cardiac output and impaired oxygen delivery to the periphery.
Elevated Lactate Acid Levels in Heart Failure
Lactate is produced by most tissues in the human body, with the highest level of production found in skeletal muscle. Under normal conditions, lactate is rapidly cleared by the liver with a small amount of additional clearance by the kidneys. Under aerobic conditions, glycolysis in the cytoplasm produces the intermediate metabolite pyruvate, which is converted to acetyl CoA to enter the Kreb’s cycle, bypassing the production of lactate. Under anaerobic conditions, pyruvate is converted to lactic acid by lactate dehydrogenase (LDH), which then feeds into the Cori cycle as a substrate for gluconeogenesis.12 Plasma lactate concentrations represent a balance between lactate production and lactate clearance, which is mainly the result of liver metabolism which removes ~ 70% of lactate.12 Cohen and Woods divided lactic acidosis into 2 categories, type A and type B.13 Type A lactic acidosis is associated with poor tissue perfusion and/or oxygenation of blood, and can be caused by overproduction of lactate or the underutilization of lactate. In type B lactic acidosis there is no evidence of poor tissue perfusion and/or oxygenation, and the accumulation of plasma lactate is the result of impaired clearance.12 or example, in septic shock the initial presentation is often associated with tissue hypoperfusion with enhanced lactate production. However, with aggressive fluid resuscitation, lactic acidosis may often persist in the absence of tissue hyoperfusion, because of altered oxidative phosphorylation, decreased clearance and/or leukocyte production of lactate caused by sustained increased inflammatory stimuli. One purported mechanism for the development of lactic acidosis in heart failure is that when the cardiac output is no longer sufficient to supply adequate oxygen to the metabolizing tissues, and the ability of the peripheral tissues to increase the extraction of oxygen from the blood is exhausted, that tissue hypoxia ensues, with the result that anaerobic glycolysis ensues, and pyruvate is converted to lactate. Liver dysfunction may also contribute to increased lactate levels, either through decreased clearance secondary to hypoperfusion of the liver, or through increased production secondary to enhanced intrahepatic anaerobic glycolysis.
Although lactic acidosis has been reported previously in resting heart failure patients, 14 no prior study, to our knowledge, has determined whether the lactic acidosis in heart failure patients is type A or type B. Although our retrospective analysis cannot definitely identify what the determinants of lactic acidemia were, our data suggest that patients with heart failure have a mixture of type A and type B lactic acidosis. Two indirect observations support this point of view. First, the widened A-VO2 difference did not correlate with lactic acid levels (Figure 3A), suggesting that the elevated lactic acid levels were not entirely due to increased lactate production by hypoxic peripheral tissues. Second, the observation that patients with increased plasma lactate levels had higher INR, higher AST and lower albumin, together with the weak correlation observed between AST levels or the MELD score and lactic acid levels suggest that at least some of the observed increase in lactate may have been secondary to impaired liver metabolism of peripheral circulating lactate (i.e. type B lactic acidosis). Although our INTERMACS classification data suggests that most of the patients included in this study were not in refractory shock, we cannot exclude the possibility that the increased lactate levels were secondary to increased intrahepatic anaerobic glycolysis, with hepatic lactate production.
Aside from the retrospective nature of this study, several other limitations warrant further discussion. First, we were able to identify pre-operative plasma lactate levels in 96 of the 359 patients in our patient cohort. As denoted by the lower INTERMACS profiles, the 96 patients with lactate levels represent a subgroup of “sicker patients,” in whom plasma lactate levels were obtained clinically as a surrogate for illness severity and/or to evaluate the response to therapeutic interventions. Given that the elevated plasma lactate levels were not obtained in patients who were felt to be “less sick,” it is likely that the true prevalence of lactic academia in stage D heart failure patients is considerably lower than the 25% observed in the present study. Second, it should be kept in mind that plasma lactate is part of the assessment made when assigning INTERMACS class to pre LVAD patients15 and therefore the relation between prevalence of plasma lactate and INTERMACS class that we plot in figure 4 is the relationship between two variables that are not fully independent. In addition, systemic lactate does not necessarily reflect the production of lactate in all the different metabolizing tissues. Therefore, it is possible that some of the patients with normal lactate had small areas of regional increase in lactate production that were not detected by our measurements of peripheral blood lactate levels. Further, we cannot exclude the formal possibility that the normal lactate levels observed in the patients with advanced heart failure was secondary to increased clearance.
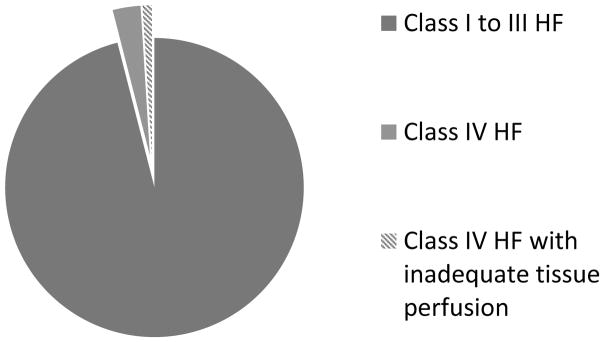
Although the findings of the present study provide the first direct confirmation of the thesis that the failing heart is unable to support the metabolic demands of the body in heart failure, the more salient finding of this study is that this definition pertains to a remarkably small subset of patients who have end-stage heart failure, and thus this definition is unlikely to help clinicians and/or scientists understand mechanisms of disease progression in heart failure, which is a sine qua non for developing new therapies. Indeed, given that ~ 4% of all heart failure patients are in NYHA class IV,16 and given that ~ 25% of the patients in the present study of patients with Stage D heart failure had elevated lactate levels, a first order approximation of the applicability of this definition is that it applies to ~ 1% of the total population of heart failure patients (Figure 6). While the development of conceptual models of complex diseases will remain a cornerstone of the scientific approach to clinical medicine now and for the indefinite future, the findings of this study serve the heuristic purpose of highlighting the importance of the continual need to validate historical models of complex disease in contemporary patient populations.
Figure 6. Prevalence of HF patients meeting the classic definition of Heart Failure.
It has been estimated that only 4% of all heart failure patients are in NYHA class IV (15)(gray slices). Since only ~ 25% of the patients in the present study of Stage D patients had elevated lactate levels, it is estimated that only 1% of HF patients fail to support the metabolic demands of their tissues at rest (shaded grey slice)
Acknowledgments
FUNDING
This study was supported in part by research funds from the National Institutes of Health (NIH grant U10 HL110309, Heart Failure Network), (NIH Grant T32HL110837).
Footnotes
Conflicts of interest: none declared
References
- 1.Mann DL. The evolution of modern theory and therapy for heart faillure. Prog Ped Cardiol. 2014;37:9–12. [Google Scholar]
- 2.Braunwald E. Heart failure. JACC Heart Fail. 2013;1:1–20. doi: 10.1016/j.jchf.2012.10.002. [DOI] [PubMed] [Google Scholar]
- 3.Francis GS, Wilson Tang WH, Walsh RA. Pathophysiology of Heart Failure. In: Fuster V, Walsh RA, Harrington RA, editors. Hurst’s The Heart. 13. McGraw-Hill Companies; 2011. [Google Scholar]
- 4.Henes J, Rosenberger P. Systolic heart failure: diagnosis and therapy. Curr Opin Anaesthesiol. 2016;29:55–60. doi: 10.1097/ACO.0000000000000270. [DOI] [PubMed] [Google Scholar]
- 5.Hobbs B. Heart Failure. In: Carey WD, editor. Cleveland Clinic current Clinical Medicine. 2. Saunders Elsevier; 2010. [Google Scholar]
- 6.Swirski FK, Nahrendorf M. Leukocyte behavior in atherosclerosis, myocardial infarction, and heart failure. Science. 2013;339:161–166. doi: 10.1126/science.1230719. [DOI] [PMC free article] [PubMed] [Google Scholar]
- 7.Broberg CS, Burchill LJ. Myocardial factor revisited: The importance of myocardial fibrosis in adults with congenital heart disease. Int J Cardiol. 2015;189:204–10. doi: 10.1016/j.ijcard.2015.04.064. [DOI] [PMC free article] [PubMed] [Google Scholar]
- 8.Barcena J, Fang J. Heart Failure. In: McKean S, Ross JJ, Dressler DD, Brotman D, Ginsberg J, editors. Principles and Practice of Hospital Medicine. The McGraw-Hill Companies; 2012. [Google Scholar]
- 9.Wagner S, Cohn K. Heart failure. A proposed definition and classification. Arch Intern Med. 1977;137:675–678. doi: 10.1001/archinte.137.5.675. [DOI] [PubMed] [Google Scholar]
- 10.Harris PA, Taylor R, Thielke R, Payne J, Gonzalez N, Conde JG. Research electronic data capture (REDCap)--a metadata-driven methodology and workflow process for providing translational research informatics support. J Biomed Inform. 2009;42:377–81. doi: 10.1016/j.jbi.2008.08.010. [DOI] [PMC free article] [PubMed] [Google Scholar]
- 11.Kern MJ, Kapur NJ. Hemodynamic Data. In: Kern MJ, PSMJL, editors. Cardiac Catheterization Handbook. Elsevier Health Sciences; 2015. [Google Scholar]
- 12.Phypers B, Pierce T. Lactate physiology in health and disease. 6. 2006. pp. 128–132. [Google Scholar]
- 13.Cohen RWH. Clinical and Biochemical Aspects of Lactic Acidosis. Oxford: Blackwell Scientific Publications; 1976. [Google Scholar]
- 14.Ander DS, Jaggi M, Rivers E, Rady MY, Levine TB, Levine AB, Masura J, Gryzbowski M. Undetected cardiogenic shock in patients with congestive heart failure presenting to the emergency department. Am J Cardiol. 1998;82:888–91. doi: 10.1016/s0002-9149(98)00497-4. [DOI] [PubMed] [Google Scholar]
- 15.Stevenson LW, Pagani FD, Young JB, Jessup M, Miller L, Kormos RL, Naftel DC, Ulisney K, Desvigne-Nickens P, Kirklin JK. INTERMACS profiles of advanced heart failure: the current picture. J Heart Lung Transplant. 2009;28:535–541. doi: 10.1016/j.healun.2009.02.015. [DOI] [PubMed] [Google Scholar]
- 16.Thackray SD, Witte KK, Nikitin NP, Clark AL, Kaye GC, Cleland JG. The prevalence of heart failure and asymptomatic left ventricular systolic dysfunction in a typical regional pacemaker population. Eur Heart J. 2003;24:1143–52. doi: 10.1016/s0195-668x(03)00199-4. [DOI] [PubMed] [Google Scholar]


