

Abstract
Study Objectives:
Home sleep apnea testing (HSAT) is increasingly available for diagnosing obstructive sleep apnea (OSA). One key limitation of most HSAT involves the lack of sleep staging, such that the respiratory event index is calculated using the total recording time (TRT) rather than total sleep time (TST).
Methods:
We performed a retrospective analysis of n = 838 diagnostic polysomnography (PSG) nights from our center; n = 444 with OSA (4% rule, apneahypopnea index (AHI) ≥ 5), and n = 394 with AHI < 5. We recalculated the AHI using time in bed (TIB) instead of TST, to assess the predicted underestimation risk of OSA severity.
Results:
Of all the patients with OSA, 26.4% would be reclassified as having less severe or no OSA after recalculating the AHI using TIB rather than TST. Of the n = 275 with mild OSA, 18.5% would be reclassified as not having OSA. The risk of underestimation was higher in those with moderate or severe OSA.
Of the n = 119 moderate OSA cases, 40.3% would be reclassified as mild, and of the n = 50 severe OSA cases, 36.0% would be reclassified as moderate. Age strongly correlated with the degree of underestimation of the AHI, because age was significantly correlated with time awake during PSG.
Conclusions:
The risk of sleep apnea underestimation is predicted to be substantial in a tertiary sleep center population. Phenotyping errors included risk of falsely negative results (from mild to normal), as well as category errors: moderate or severe moving to mild or moderate severity, respectively. Clinicians should recognize this underestimation limitation, which directly affects diagnostic phenotyping and thus therapeutic decisions.
Commentary:
A commentary on this article appears in this issue on page 531.
Citation:
Bianchi MT, Goparaju B. Potential underestimation of sleep apnea severity by at-home kits: rescoring in-laboratory polysomnography without sleep staging. J Clin Sleep Med. 2017;13(4):551–555.
Keywords: diagnosis, prediction, underestimation
INTRODUCTION
The limitations of home sleep apnea testing (HSAT) kits are well described, and include lack of leg movements, lack of sleep staging, lack of body position tracking (in most devices1), and lack of general validation in populations beyond straightforward high-probability obstructive sleep apnea (OSA) cases.1 One key limitation of HSAT for diagnosing sleep apnea is that the devices generally do not include electroencephalography (EEG) to score sleep-wake stages. In fact, only the ARES system (SleepMed, Palm Beach, Florida, United States) does this, through limited frontal channels.2 The remaining devices either use total recording time (TRT) as the denominator to calculate a respiratory event index, or actigraphy to estimate total sleep time (TST). Actigraphy does not substitute for EEG, because it is well known to overestimate sleep when movement is the only input due to quiet wake appearing similar to sleep. HSAT kits are known to underestimate the severity of sleep-disordered breathing.1,3 Underestimation is at least in part because the respiratory event rate is calculated using a denominator of the TRT and not TST, which is necessarily equal to or lower than the TRT. Using patient estimates of TST as an adjunctive value may not solve this problem, as many publications have documented heterogeneity and variability with both overestimation and underestimation of subjective TST (sTST) in clinical contexts.4–6
BRIEF SUMMARY
Current Knowledge/Study Rationale: Limited channel at-home testing kits for sleep apnea diagnosis are increasingly available. The kits are known to underestimate sleep apnea severity, in part because of lack of sleep staging to provide total sleep time.
Study Impact: The results predict that home sleep apnea testing substantially underestimates sleep apnea indices, resulting in risk of falsely negative results and lower severity categorization that might motivate care decisions. Utilizing self-reported sleep duration does not mitigate the risk.
The specific challenge of underestimation of sleep apnea severity presents important clinical implications. The potential for falsely labeling a patient as having normal breathing when in fact that person has sleep apnea is of key importance. Therefore, the American Academy of Sleep Medicine (AASM) guidelines recommend that negative HSAT results of adequate quality be confirmed with in-laboratory polysomnography (PSG).7 This is especially relevant when HSAT is used in high pretest probability cases. In addition to the risk for falsely negative results, there is a related risk of underestimating category severity for someone in whom OSA has been diagnosed based on HSAT. For example, category underestimation of a true moderate case falsely labeled as mild might lead to different treatment pathways, including the option for no treatment depending on the symptoms and comorbidities.8 Likewise, true severe cases falsely labeled as moderate might also drive therapy decisions. This might cause a physician to exclude surgical treatment options (that often are reserved for severe cases), or choose a treatment option that should be used on mild to moderate cases, such as oral appliance therapy. Therefore, the risks of underestimation are diverse. We undertook the current study in a large retrospective cohort to estimate such risks by rescoring in-laboratory PSG data as if they are HSAT kits.
METHODS
We analyzed a retrospective sample of 838 diagnostic PSG tests performed in our clinical sleep laboratory, irrespective of indication, although most referrals to our center are for evaluation of OSA. The time frame was 2010 to 2012, which is mostly before recent insurance changes affected in-home versus in-laboratory testing decisions. The Institutional Review Board approved the retrospective analysis of our clinical sleep laboratory database without requiring consent. PSG was performed according to AASM standards and scored by experienced registered technologists. We use the 4% desaturation rule for defining hypopnea; we also rescored the cohort according to the 3% desaturation rule. Because our standard reports only consider 4%, this required retrospective rescoring, and some studies could not be rescored for technical reasons (n = 398 still available that met criteria of AHI > 5 using a 3% desaturation definition). Subjective sleep duration is queried after each PSG, using the question “How long do you think you slept?” We previously reported internal inconsistency when sleep duration is reported this way, versus indirectly (by clock time),9 but we did not separately analyze that factor here. The cohort included n = 394 without OSA based on the criteria of AHI < 5, and n = 444 with OSA based on the criteria of AHI ≥ 5, using the 4% desaturation rule for defining hypopnea. We prespecified exclusions of age younger than 18 years, missing sTST estimation, nights with less than 60 minutes of objective TST (oTST), and any nights with sTST estimate of 30 minutes or less. We recalculated the AHI values based on the time in bed (TIB) for each subject with OSA using the criteria of AHI ≥ 5 (n = 444). TIB excludes disconnections/out of bed time (eg, using the restroom). For recalculation of the AHI in the no-OSA group based on the sTST as the denominator, we excluded n = 33 with sTST > TIB (this would be obvious from HSAT evaluation clinically). Nonparametric methods were used because of generally nonnormal distribution of variables; significance was defined by a value of P < .05.
RESULTS
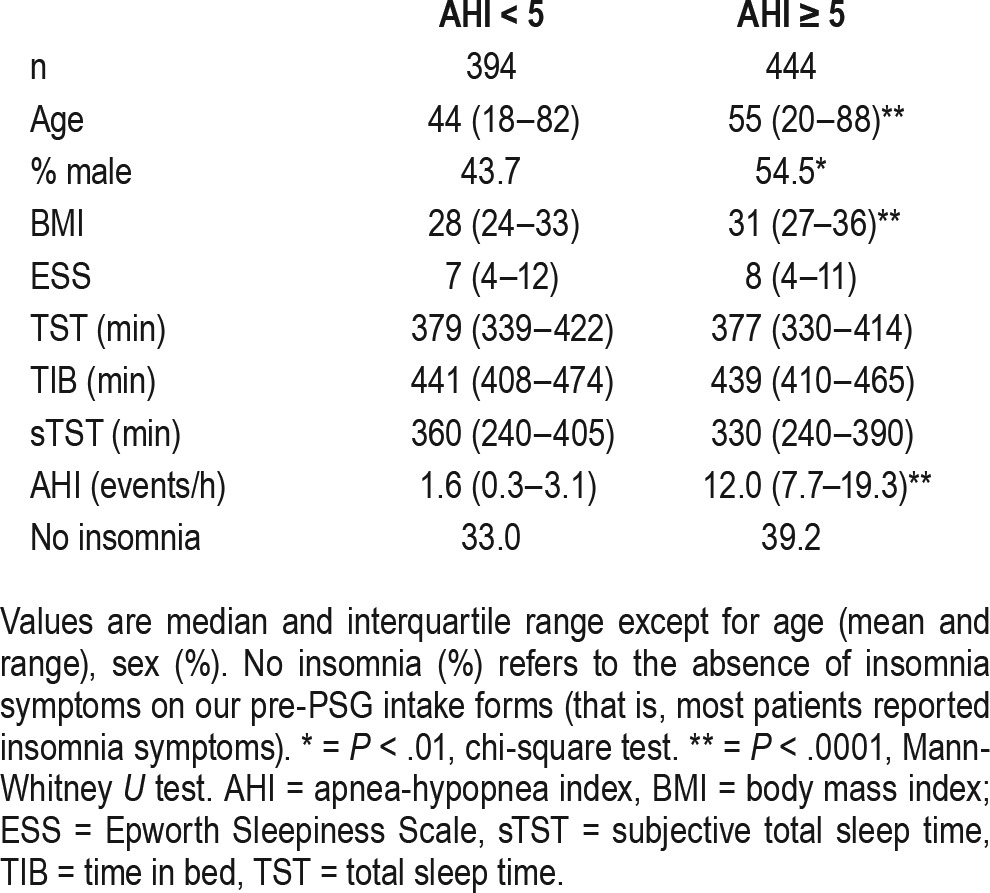
Table 1 shows baseline characteristics of the two cohorts, with or without OSA defined solely by the AHI value (≥ 5 versus < 5) using the 4% desaturation rule for defining hypopnea. The expected differences associated with OSA were seen: the AHI > 5 cohort was older, more likely male, had a higher body mass index (BMI), and higher AHI. Importantly, the oTST and the recording time of PSG (TIB) did not significantly differ between the groups.
Table 1.
Clinical characteristics.
For the group without OSA, further category underestimation is not possible, though the normal-range AHI values decrease further when using TIB instead of oTST; this group had similar mean time awake after sleep onset compared to the OSA group (50 minutes versus 54 minutes; not shown). For the group with OSA, the recalculated AHI based on TIB rather than oTST resulted in severity category reclassification in 26.4% of patients (Figure 1). Most of these were “one-level” reclassifications (eg, mild cases to no OSA, and moderate cases to mild). There were similar levels of reclassification when the cohort with OSA was divided into subcategories based on self-reported insomnia symptoms (data not shown). Age was significantly correlated with the difference between the AHI and the recalculated AHI based on TIB (Spearman R = 0.36, P < .0001), which was accounted for by a strong correlation of age with increased time awake during PSG (R = 0.39, P < .0001). Neither sex nor BMI nor TIB were correlated with the AHI difference upon recalculation.
Figure 1. Reclassification based on scoring polysomnography using time in bed as denominator for the apnea-hypopnea index calculation.
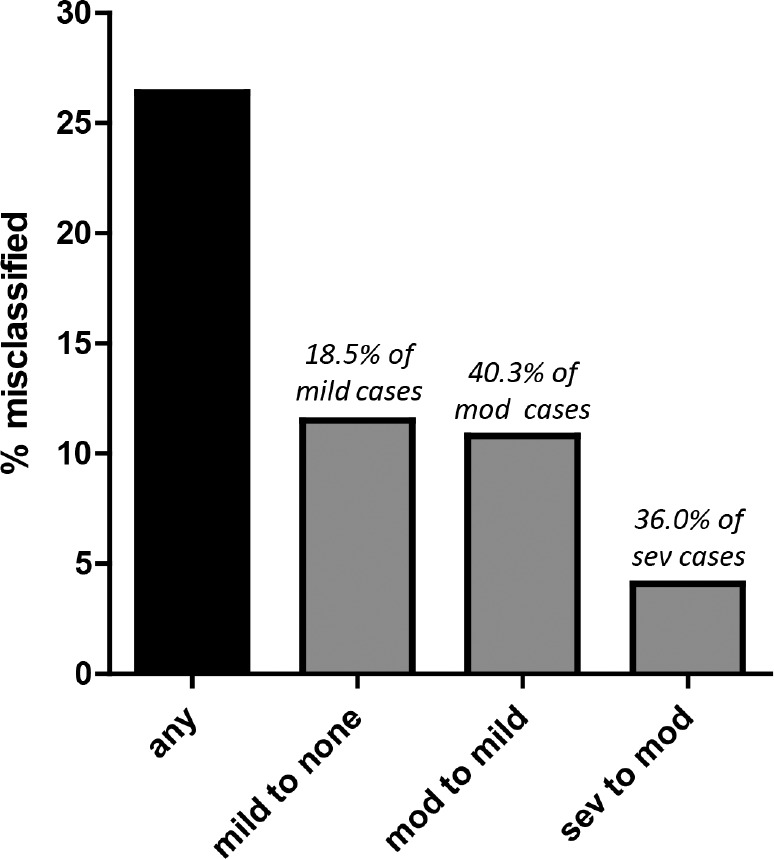
Bar chart shows the percentage of the cohort (n = 444) with obstructive sleep apnea during clinical polysomnography, with apnea-hypopnea index ≥ 5 using the objective total sleep time as the denominator (standard clinical scoring) that are reclassified after scoring based on time in bed as the denominator (as if undergoing home sleep apnea testing). 26.4% moved at least one category less severe (black bar). Approximately 10% of the cohort moved specifically from mild to none, which represents approximately 18% of mild cases (51 of 275). Approximately 10% of the cohort moved from moderate to mild, but this represents approximately 40% of the moderate cases (48 of 119). A smaller percent of the cohort moved from severe to moderate, but this represents 36% of severe cases (18 of 50). mod = moderate, sev = severe.
One potential solution to the issue of underestimation based on TIB is to use sTST in hopes that the value is closer to the oTST than the TIB. However, in both cohorts (with and without OSA) the variability of sTST relative to oTST was substantial (Figure 2A and 2B). In this analysis, we focus on the risk of overestimating the AHI when sTST is used in the cohort without OSA. Thus, we recalculated the AHI using the sTST instead of the TIB. We used for this a subset (n = 361) of the group without OSA after excluding n = 33 in whom the sTST was higher than the TRT, which would be evident in an HSAT setting and thus the sTST would be disregarded. In this group, we observe that n = 36 (10%) would be reclassified as mild OSA (AHI 5–15), and n = 2 (0.5%) would be reclassified as moderate OSA (Figure 2C), for a total of 10.5% being reclassified from none to “any” OSA. For the OSA group, in which we also analyzed only a subset (n = 397) after excluding those in whom sTST was greater than TIB, we observed that n = 75 (16.9%) moved up at least one severity category. The specific category movements are shown in Figure 2C, with the most common movement being either mild to moderate or moderate to severe.
Figure 2. Reclassification based on scoring polysomnography using subjective total sleep time as the denominator for the apnea-hypopnea index calculation.
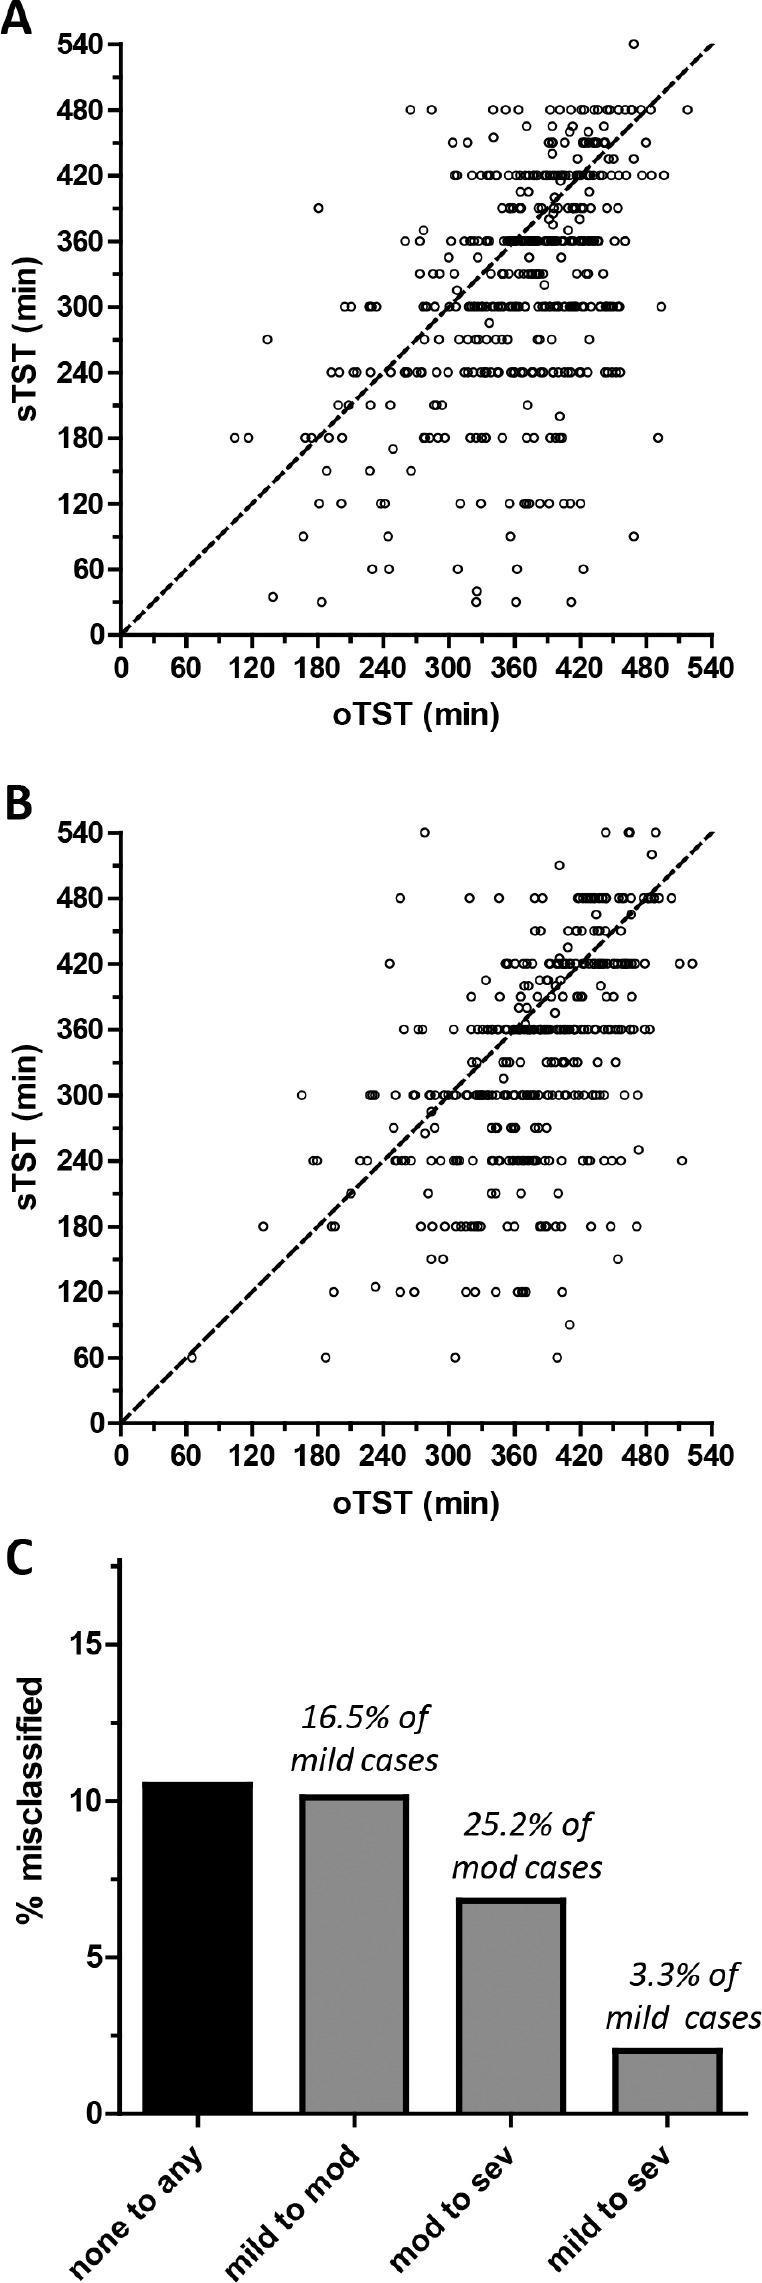
Scatterplots show the subjective total sleep time (sTST, y-axis) and objective total sleep time (oTST, x-axis) pairing for each subject in the cohort with obstructive sleep apnea (A), or without obstructive sleep apnea (B). The diagonal dotted line is the identity line for reference. (C) The percentage of the cohort misclassified by type of misclassification. Above each bar is the percentage of each severity category that was misclassified. mod = moderate, sev = severe.
We also examined the results using less stringent event scoring. The lack of EEG prevents scoring of non-hypoxic respiratory event-related arousals. Sleep-disordered breathing of this nature would thus be underestimated by HSAT. Among those with recalculated AHI < 5, it was observed that 66.4% had RDI > 5, and 22.9% had RDI > 15. These individuals would not be recognized by level 3 monitors, most of which lack EEG. We also re-analyzed the cohort using the AASM criteria of 3% desaturation for scoring hypopneas. Of those with a mild range AHI (≥ 5 to < 15), 38 of 264 (14.4%) would have been reclassified as AHI < 5 (no OSA). Of those with a moderate range AHI (≥ 15 to < 30), 32 of 108 (29.6%) would have been reclassified as AHI < 15. Of those with AHI > 30, 8 of 25 (32%) would have been reclassified as AHI < 30.
Finally, we evaluated the prevalence of elevated periodic limb movements of sleep (PLMS), which are not measured by current level 3 or level 4 HSAT devices. We observed elevated PLMS index values in a substantial subset of this cohort, with 28.5% having an index > 15 events/h, and 15.5% with > 30 events/h. This proportion was similar when examined in subsets above or below a recalculated AHI (4%) value of 5, and similar to our recent report in a sleep apnea cohort during diagnostic and titration PSG nights.10 For those with AHI < 5, the PLMS index was > 15 in 26.3% and > 30 in 13.8%. For those with AHI > 5, the PLMS index was > 15 in 31.0% and > 30 in 17.4%.
DISCUSSION
The current study indicates that the common method of using TRT as the denominator in HSAT would result in substantial underestimation of OSA severity when applied to a large clinical cohort of diagnostic PSG. The extent of AHI underestimation affected patients at all OSA severity levels, and was strongly correlated with age, because older age was strongly correlated with time awake during PSG and thus extent of AHI underestimation. The results emphasize that lack of sleep-wake staging in most HSAT devices carries substantial risk of OSA underestimation. Using sTST instead of the TIB does not mitigate the OSA underestimation risk. In addition, sTST introduces a potential AHI overestimation risk, if individuals underestimate sleep duration compared to objective measures. Clinicians should use caution when interpreting HSAT results, and recognize that OSA underestimation directly affects diagnostic phenotyping and thus therapeutic decisions.
The diagnosis of OSA carries uncertainty whether HSAT or in-laboratory PSG is performed. A single night of either method is an inherently undersampled view of a pathophysiology that may vary night to night.11,12 Underestimation of OSA severity is arguably the more important risk than overestimation, though this has not been formally studied. The underestimation related to use of TRT instead of TST as the denominator is distinct from other important inferential challenges related to the sensitivity and specificity of HSAT to detect OSA. This includes, for example, risks associated with automated versus manual scoring,3 as well as inferential risks13,14 when HSAT is conducted in low-risk populations, and falsely positive results are more likely, whereas in high-risk populations falsely negative results are more likely.
Although the risk of falsely negative results carries clear implications, clinical risk is potentially incurred even in those who meet criteria for OSA with AHI > 5. OSA severity misclassification between mild, moderate, and severe may compromise care planning. First, OSA severity category predicts medical risk.15–17 Medical risk perception and baseline AHI severity may motivate patients to pursue treatment in the setting of a new diagnosis.18,19 As much uncertainty surrounds the effect of and need to treat mild OSA, assigning this severity category by HSAT could be falsely reassuring if the HSAT underestimated a true moderate severity case. If HSAT is used to assess severity after an intervention such as weight loss, dental appliance, or surgery, the results may be falsely optimistic compared to baseline assessments of severity made by PSG. OSA severity may inform the choice of non-positive airway pressure (PAP) options for those who cannot or will not comply with PAP. For example, dental appliance therapy is mainly recommended for mild to moderate cases (although recent evidence suggests some consideration for severe cases20). Furthermore, surgical approaches that might be more favorable for severe cases may not be considered for those falsely categorized as moderate. Although weight loss should be recommended to any patient with OSA and elevated BMI, it may be that those with mild OSA could reasonably choose a trial of weight loss as their sole initial therapy.
Several potential solutions may mitigate this underestimation risk attributable to using TRT rather than oTST as the denominator for calculating severity. Advances in quantifying sleep through non-EEG signals, such as autonomic physiology,21–23 may be more easily implemented than, for example, adding EEG channels to existing systems. However, there is little incentive for HSAT device manufacturers to pursue such improvements. Until and unless such methods enjoy wide clinical implementation, practitioners should be cautious when interpreting HSAT results. Even when the TRT and the sTST seem to be aligned, because of unreliability of sTST and the lack of an independent gold standard in HSAT settings, uncertainty remains regarding underestimation of OSA.
In addition to this OSA underestimation issue, another common sleep disturbance will also be missed by level 3 or level 4 kits. PLMS occurred often in patients from our laboratory, whether or not the recalculated AHI values would support a diagnosis of OSA. PLMS are of clinical relevance for several potential reasons. Epidemiology studies have linked PLMS to cardiovascular and cerebrovascular risk.24 Occult PLMS may contribute to sleep fragmentation and symptoms of insomnia or nonrefreshing sleep. This treatable cause of sleep disturbance is not assessed by currently available HSAT devices, which do not include limb sensors. Evaluation of PLMS with PSG should be considered in patients with ongoing symptoms despite treatment of OSA diagnosed by HSAT.
This retrospective study has limitations that could in principle be addressed in future work. The tertiary referral nature and heterogeneity of sleep and systemic pathology may not generalize to other clinical settings. For example, a recent study suggested minimal misclassification in patients with OSA when rescoring the AHI based on self-reported TST.25 Other work has suggested that actigraphy concurrent with home testing did not substantially alter the scoring results,26 although this may be in part due to actigraphy overestimating oTST, which is essentially the risk with using TIB as detailed here. Another point of uncertainty involves the relationship between in-laboratory oTST relative to at-home oTST within individuals. Some patients may have more consolidated sleep (higher efficiency) at home than in the laboratory because of first-night effect.27 Other patients, by contrast, will have the opposite pattern, possibly because of the so-called reverse first-night effect such as may occur in psychophysiological insomnia.28 The clinical challenge remains that when presented with an individual patient and his or her HSAT report, there is no independent predictor or gold standard to decide whether using TIB or sTST would be a reasonable estimate for calculating the OSA severity index.
DISCLOSURE STATEMENT
This was not an industry supported study. Dr. Bianchi has received funding from Massachusetts General Hospital, the Center for Integration of Medicine and Innovative Technology, the Milton Family Foundation, and currently receives funding from the Department of Neurology, the MGH-MIT Grand Challenge, and the American Sleep Medicine Foundation. Dr. Bianchi has a patent pending on a home sleep monitoring device. Dr. Bianchi received travel funding from Servier; has consulting and research agreements with MC10, Insomnisolv, and McKesson; is a medical monitor for Pfizer; and has provided expert testimony in sleep medicine. Dr. Goparaju has indicated no financial conflicts of interest.
ABBREVIATIONS
- AASM
American Academy of Sleep Medicine
- AHI
apnea-hypopnea index
- ARES
Apnea Risk Evaluation System
- BMI
body mass index
- EEG
electroencephalography
- HSAT
home sleep apnea testing
- OSA
obstructive sleep apnea
- oTST
objective total sleep time
- PAP
positive airway pressure
- PLMS
periodic limb movements of sleep
- PSG
polysomnography
- RDI
respiratory disturbance index
- sTST
subjective total sleep time
- TIB
time in bed
- TRT
total recording time
- TST
total sleep time
REFERENCES
- 1.Collop NA, Tracy SL, Kapur V, et al. Obstructive sleep apnea devices for out-of-center (OOC) testing: technology evaluation. J Clin Sleep Med. 2011;7(5):531–548. doi: 10.5664/JCSM.1328. [DOI] [PMC free article] [PubMed] [Google Scholar]
- 2.Westbrook PR, Levendowski DJ, Cvetinovic M, et al. Description and validation of the apnea risk evaluation system: a novel method to diagnose sleep apneahypopnea in the home. Chest. 2005;128(4):2166–2175. doi: 10.1378/chest.128.4.2166. [DOI] [PubMed] [Google Scholar]
- 3.Aurora RN, Swartz R, Punjabi NM. Misclassification of OSA severity with automated scoring of home sleep recordings. Chest. 2015;147(3):719–727. doi: 10.1378/chest.14-0929. [DOI] [PMC free article] [PubMed] [Google Scholar]
- 4.Bianchi MT, Williams KL, McKinney S, Ellenbogen JM. The subjective-objective mismatch in sleep perception among those with insomnia and sleep apnea. J Sleep Res. 2013;22(5):557–568. doi: 10.1111/jsr.12046. [DOI] [PubMed] [Google Scholar]
- 5.Castillo J, Goparaju B, Bianchi MT. Sleep-wake misperception in sleep apnea patients undergoing diagnostic versus titration polysomnography. J Psychosom Res. 2014;76(5):361–367. doi: 10.1016/j.jpsychores.2014.03.001. [DOI] [PMC free article] [PubMed] [Google Scholar]
- 6.Vanable PA, Aikens JE, Tadimeti L, Caruana-Montaldo B, Mendelson WB. Sleep latency and duration estimates among sleep disorder patients: variability as a function of sleep disorder diagnosis, sleep history, and psychological characteristics. Sleep. 2000;23(1):71–79. [PubMed] [Google Scholar]
- 7.Collop NA, Anderson WM, Boehlecke B, et al. Clinical guidelines for the use of unattended portable monitors in the diagnosis of obstructive sleep apnea in adult patients. Portable Monitoring Task Force of the American Academy of Sleep Medicine. J Clin Sleep Med. 2007;3(7):737–747. [PMC free article] [PubMed] [Google Scholar]
- 8.Epstein LJ, Kristo D, Strollo PJ, Jr, et al. Clinical guideline for the evaluation, management and long-term care of obstructive sleep apnea in adults. J Clin Sleep Med. 2009;5(3):263–276. [PMC free article] [PubMed] [Google Scholar]
- 9.Alameddine Y, Ellenbogen JM, Bianchi MT. Sleep-wake time perception varies by direct or indirect query. J Clin Sleep Med. 2015;11(2):123–129. doi: 10.5664/jcsm.4456. [DOI] [PMC free article] [PubMed] [Google Scholar]
- 10.Moro M, Goparaju B, Castillo J, Alameddine Y, Bianchi MT. Periodic limb movements of sleep: empirical and theoretical evidence supporting objective at-home monitoring. Nat Sci Sleep. 2016;8:277–289. doi: 10.2147/NSS.S101753. [DOI] [PMC free article] [PubMed] [Google Scholar]
- 11.Prasad B, Usmani S, Steffen AD, et al. Short-term variability in apneahypopnea index during extended home portable monitoring. J Clin Sleep Med. 2016;12(6):855–863. doi: 10.5664/jcsm.5886. [DOI] [PMC free article] [PubMed] [Google Scholar]
- 12.Ahmadi N, Shapiro GK, Chung SA, Shapiro CM. Clinical diagnosis of sleep apnea based on single night of polysomnography vs. two nights of polysomnography. Sleep Breath. 2009;13(3):221–226. doi: 10.1007/s11325-008-0234-2. [DOI] [PubMed] [Google Scholar]
- 13.Bianchi MT. Screening for obstructive sleep apnea: Bayes weighs in. Open Sleep J. 2009;2:56–59. [Google Scholar]
- 14.Bianchi MT. Evidence that home apnea testing does not follow AASM practice guidelines--or Bayes' theorem. J Clin Sleep Med. 2015;11(2):189. doi: 10.5664/jcsm.4476. [DOI] [PMC free article] [PubMed] [Google Scholar]
- 15.Lopez-Jimenez F, Sert Kuniyoshi FH, Gami A, Somers VK. Obstructive sleep apnea: implications for cardiac and vascular disease. Chest. 2008;133(3):793–804. doi: 10.1378/chest.07-0800. [DOI] [PubMed] [Google Scholar]
- 16.Peppard PE, Young T, Palta M, Skatrud J. Prospective study of the association between sleep-disordered breathing and hypertension. N Engl J Med. 2000;342(19):1378–1384. doi: 10.1056/NEJM200005113421901. [DOI] [PubMed] [Google Scholar]
- 17.Marshall NS, Wong KK, Cullen SR, Knuiman MW, Grunstein RR. Sleep apnea and 20-year follow-up for all-cause mortality, stroke, and cancer incidence and mortality in the Busselton Health Study cohort. J Clin Sleep Med. 2014;10(4):355–362. doi: 10.5664/jcsm.3600. [DOI] [PMC free article] [PubMed] [Google Scholar]
- 18.Wohlgemuth WK, Chirinos DA, Domingo S, Wallace DM. Attempters, adherers, and non-adherers: latent profile analysis of CPAP use with correlates. Sleep Med. 2015;16(3):336–342. doi: 10.1016/j.sleep.2014.08.013. [DOI] [PubMed] [Google Scholar]
- 19.Rauscher H, Popp W, Wanke T, Zwick H. Acceptance of CPAP therapy for sleep apnea. Chest. 1991;100(4):1019–1023. doi: 10.1378/chest.100.4.1019. [DOI] [PubMed] [Google Scholar]
- 20.Sutherland K, Vanderveken OM, Tsuda H, et al. Oral appliance treatment for obstructive sleep apnea: an update. J Clin Sleep Med. 2014;10(2):215–227. doi: 10.5664/jcsm.3460. [DOI] [PMC free article] [PubMed] [Google Scholar]
- 21.Thomas RJ, Mietus JE, Peng CK, Goldberger AL. An electrocardiogram-based technique to assess cardiopulmonary coupling during sleep. Sleep. 2005;28(9):1151–1161. doi: 10.1093/sleep/28.9.1151. [DOI] [PubMed] [Google Scholar]
- 22.Hedner J, White DP, Malhotra A, et al. Sleep staging based on autonomic signals: a multi-center validation study. J Clin Sleep Med. 2011;7(3):301–306. doi: 10.5664/JCSM.1078. [DOI] [PMC free article] [PubMed] [Google Scholar]
- 23.Karlen W, Mattiussi C, Floreano D. Sleep and wake classification with ECG and respiratory effort signals. IEEE Trans Biomed Circuits Syst. 2009;3(2):71–78. doi: 10.1109/TBCAS.2008.2008817. [DOI] [PubMed] [Google Scholar]
- 24.Walters AS, Rye DB. Review of the relationship of restless legs syndrome and periodic limb movements in sleep to hypertension, heart disease, and stroke. Sleep. 2009;32(5):589–597. doi: 10.1093/sleep/32.5.589. [DOI] [PMC free article] [PubMed] [Google Scholar]
- 25.Khor YH, Tolson J, Churchward T, Rochford P, Worsnop C. Patients' estimates of their sleep times: reliability and impact on diagnosis of obstructive sleep apnoea. Intern Med J. 2015;45(8):850–853. doi: 10.1111/imj.12798. [DOI] [PubMed] [Google Scholar]
- 26.Garcia-Diaz E, Quintana-Gallego E, Ruiz A, et al. Respiratory polygraphy with actigraphy in the diagnosis of sleep apnea-hypopnea syndrome. Chest. 2007;131(3):725–732. doi: 10.1378/chest.06-1604. [DOI] [PubMed] [Google Scholar]
- 27.Toussaint M, Luthringer R, Schaltenbrand N, et al. Changes in EEG power density during sleep laboratory adaptation. Sleep. 1997;20(12):1201–1207. doi: 10.1093/sleep/20.12.1201. [DOI] [PubMed] [Google Scholar]
- 28.McCall C, McCall WV. Objective vs. subjective measurements of sleep in depressed insomniacs: first night effect or reverse first night effect? J Clin Sleep Med. 2012;8(1):59–65. doi: 10.5664/jcsm.1664. [DOI] [PMC free article] [PubMed] [Google Scholar]