Abstract
Study Objectives:
Existing studies on sleep quality and associated obesity are inconsistent, and few studies have prospectively evaluated the association between sleep quality and abdominal obesity among Chinese individuals. To fill this void, the current study aimed to assess the association between sleep quality and abdominal obesity in a rural Chinese population.
Methods:
A representative sample of 9,404 adults aged 20–93 years in northeastern China was selected between 2012 and 2013 by a multistage cluster and random sampling method. Sleep quality was evaluated by the Pittsburgh Sleep Quality Index (PSQI), where a score of 6 or higher indicated sleep disorder. Abdominal obesity was measured by waist circumference (WC), with abdominal obesity defined as WC > 90 cm for men and WC > 80 cm for women.
Results:
Male participants with abdominal obesity had higher global PSQI scores in addition to higher subscores in almost all of the elements compared to normal values. The odds ratios of abdominal obesity among participants with sleep disorders were 1.64 (95% confidence interval [CI]: 1.39–1.95) and 1.14 (95% CI: 0.98–1.32) for males and females compared to the reference group. The risk in all sleep elements was significantly increased, with odds ratios ranging from 1.28 (95% CI: 1.08–1.51) to 5.81 (95% CI: 3.54–9.53) for males. The risk only in four elements was significantly increased, from 1.28 (95% CI: 1.12–1.47) to 2.27 (95% CI: 1.36–3.80) for females.
Conclusions:
Poor sleep quality was associated with abdominal obesity in Chinese. Furthermore, effects in males were larger than those in females.
Citation:
Liu RQ, Qian Z, Wang SQ, Vaughn MG, Geiger SD, Xian H, Lin S, Paul G, Zeng XW, Yang BY, Hu LW, Xu SL, Yang M, Dong GH. Sex-specific difference in the association between poor sleep quality and abdominal obesity in rural Chinese: a large population-based study. J Clin Sleep Med. 2017;13(4):565–574.
Keywords: abdominal obesity, sex difference, rural Chinese, sleep quality
INTRODUCTION
Over the past decades, the global prevalence of obesity has increased in all age groups so dramatically that currently one billion adults are overweight.1 The prevalence of obesity in the general Chinese population is also increasing at a rapid rate.2
It is necessary to further understand the myriad factors contributing to the development and perpetuation of obesity in the general population.3 Recently, there has been great interest in the role of both sleep duration and quality in the onset and progression of obesity.3 However, existing studies on sleep duration and quality and associated obesity are inconsistent, with some reporting a positive association, and others no association.4–6
It is noteworthy that most conclusions on the sleep–obesity relationship were derived from body mass index (BMI)-based studies, but neglected another assessment of obesity: abdominal obesity. Abdominal obesity is clearly associated with central fat localization, type 2 diabetes, and cardiovascular diseases.7 The prevalence of abdominal obesity is increasing dramatically worldwide as well as in China.7
BRIEF SUMMARY
Current Knowledge/Study Rationale: Existing studies on sleep quality and associated obesity are inconsistent, and few studies have prospectively evaluated the association between sleep quality and abdominal obesity among Chinese individuals. To our knowledge, the current study is the first large-scale, population-based study addressing the relationship between sleep quality and obesity in a rural Chinese population.
Study Impact: It was observed, for the first time, an association of global PSQI score with prevalence and odds of abdominal obesity in a rural Chinese population. PSQI components are also associated with abdominal obesity, with more pronounced effects among men overall.
Most existing studies have been conducted in high-income countries whose patterns may differ from those of lower income nations. Therefore, evaluating the association between sleep and obesity among lower income populations, such as the Chinese population, is necessary. In addition, both rural and urban populations alike are affected by the increasing prevalence of obesity and sleep disorders. Urban populations are more common for studies on the relationship between sleep quality and obesity, even though rural individuals constitute a large proportion of the total population. This is especially true in developing countries such as China, whereby in 2005, approximately 57% of all Chinese lived in rural areas.8 Unfortunately, previous studies on sleep and obesity in China were limited by poor study design and small non-representative sample sizes. To our knowledge, the current study is the first large-scale, population-based study addressing the relationship between sleep quality and obesity in a rural Chinese population.
METHODS
Study Population
This study was based on population-based cross-sectional surveys using a multistage, stratified cluster sampling scheme in the rural areas of Jinzhou, Liaoning Province, in northeastern China from 2012 to 2013. The study sites and participant recruitment have been reported in greater detail elsewhere.8 Briefly, the total population in Jinzhou is about 3,102,000. In our sampling strategy, the country was stratified into 5 geographic zones: North, South, East, West and Central. Two townships were randomly selected from each of the South, East, and West zones and one township was selected from each of the North and Central zones. Three or five villages were subsequently randomly selected from each township, yielding 35 villages in total. At the last stage of the survey sampling, participants were stratified into several sex and age groups in accordance with census year 2010 in China. One participant aged 20 years or older with 5 years or more of residency at the current address was selected from each household without replacement. The study population ultimately consisted of 9,404 persons (4,770 males and 4,634 females). Participant ages ranged from 20 to 93 years (mean ± standard deviation: 52.11 ± 14.10 years).
Written informed consent from each participant was obtained before data collection. The study procedure was performed with regard to the ethical standards of the Committee on Human Experimentation of Sun Yat-sen University. The ethics committees and other relevant regulatory bodies in Liaoning Province approved the study.
Sleep Quality
The Pittsburgh Sleep Quality Index (PSQI), a validated, self-rated questionnaire, was used to evaluate sleep quality.8 The PSQI consists of 19 elements, each of which is coded on a point scale of 0 to 3, and are used to create subscores in 7 subcategories called components. The component variables are defined as: sleep latency (time required to go from full wakefulness to sleep and the frequency of falling asleep within 30 minutes); habitual sleep efficiency (hours slept compared to hours spent in bed: 0, ≥ 85%; 1, 75% to 84%; 2, 65% to 74% and 3, < 65%); subject sleep quality (0, very good; 1, fairly good; 2, fairly bad; and 3, very bad); sleep disturbance (amount of sleep disruption and frequency of disruption); daytime dysfunction (regularity of having trouble staying awake and maintaining enthusiasm during daily activities); sleep duration (0, sleep duration > 7 hours; 1, 6 to ≤ 7 hours; 2, 5 to < 6 hours and 3, < 5 hours); and use of sleep medication (0, not used during the past month; 1, less than once a week; 2, once or twice a week and 3, three or more times a week). Points from each component are summed for a global sleep quality score, from 0 to 21. A global PSQI score of 6 or higher distinguishes between good and poor sleepers.8
BMI and Abdominal Obesity
Height and weight were measured according to standardized procedures. In brief, we measured each participant's height and weight (to the nearest 0.1 cm and 0.1 kg, respectively) in light, indoor clothes. BMI was calculated as weight divided by height (kg/m2). We defined BMI based on recommendations from the Working Group on Obesity in China. BMI was categorized as follows: underweight, < 18.5; normal, 18.5–23.9; overweight, 24.0–27.9; obese, ≥ 28. We used 24 as the cutoff point for overweight/obesity.9 Abdominal obesity was measured by waist circumference (WC), measured at navel level, with participants standing up straight and with light expiration. Abdominal obesity was modified for Chinese as > 90 cm for men and > 80 cm for women based on the definition of metabolic syndrome (MetS) by International Diabetes Federations and World Health Organization recommendations.7,10
Covariates
Data on demographic characteristics age, sex, ethnicity, education level, marital status, occupation and household income, and behavioral and lifestyle risk factors were obtained from standardized, self-reported questionnaires. Lifestyle risk factors included smoking, alcohol consumption, tea consumption, and exercise. The definitions of lifestyle risk factors have been reported previously.8 The measurement and definition of hypertension were reported at the same time. In brief, blood pressure was measured with a standardized mercuric-column sphygmomanometer by a trained and certified observer. According to the Seventh Report of the Joint National Committee (JNC-7), we defined hypertension as an average systolic blood pressure ≥ 140 mm Hg, or an average diastolic blood pressure ≥ 90 mm Hg, or current use of antihypertensive medication. Medication use was confirmed with a standardized interview.8
Statistical Analysis
All of the statistical analyses for this study were conducted with SPSS software (version 18.0, SPSS Inc., Chicago, Illinois, United States). A value of P < .05 was considered statistically significant and all of the P values were two-sided.
In the current study, data were tested for normality (Shapiro-Wilk W test) and homogeneity (Bartlett test for unequal variances) and all scores and subscores were natural log-transformed to correct skewed distributions. All statistical analyses were stratified by sex because previous studies suggested sex differences in sleep outcomes. Baseline characteristics were compared between sex subgroups using one-way analysis of variance for continuous variables (age, BMI, WC, and global PSQI score) and Pearson chi-square tests for categorical variables (BMI classification, abdominal obesity, drinking, smoking, tea consumption, exercise, total final income, education, marital status, occupational status, the prevalence of hypertension, and sleep quality). Baseline characteristics were also compared between good and poor sleep quality using oneway analysis of variance for continuous variables (age, BMI, and WC) and Pearson chi-square tests for categorical variables (abdominal obesity, drinking, smoking, tea consumption, exercise, total final income, education, marital status, occupational status, and the prevalence of hypertension).
Analysis of covariance and logistic regression were performed to assess the association of self-reported sleep quality with abdominal obesity. We conducted data analysis of covariance for continuous variables to determine any significant differences across groups with or without abdominal obesity and adjusted for hypertension, age, BMI, drinking, smoking, tea consumption habit, regular exercise, total final income, education, marital status, and occupational status. Logistic regression was conducted to evaluate associations between abdominal obesity and poor sleep quality using the global PSQI score and seven other PSQI component subscales after adjusting for the aforementioned variables.
RESULTS
The characteristics of the participants are presented in Table 1, stratified by sex. Of the 9,404 study participants, 50.72% were males and 49.28% were females. Mean BMI was significantly higher among females (24.2 kg/m2) than males (23.43 kg/m2) (P < .05). Furthermore, the proportion of overweight/obese in females (30.38% and 11.67%, respectively) was significantly higher than in males (27.15% and 7.17%, respectively; P < .05). Prevalence of abdominal obesity was also significantly higher among females (48.12%) than males (20.28%) (P < .05). Though there was no significant difference in the prevalence of poor sleep quality across sex, global PSQI score of females was significantly higher than that of males (P < .05). Thus, data were stratified by sex in the following analyses.
Table 1.
Characteristics of the study population according to sex.
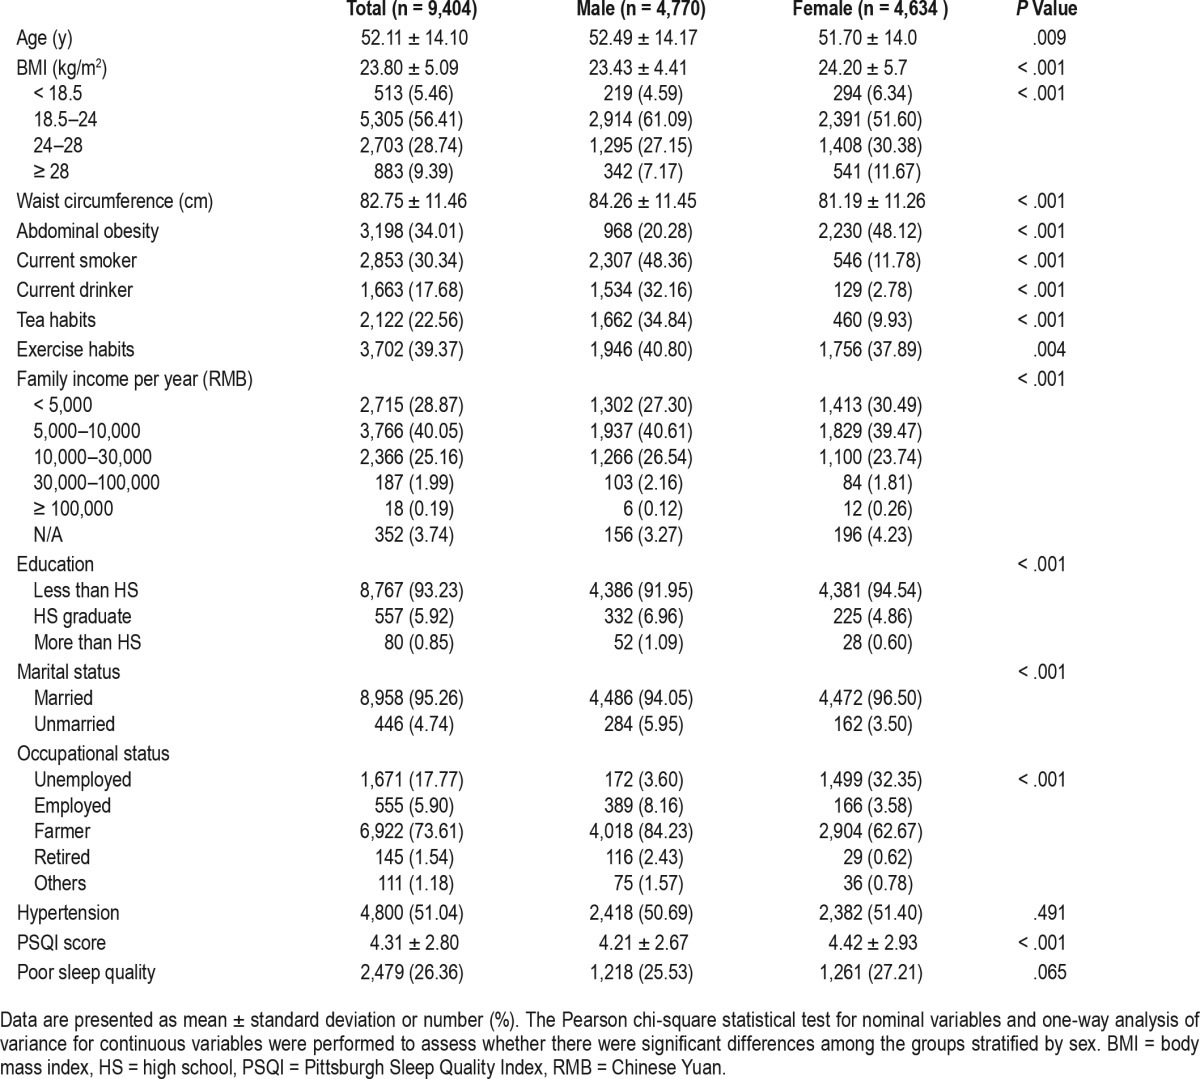
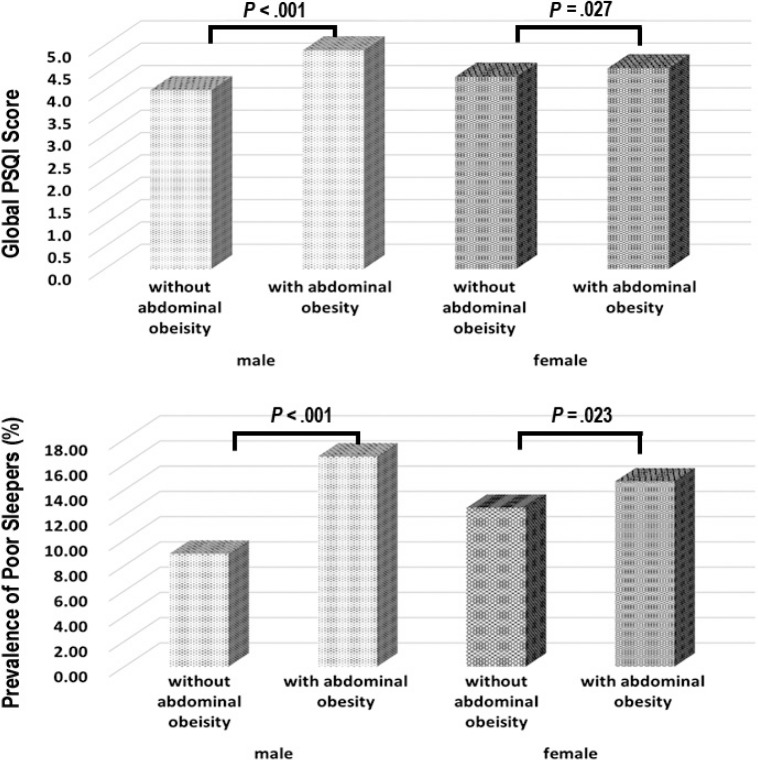
Table 2 shows the differences between the groups of poor and good sleep quality. There was no significant difference in BMI between the 2 groups for either sex. However, both WC and abdominal obesity were elevated among those with poor sleep quality across sex (P < .05). Figure 1 shows that participants with abdominal obesity had higher global PSQI scores and poorer sleep quality on average than those without abdominal obesity (P < .05).
Table 2.
Characteristics of the study population according to sleep quality.
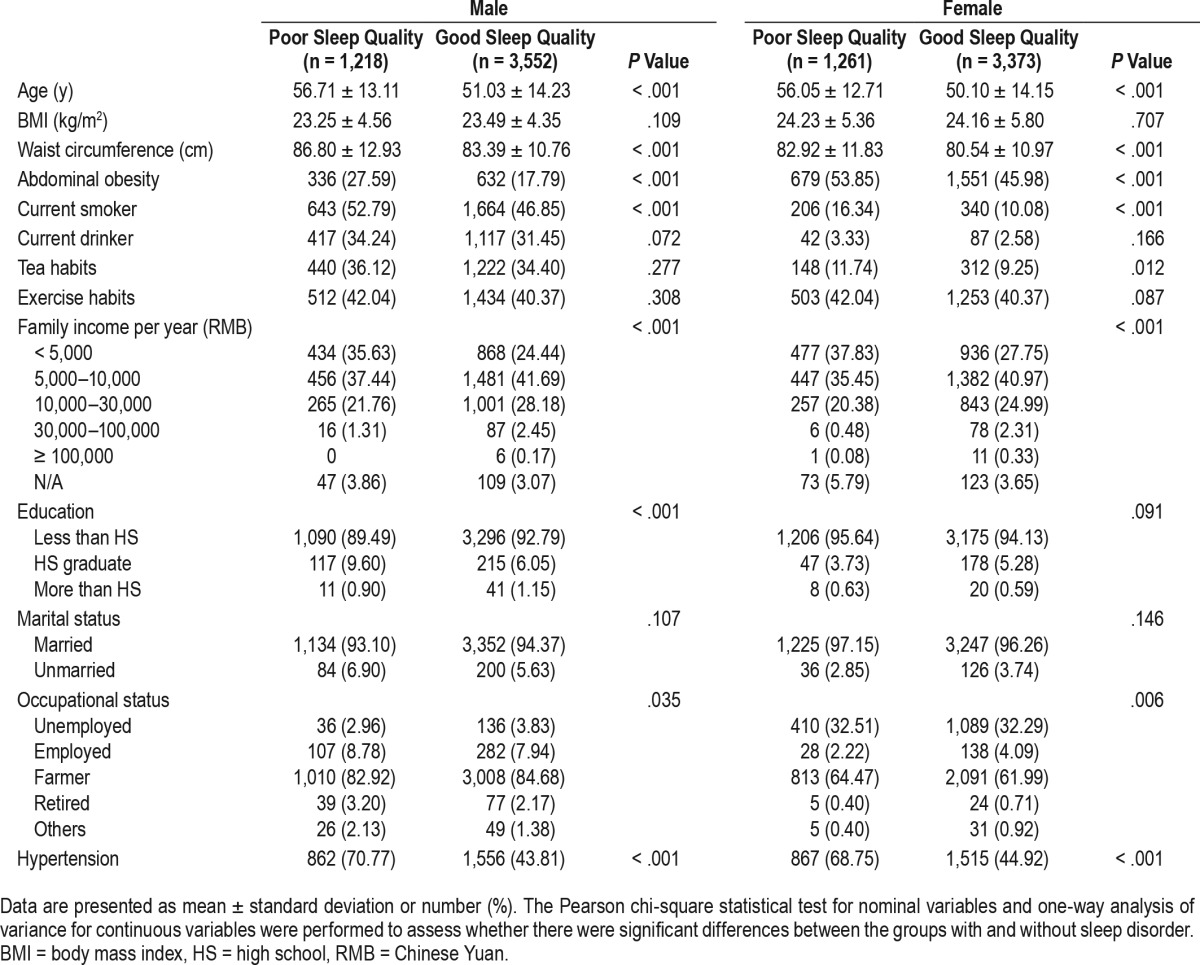
Figure 1. Global PSQI score and prevalence of poor sleepers in the groups with and without abdominal obesity in male and female.
The chi-square statistical test was performed to assess whether there were significant differences in the global score and the prevalence of poor sleep quality between the groups with and without abdominal obesity in male or female. PSQI = Pittsburgh Sleep Quality Index.
Table 3 and Table 4 display one-way analyses of covariance for continuous variables to assess significant differences among the males and females with and without abdominal obesity after adjustment for hypertension, age, BMI, drinking, smoking, tea consumption habit, exercise, total final income, education, marital status and occupational status. Among males, mean scores for global PSQI and 6 (out of 7) PSQI components (sleep duration, subjective sleep quality, sleep latency, sleep disturbance, use of sleep medication, and daytime dysfunction) were significantly higher in participants with abdominal obesity (P < .05). In females, the trend persisted for only 2 components (sleep latency and sleep disturbance; P < .05). Unlike in males, the scores for sleep duration were significantly lower in obese female participants (P < .05). We also compared the difference in the time to fall asleep between the 2 groups separately among males and females. The results indicated that both sexes with obesity needed more time to fall asleep (with higher scores of the time to fall asleep; P < .05).
Table 3.
Comparison of PSQI scores between groups with and without abdominal obesity.
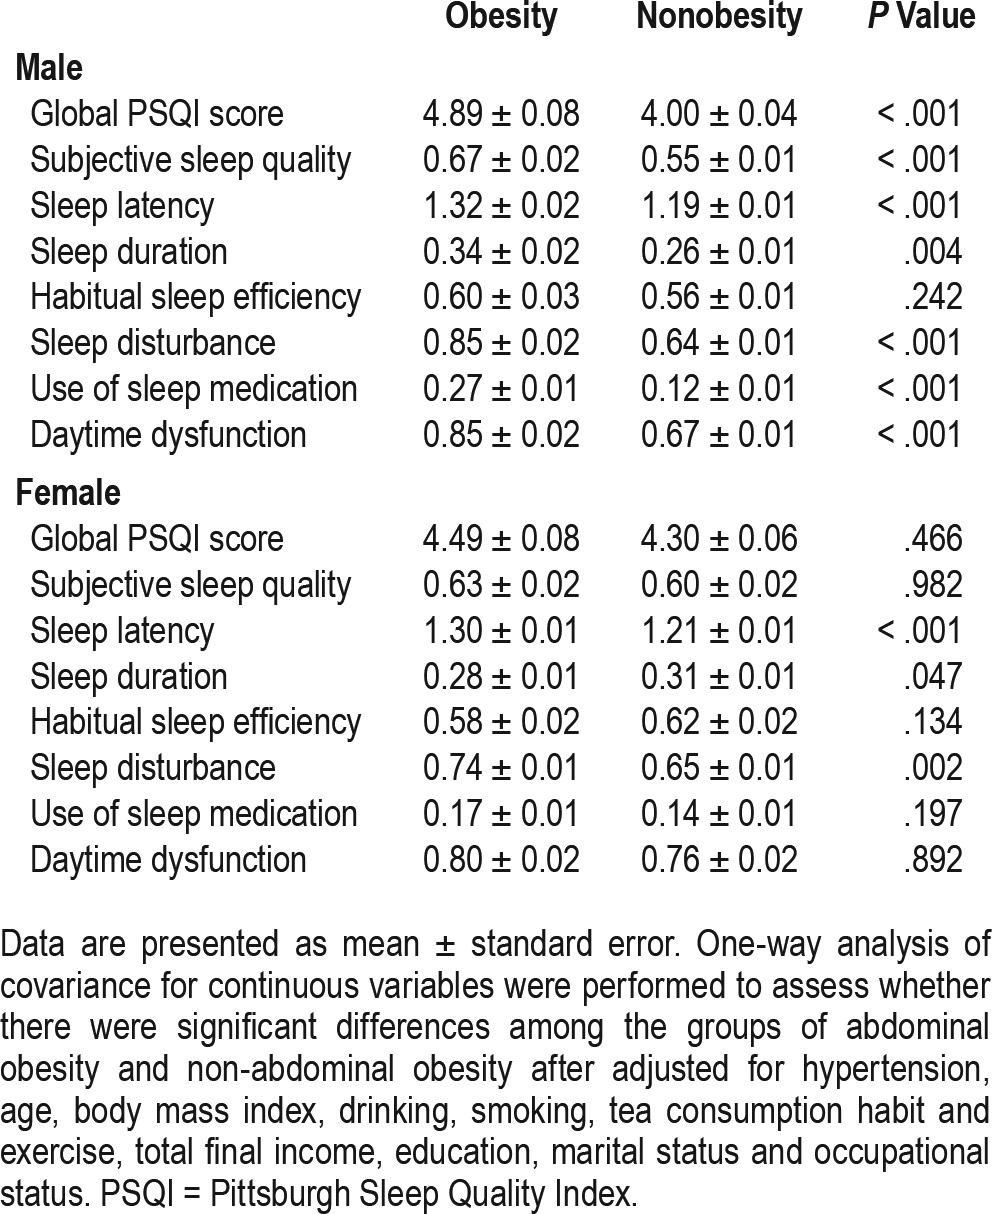
Table 4.
Comparison of scores of the time to fall asleep between groups with and without abdominal obesity.
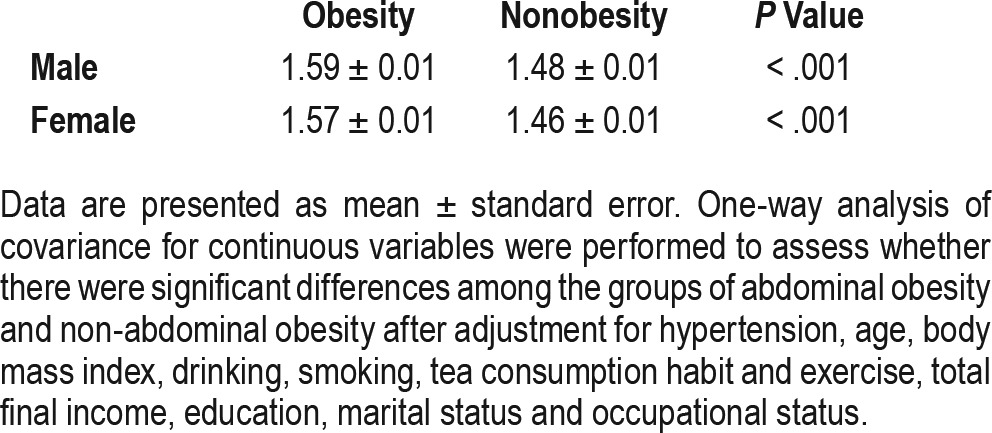
Table 5 and Table 6 reveal results of multivariate logistic regression analyses examining the relationship between the global and component PSQI scores and abdominal obesity after adjusting for aforementioned variables. In males, the odds of abdominal obesity among individuals with the global PSQI score of 6 or more was 1.64 (95% confidence interval [CI]: 1.39–1.95) in contrast to the reference group with the global PSQI score of 5 or less. Among females, the odds of abdominal obesity among individuals with the global PSQI score of 6 or more was 1.14 (95% CI, 0.98–1.32) in contrast with the reference group. In males, participants who had elevated scores in all PSQI components had greater odds of abdominal obesity than those who did not. For example, the odds of abdominal obesity among the subjects with subjective sleep quality scores of 1, 2, and 3 (indicating poorer sleep quality) were 1.16, 1.66, and 3.15 (95% CI: 0.98–1.36, 1.20–2.29, and 1.61–6.17), respectively, in contrast with the reference group. Scores for PSQI components among females showed no association between habitual sleep efficiency, daytime dysfunction, and abdominal obesity. However, females with elevated scores in subjective sleep quality, sleep latency, sleep disturbance, or use of sleep medication had greater odds of abdominal obesity than those who did not to some extent. For example, the odds of abdominal obesity among the subjects with subjective sleep quality scores of 2 were 1.35 (95% CI: 1.04–1.76) in contrast with the reference group. The risks of sleep duration were different among males and females. For example, the odds of abdominal obesity among the subjects with sleep duration scores of 3 was 2.64 (95% CI: 1.44–4.85) among males and 1.62 (95% CI: 0.92–2.87) among females. Similarly, we compared the risk of the time to fall asleep separately, as shown in Table 7. Among males, the odds of abdominal obesity among the subjects taking a longer time to fall asleep (31–60 minutes, ≥ 60 minutes) were 2.38 and 3.61 (95% CI: 1.20–4.74, 1.60–8.13), respectively, in contrast with the reference group (≤ 15 minutes). Similar trends existed among females with the odds of 1.80 and 2.37 (95% CI: 1.13–2.85, 1.30–4.32).
Table 5.
Association between PSQI scores and abdominal obesity among males.
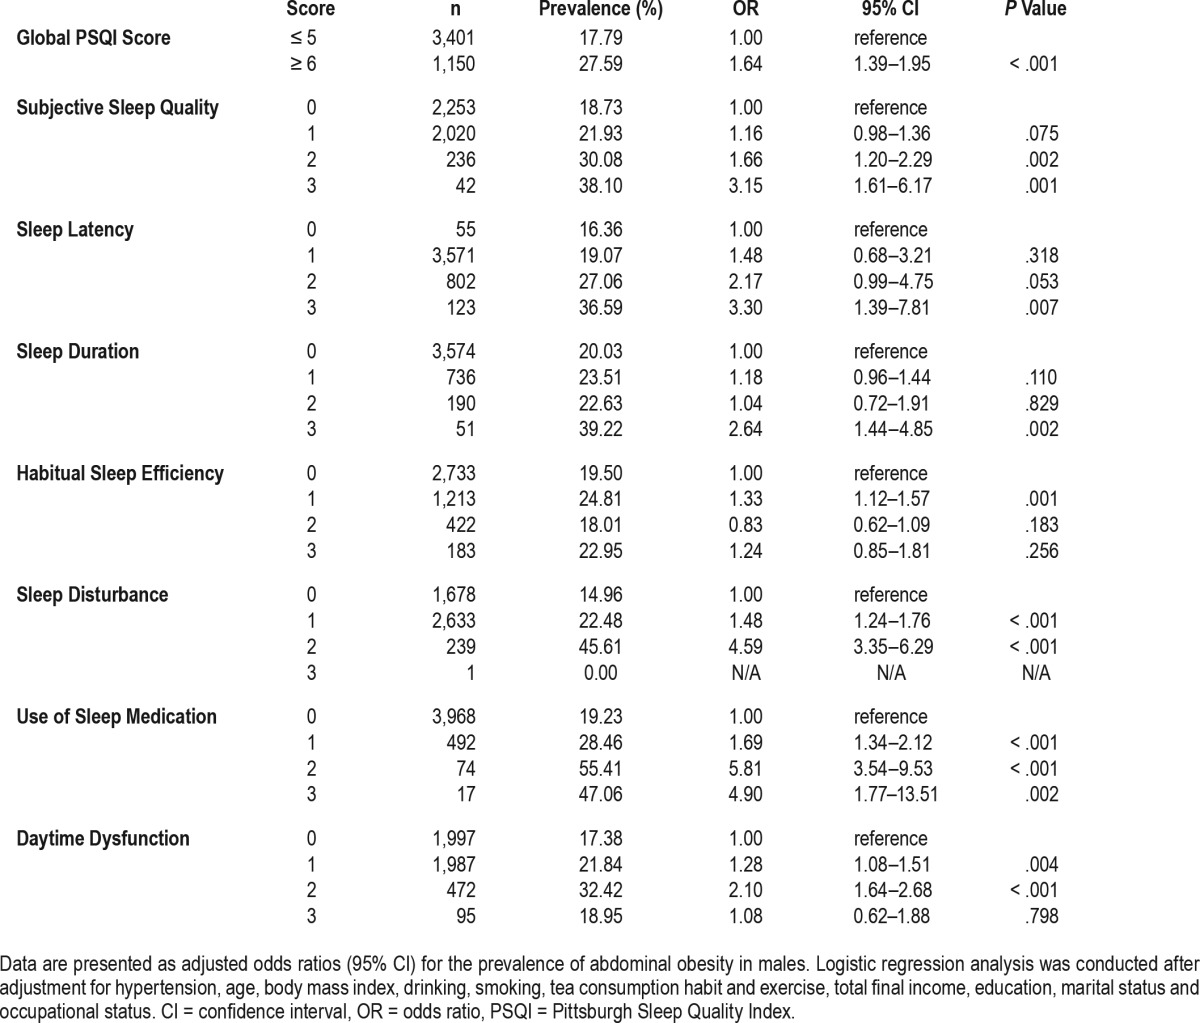
Table 6.
Association between PSQI scores and abdominal obesity among females.
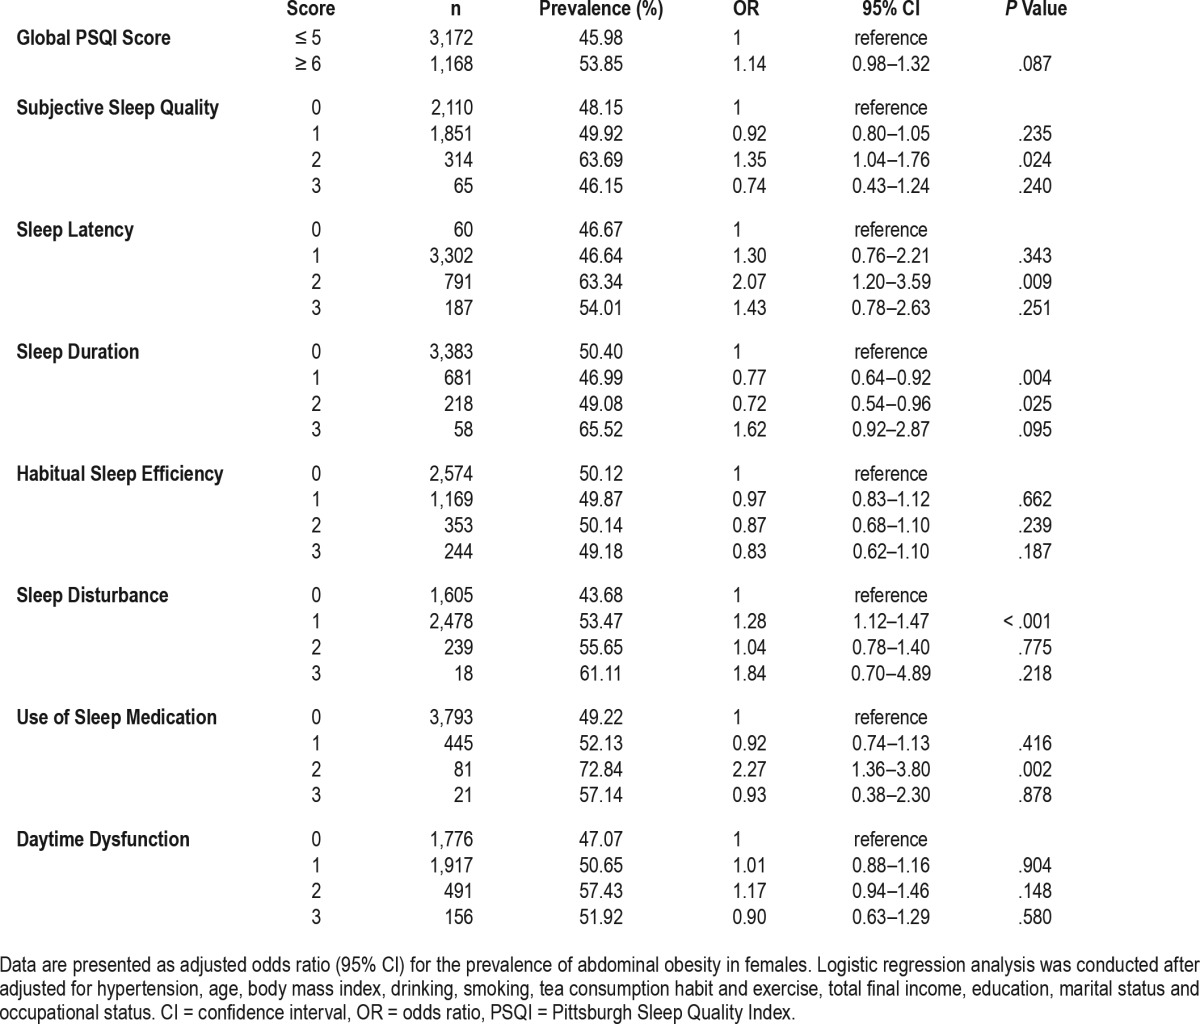
Table 7.
Association between the time to fall asleep and abdominal obesity.

DISCUSSION
Previously, studies on the associations between sleep duration and obesity have largely progressed without adequately addressing the role of sleep quality such as sleep latency and sleep disturbance. Our study is one of the first attempts to conduct self-reported sleep quality assessments from adults in rural areas. In addition, we are also among the first to demonstrate a correlation between poor sleep quality and risk of abdominal obesity in the general population, stratified by sex.
Previous studies mainly have focused on BMI but not included WC. Abdominal obesity is one of the five primary components of MetS.11 In China, the prevalence of abdominal obesity has been rapidly increasing.7 In this study, we examined the associations between PSQI (both global and component scores) and both BMI and abdominal obesity, stratified by sex. We found no evidence of an association between sleep quality and BMI, either in men or women. However, we observed significant, positive associations between prolonged sleep latency and sleep disturbance and abdominal obesity (in terms of WC and prevalence of abdominal obesity) across sex. Furthermore, associations between the poor sleep quality, short sleep duration and daytime dysfunction and abdominal obesity were observed among men.
One Taiwanese study indicated that participants who slept fewer than 5 hours per night on average were more likely to experience abdominal obesity, and those with higher scores of sleep disturbances had a higher prevalence of MetS and abdominal obesity.12 Another study found significantly decreased WC in those who improved their sleep quality.13 Similarly, our study found that men with shorter sleep duration and higher scores of sleep disturbances had a higher prevalence and higher risk of abdominal obesity. As such, men with short sleep duration or sleep disturbances should be screened for MetS and abdominal obesity in an effort to prevent cardiovascular diseases.
Other studies examining sleep quality in association with obesity report mixed results. A few studies have shown an association between sleep quality and overweight/obesity.14,15 However, some studies suggest the contrary. For instance, studies such as those by Kim and Crönlein found no association between poor sleep quality and BMI.16,17 We did not identify an association between sleep quality and BMI, either. The differences in the findings are most likely attributable to the group studied or other factors. For example, some potential risk factors were not taken into account in these studies such as smoking status, alcohol consumption, exercise habits, and tea consumption. In previous studies, the population was composed of urban participants, teenagers, or elderly people, whereas our participants were all rural Chinese adults. In the absence of an association between sleep quality and BMI, we did find a significant, positive link between sleep quality and abdominal obesity.
Mechanisms underlying the relationship between sleep and obesity are not fully understood. Some biological evidence suggests that the presence of a sleep disorder may increase the risk for obesity.18 Both sleep quality and quantity are important factors to maintain normal daily metabolic and hormonal processes and appetite regulation, which may contribute to energy dysregulation that leads to weight gain and obesity.16 For example, Yan et al.6 indicated that sleep deprivation may lead to a constellation of metabolic and endocrine alterations (eg, decreased glucose tolerance, elevated sympathovagal balance, decreased levels of leptin, and increased hunger and appetite). However, there are experimental sleep restriction studies that have found no change or even increases in leptin levels or decreases in ghrelin levels as a result of sleep deprivation.19–21 Some studies have demonstrated that recurrent episodes of short sleep increased 24-hour food intake and snack consumption, whereas others have not observed such an increase.22 In addition, Prather et al.23 confirmed that systemic inflammation, including that induced by stress, may serve as a common biological mechanism linking sleep, adiposity, and disease risk.
Our results converge with other existing research reporting sleep quality differences across sex.11,24,25 In our study, the global PSQI score of females was higher than that of males, and the prevalence of abdominal obesity in female (48.12%) was much greater than that in males (20.28%), which is consistent with an analysis of 105 countries and territories reported by Thomson et al.1 We found that males with higher subjective sleep quality scores (1, 2, and 3, respectively; indicating poorer sleep quality) suffered from a higher prevalence (18.7%, 21.9% and 30.08%, respectively) and higher risk (1.29, 2.03, and 3.67) of abdominal obesity. However, similar relationships did not exist in females. Thus, the effects in males were larger than in females, both in terms of the correlated sleep elements and the odds ratios for abdominal obesity. Results are similar to those presented in the study by Sun and colleagues,11 where sleep quality was negatively associated with overweight/obesity in Chinese urban men but not in women. Furthermore, in the current study we also found that for males, sleep duration was shorter in individuals with abdominal obesity than those without abdominal obesity. However, sleep duration did not show a similar difference among females. This is consistent with the study findings reported by Sun et al.,26 who reported that short sleep duration was significantly associated with obesity among men (odds ratio: 2.15; 95% CI: 1.19–3.90), but not among women.26 We also found that the odds of abdominal obesity among the subjects that took a longer time to fall asleep (31–60 minutes, ≥ 60 minutes) for males were higher than that for females when compared to the subjects who took a shorter time to fall asleep (≤ 15 minutes). The specific sex-based mechanisms are still unclear. Recent studies emphasize the importance of the menstrual cycle with regard to sleep, such as cortisol changes in response to sleep quality. It has been reported that sex differences occurred in individuals with both insomnia and obesity.27,28 Another study revealed that sleep restriction led to a marked increase in food intake in men compared to women.29 Because of the metabolic nature of such sex differences, men have been found to gain more weight than women under experimental sleep restriction.29 Under conditions of sleep loss, hormonal responses have been reported to differ as well. For instance, greater increases in leptin levels were found in women than in men following sleep restriction.30 St-Onge et al.31 found that sleep restriction led to increased morning levels of ghrelin only in men. However, an afternoon decrease in GLP-1 was observed only in women.
Study strengths of the current study include a relatively large sample size, the use of cross-culturally accepted instruments to characterize sleep disorders, and the use of the valid, reliable PSQI instrument. Limitations include self-report, lack of laboratory measures of sleep mediators (eg, ghrelin, leptin, insulin resistance, and sympathoadrenal activity),32,33 and other subjective sleep parameters (eg, sleep diaries, sleep duration in minutes). Perhaps the largest limitation, however, is the lack of temporal ordering and controls necessary to permit causal inferences. Future longitudinal studies are needed. Another limitation is that the Chinese version of PSQI does not include any items regarding restlessness during sleep and witnessed apneas, which can serve to indicate general and various aspects of sleep quality as previously mentioned, including snoring and pauses between breaths. Thus, the current study does not contain adequate information to explore the association between restless legs syndrome and obstructive sleep apnea and abdominal obesity. Finally, though we have included hypertension as a confounding factor in the current study, there is still no information on medications or diabetes, depression, and psychiatric disorders, which should be taken into account in the future studies.
CONCLUSIONS
We observed, for the first time, an association of global PSQI score with prevalence and odds of abdominal obesity in a rural Chinese population. PSQI components (prolonged sleep latency, short sleep duration, sleep disturbance, and poor sleep quality) are also associated with abdominal obesity, with more pronounced effects among men overall. Further research is needed to elucidate this relationship. In clinical practice, we might suggest routine screening for poor sleep quality among subjects with abdominal obesity.
DISCLOSURE STATEMENT
The authors have no conflicts of interest and were solely responsible for study design, data collection and analysis, and manuscript preparation and editing. This study was supported by National Program on Key research Project of China (#2016YFC0207000), the Guangdong Provincial Department of Science and Technology provided financial support in the form of Natural Science Founding (#2014A050503027), the Liaoning Provincial Department of Science and Technology provided financial support in the form of Natural Science Founding (#2013225049).
ACKNOWLEDGMENTS
The authors thank the participants for their time and the anonymous reviewers for their very helpful comments.
ABBREVIATIONS
- BMI
body mass index
- CI
confidence interval
- JNC-7
the Seventh Report of the Joint National Committee
- MetS
metabolic syndrome
- OR
odds ratio
- PSQI
Pittsburgh Sleep Quality Index
- WC
waist circumference
REFERENCES
- 1.Thomson CA, Morrow KL, Flatt SW, et al. Relationship between sleep quality and quantity and weight loss in women participating in a weight-loss intervention trial. Obesity. 2012;20(7):1419–1425. doi: 10.1038/oby.2012.62. [DOI] [PMC free article] [PubMed] [Google Scholar]
- 2.Lao XQ, Ma WJ, Sobko T, et al. Overall obesity is leveling off while abdominal obesity continues to rise in a Chinese population experiencing rapid economic development: analysis of serial cross-sectional health survey data 2002–2010. Int J Obes (Lond) 2015;39(2):288–294. doi: 10.1038/ijo.2014.95. [DOI] [PubMed] [Google Scholar]
- 3.Araghi MH, Jagielski A, Neira I, et al. The complex associations among sleep quality, anxiety-depression, and quality of life in patients with extreme obesity. Sleep. 2013;36(12):1859–1865. doi: 10.5665/sleep.3216. [DOI] [PMC free article] [PubMed] [Google Scholar]
- 4.Nielsen LS, Danielsen KV, Sørensen TI. Short sleep duration as a possible cause of obesity: critical analysis of the epidemiological evidence. Obes Rev. 2011;12(2):78–92. doi: 10.1111/j.1467-789X.2010.00724.x. [DOI] [PubMed] [Google Scholar]
- 5.Chen DR, Truong KD, Tsai MJ. Prevalence of poor sleep quality and its relationship with body mass index among teenagers: evidence from Taiwan. J Sch Health. 2013;83(8):582–588. doi: 10.1111/josh.12068. [DOI] [PubMed] [Google Scholar]
- 6.Yan Z, Chang-Quan H, Zhen-Chan L, Bi-Rong D. Association between sleep quality and body mass index among Chinese nonagenarians/centenarians. Age. 2012;34(3):527–537. doi: 10.1007/s11357-011-9251-3. [DOI] [PMC free article] [PubMed] [Google Scholar]
- 7.Du P, Zhang B, Wang HJ, et al. The prevalence and secular trends of abdominal obesity among Chinese adults, 1993-2011. Ann Epidemiol. 2015;25(10):797–799. doi: 10.1016/j.annepidem.2015.06.082. [DOI] [PubMed] [Google Scholar]
- 8.Liu RQ, Qian Z, Trevathan E, et al. Poor sleep quality associated with high risk of hypertension and elevated blood pressure in China: results from a large population-based study. Hypertens Res. 2016;39(1):54–59. doi: 10.1038/hr.2015.98. [DOI] [PubMed] [Google Scholar]
- 9.Zhou BF Cooperative Meta-Analysis Group of the Working Group on Obesity in China. Predictive values of body mass index and waist circumference for risk factors of certain related diseases in Chinese adults: study on optimal cut-off points of body mass index and waist circumference in Chinese adults. Biomed Environ Sci. 2002;15(1):83–96. [PubMed] [Google Scholar]
- 10.Sun M, Zhang L, Chen S, Liu X, Shao X, Zou H. Association of C-reactive protein and metabolic disorder in a Chinese population. Int J Environ Res Public Health. 2015;12(7):8228–8242. doi: 10.3390/ijerph120708228. [DOI] [PMC free article] [PubMed] [Google Scholar]
- 11.Sun W, Yuan J, Yu Y, et al. Poor sleep quality associated with obesity in men. Sleep Breath. 2016;20(2):873–880. doi: 10.1007/s11325-015-1193-z. [DOI] [PubMed] [Google Scholar]
- 12.Chang JH, Huang PT, Lin YK, et al. Association between sleep duration and sleep quality, and metabolic syndrome in Taiwanese police officers. Int J Occup Med Environ Health. 2015;28(6):1011–1023. doi: 10.13075/ijomeh.1896.00359. [DOI] [PubMed] [Google Scholar]
- 13.Filiatrault ML, Chaput JP, Drapeau V, Tremblay A. Eating behavior traits and sleep as determinants of weight loss in overweight and obese adults. Nutr Diabetes. 2014;4:e140. doi: 10.1038/nutd.2014.37. [DOI] [PMC free article] [PubMed] [Google Scholar]
- 14.Hung HC, Yang YC, Ou HY, Wu JS, Lu FH, Chang CJ. The association between self-reported sleep quality and overweight in a Chinese population. Obesity. 2013;21(3):486–492. doi: 10.1002/oby.20259. (Silver Spring) [DOI] [PubMed] [Google Scholar]
- 15.Rice JR, Larrabure-Torrealva GT, Luque Fernandez MA, et al. High risk for obstructive sleep apnea and other sleep disorders among overweight and obese pregnant women. BMC Pregnancy Childbirth. 2015;15:198–205. doi: 10.1186/s12884-015-0633-x. [DOI] [PMC free article] [PubMed] [Google Scholar]
- 16.Kim M. Association between objectively measured sleep quality and obesity in community-dwelling adults aged 80 years or older: a cross-sectional study. J Korean Med Sci. 2015;30(2):199–206. doi: 10.3346/jkms.2015.30.2.199. [DOI] [PMC free article] [PubMed] [Google Scholar]
- 17.Crönlein T, Langguth B, Busch V, Rupprecht R, Wetter TC. Severe chronic insomnia is not associated with higher body mass index. J Sleep Res. 2015;24(5):514–517. doi: 10.1111/jsr.12294. [DOI] [PubMed] [Google Scholar]
- 18.Hargens TA, Kaleth AS, Edwards ES, Butner KL. Association between sleep disorders, obesity, and exercise: a review. Nat Sci Sleep. 2013;5:27–35. doi: 10.2147/NSS.S34838. [DOI] [PMC free article] [PubMed] [Google Scholar]
- 19.Nedeltcheva AV, Kilkus JM, Imperial J, Kasza K, Schoeller DA, Penev PD. Sleep curtailment is accompanied by increased intake of calories from snacks. Am J Clin Nutr. 2009;89(1):126–133. doi: 10.3945/ajcn.2008.26574. [DOI] [PMC free article] [PubMed] [Google Scholar]
- 20.Dzaja A, Dalal MA, Himmerich H, Uhr M, Pollmächer T, Schuld A. Sleep enhances nocturnal plasma ghrelin levels in healthy subjects. Am J Physiol Endocrinol Metab. 2004;286(6):E963–E967. doi: 10.1152/ajpendo.00527.2003. [DOI] [PubMed] [Google Scholar]
- 21.Pejovic S, Vgontzas AN, Basta M, et al. Leptin and hunger levels in young healthy adults after one night of sleep loss. J Sleep Res. 2010;19(4):552–558. doi: 10.1111/j.1365-2869.2010.00844.x. [DOI] [PMC free article] [PubMed] [Google Scholar]
- 22.Cedernaes J, Schiöth HB, Benedict C. Determinants of shortened, disrupted, and mistimed sleep and associated metabolic health consequences in healthy humans. Diabetes. 2015;64(4):1073–1080. doi: 10.2337/db14-1475. [DOI] [PubMed] [Google Scholar]
- 23.Prather AA, Puterman E, Epel ES, Dhabhar FS. Poor sleep quality potentiates stress-induced cytokine reactivity in postmenopausal women with high visceral abdominal adiposity. Brain Behav Immun. 2014;35:155–162. doi: 10.1016/j.bbi.2013.09.010. [DOI] [PMC free article] [PubMed] [Google Scholar]
- 24.Bidulescu A, Din-Dzietham R, Coverson DL, et al. Interaction of sleep quality and psychosocial stress on obesity in African Americans: the Cardiovascular Health Epidemiology Study (CHES) BMC Public Health. 2010;10:581. doi: 10.1186/1471-2458-10-581. [DOI] [PMC free article] [PubMed] [Google Scholar]
- 25.Okubo N, Matsuzaka M, Takahashi I, et al. Relationship between self-reported sleep quality and metabolic syndrome in general population. BMC Public Health. 2014;14:562. doi: 10.1186/1471-2458-14-562. [DOI] [PMC free article] [PubMed] [Google Scholar]
- 26.Sun W, Huang Y, Wang Z, et al. Sleep duration associated with body mass index among Chinese adults. Sleep Med. 2015;16(5):612–616. doi: 10.1016/j.sleep.2014.12.011. [DOI] [PubMed] [Google Scholar]
- 27.Zhang J, Ma RC, Kong AP, et al. Relationship of sleep quantity and quality with 24-hour urinary catecholamines and salivary awakening cortisol in healthy middle-aged adults. Sleep. 2011;34(2):225–233. doi: 10.1093/sleep/34.2.225. [DOI] [PMC free article] [PubMed] [Google Scholar]
- 28.Zhang J, Lam SP, Li SX, et al. A community-based study on the association between insomnia and hypothalamic-pituitary-adrenal axis: sex and pubertal influences. J Clin Endocrinol Metab. 2014;99(6):2277–2287. doi: 10.1210/jc.2013-3728. [DOI] [PubMed] [Google Scholar]
- 29.Spaeth AM, Dinges DF, Goel N. Effects of experimental sleep restriction on weight gain, caloric intake, and meal timing in healthy adults. Sleep. 2013;36(7):981–990. doi: 10.5665/sleep.2792. [DOI] [PMC free article] [PubMed] [Google Scholar]
- 30.Simpson NS, Banks S, Dinges DF. Sleep restriction is associated with increased morning plasma leptin concentrations, especially in women. Biol Res Nurs. 2010;12(1):47–53. doi: 10.1177/1099800410366301. [DOI] [PMC free article] [PubMed] [Google Scholar]
- 31.St-Onge MP, O'Keeffe M, Roberts AL, RoyChoudhury A, Laferrère B. Short sleep duration, glucose dysregulation and hormonal regulation of appetite in men and women. Sleep. 2012;35(11):1503–1510. doi: 10.5665/sleep.2198. [DOI] [PMC free article] [PubMed] [Google Scholar]
- 32.Knutson KL. Sleep duration and cardiometabolic risk: a review of the epidemiologic evidence. Best Pract Res Clin Endocrinol Metab. 2010;24(5):731–743. doi: 10.1016/j.beem.2010.07.001. [DOI] [PMC free article] [PubMed] [Google Scholar]
- 33.Stamatakis KA, Punjabi NM. Effects of sleep fragmentation on glucose metabolism in normal subjects. Chest. 2010;137(1):95–101. doi: 10.1378/chest.09-0791. [DOI] [PMC free article] [PubMed] [Google Scholar]


