Abstract
Lean body mass (LBM) is a complex trait for human health. To identify genomic loci underlying LBM, we performed a gene-based genome-wide association study of lean mass index (LMI) in 1000 unrelated Caucasian subjects, and replicated in 2283 unrelated Caucasians subjects. Gene-based association analyses highlighted the significant associations of three genes UQCR, TCF3 and MBD3 in one single locus 19p13.3 (discovery p = 6.10 × 10⁻⁵, 1.65 × 10⁻⁴ and 1.10 × 10⁻⁴; replication p = 2.21 × 10⁻³, 1.84 × 10⁻³ and 6.95 × 10⁻³; combined p = 2.26 × 10⁻⁶, 4.86 × 10⁻⁶ and 1.15 × 10⁻⁵, respectively). These results, together with the known functional relevance of the three genes to LMI, suggested that the 19p13.3 region containing UQCR, TCF3 and MBD3 genes was a novel locus underlying lean mass variation.
The muscular tissue, as characterized by lean body mass (LBM), is related to human health. Low LBM may be related to a series of health problems, such as sarcopenia, obesity, and increased mortality1,2. LBM is under genetic control, with heritability over 50%3,4. Previous GWA studies have found novel single nucleotide polymorphisms (SNPs) and genes associated with LBM5,6,7. However, the vast majority of LBM candidate genes remain to be revealed. LBM can be measured accurately by dual energy X-ray absorptiometry (DXA). Body lean mass index (LMI) is frequently used to predict sarcopenia8,9.
Genomic regions may present allelic heterogeneity to the phenotype, i.e., multiple variants in a region affect the phenotype jointly. In the presence of allelic heterogeneity, gene-based association test can improve statistical power and robustness of genetic association analysis by integrating multiple SNP signals into a single statistic10,11. A variety of statistical methods were developed for gene-based test, such as Versatile Gene-based Association Study (VEGAS)12. VEGAS combines p-values of multiple SNPs within a gene region into a gene-based score while accounting for linkage disequilibrium (LD) by simulating genotype data from a multivariate normal distribution in permutation-based test. VEGAS is computationally efficient because the number of permutation simulations is adaptive. Its performance is similar to other statistical methods12, but is superior to the others in certain conditions due to its usage of large population reference panels when performing permutation. Therefore, it uses summary statistics only instead of raw genotype and phenotype data, making it suitable for the summary results from large-scale meta-analyses.
In this study, we reported a gene-based GWAS for LMI to identify genetic loci underlying variation of LBM. The discovery sample included 1000 unrelated Caucasian subjects genotyped with the Affymetrix 500 k genotyping array. The replication sample included 2283 unrelated subjects of Caucasian subjects, genotyped with the Affymetrix SNP6.0 genotyping array. Genotypes in both samples were imputed with the 1000 genomes project sequencing reference panel.
Materials and Methods
Ethics Statement
Study participants were recruited from the cities of Omaha and Kansas city and their neighboring areas. The study was approved by institutional review boards of the Creighton University and the University of Missouri-Kansas city. All participants provided written informed consent documents before entering the study. The methods carried out in accordance with the approved study protocol.
Subjects
Discovery sample
The discovery sample consisted of 1,000 unrelated Caucasian subjects of European ancestry, of whom 501 were males and 499 were females. The sample was randomly selected from a large-scale cohort containing over 6000 subjects. The inclusion and exclusion criteria for cases were described in our previous publications13.
Replication sample
The replication sample consisted of 2283 unrelated subjects of European ancestry. There were 556 male subjects and 1727 female subjects. All subjects were healthy individuals recruited from the Midwestern United States. There was no overlap between the subjects of the discovery and the replication cohorts.
Phenotyping
All subjects completed a structured questionnaire including lifestyle, medical history, family information, anthropometric variables, etc. Lean body mass and fat body mass (FBM) were measured with a Hologic QDR 4500 W DXA scanner (Hologic Inc., Bedford, MA, USA). Weight was measured in light clothing, on a calibrated balance beam scale. Height was obtained using a calibrated stadiometer. Lean mass index (LMI, kg/m2) was calculated as the ratio of lean mass to square of height14.
Genotyping and quality control
Genomic DNA was extracted from peripheral blood leukocytes using a commercial isolation kit (Gentra Systems, Minneapolis, MN, USA). Genotyping was performed as described in our previous publication15. Briefly, the discovery cohort was genotyped with the Affymetrix Mapping 250 K Nsp and Affymetrix Mapping 250 K Sty arrays at the Vanderbilt Microarray Shared Resource at Vanderbilt University Medical Center (Nashville, TN, USA) using the standard protocol recommended by the manufacturer (Affymetrix, Inc., Santa Clara, CA, USA). The Caucasian replication cohort was genotyped using the Affymetrix SNP 6.0 arrays by the standard protocol of the manufacturer.
We followed strict quality control (QC) procedure. Samples that had a minimum call rate of 95% were included. We discarded SNPs that deviated from Hardy-Weinberg equilibrium (p < 0.0001) and those containing a minor allele frequency (MAF) less than 0.01. After QC, 379,319 SNPs remained in the discovery sample.
Genotype imputation
Genotype imputation was applied to both the discovery and replication samples, with the 1000 Genomes projects sequence variants as reference panel (as of August 2010). Reference sample included 283 individuals of European ancestry.
The details of genotype imputation process had been described earlier16. Briefly, strand orientations between reference panel and test sample were checked before imputation, and inconsistencies were resolved by changing the test sample to reverse strand or removing the SNP from the test sample. Imputation was performed with MINIMAC17. Quality control was applied to impute SNPs with the following criteria: imputation r2 > 0.5 and MAF > 0.01. SNPs failing the QC criteria were excluded from subsequent association analyses.
SNP-based association analyses
We used VEGAS for gene based association analyses, which takes individual SNP association p-values as input. Therefore, we performed SNP-based association analyses first to generate association signals. We used the principal component based approach for the correction of population stratification problem18. In both samples, covariates including gender, age, age2, fat body mass (FBM) and the first five principal components19,20 derived from genome-wide genotype data were screened for significance with the step-wise linear regression model implemented in the R function stepAIC. Raw BMI values were adjusted by significant covariates (age, gender and FBM), and the residuals were normalized by inverse quantiles of standard normal distribution.
Genetic associations were examined between genotyped and/or imputed SNPs and normalized phenotypes under an additive mode of inheritance with MACH2QTL21,22, which fitted phenotype by allele dosage with a linear regression model.
Linkage disequilibrium (LD) measure r2 was calculated with Haploview23. To examine potential confounding effect caused by population stratification, we estimated the genomic control inflation factor (λ)24.
Gene-based test using VEGAS
Gene-based association test was examined to identify genes that were associated with the phenotype. We used the VEGAS approach for such analysis, which requires LD structure information and individual SNP p-values as input12. The SNP inclusion criteria was the same as that for individual SNP tests. Specifically, we required that SNP imputation accuracy r2 > 0.5 and MAF > 0.01.
Meta-analysis
Significant genes identified in the discovery sample were further replicated in the replication sample. The two gene-based association signals were then jointly analyzed with the Fisher’s method. Specifically, the Fisher’s statistic was calculated as
 |
where p1 and p2 were the two gene-level p-values. Under the null hypothesis of no association, this statistic approximately follows the chi-square distribution with 4 degrees of freedom. Note that the Fisher’s method is always valid regardless of whether the directions of two effect sizes are consistent.
Gene-level effect direction evaluation
To evaluate the consistency of two gene-level effect directions, we studied the effects of all individual SNPs within the gene and proposed an overall gene-level effect direction measure. We then compared the directions of the two measures. To accomplish this, we set all the SNP effects in the discovery sample to be positive so that a gene-level z-score is estimated by  , where
  is the positive z-score of the ith SNP in the discovery sample. If the reported SNP z-score is negative, then the reference allele and the alternative allele will exchange so that the z-score changes to be positive. For example, if the reference allele and the alternative allele are A and G, and the reported z-score of allele A is −1.0, then the allele G, whose z-score is 1.0, will change to the reference allele.
Once all reference alleles are determined by referring to the discovery sample, we will calculate a gene-level z-score for the replication sample as  , where
  is the z-score of the reference allele at the ith SNP. If the zreplication is positive, then it has the same direction as zdiscovery, and we declare that the two genes are consistent in effect direction; otherwise, they are opposite in effect direction.
Results
The basic characteristics of the subjects used in both discovery and replication samples are summarized in Table 1.
Table 1. Basic characteristics of the study subjects.
|
Discovery Sample (Caucasian) |
Replication Sample (Caucasian) |
|||
|---|---|---|---|---|
| Male | Female | Male | Female | |
| No. of subjects | 501 | 499 | 556 | 1727 |
| Age | 50.65 (18.60) | 50.00 (17.90) | 50.71 (16.05) | 51.59 (12.92) |
| Height (m) | 1.77 (0.07) | 1.64 (0.06) | 1.71 (0.07) | 1.62 (0.03) |
| Weight (kg) | 89.20 (14.90) | 71.39 (16.10) | 87.08 (16.70) | 71.46 (16.00) |
| Fat body mass (kg) | 23.46 (8.88) | 26.92 (10.33) | 20.67 (9.30) | 20.92 (13.20) |
| Lean body mass (kg) | 63.67 (8.22) | 43.49 (6.69) | 66.60 (9.59) | 46.85 (7.04) |
| LMI | 2.01 (0.22) | 1.62 (0.23) | 2.15 (1.04) | 1.75 (1.31) |
Discovery sample
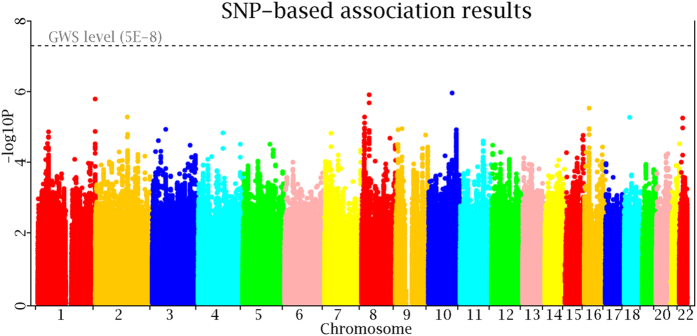
Using the genotyped and imputed genotypes in our sample of 1000 Caucasian subjects with GWAS data, we tested SNPs for association with LMI. Overall genomic control inflation factor was 1.05. To correct for potential population stratification, we adjusted individual p-values by the inflation factor. The logarithmic quantile–quantile (QQ) plot of SNP-based association results is displayed in Fig. 1. No evidence of population stratification is observed after adjustment by the genomic control approach. Manhattan plot of association results across the genome is displayed in Fig. 2. There is no genome-wide significant association signal.
Figure 1. Logarithmic quantile–quantile (QQ) plot of individual SNP-based association.
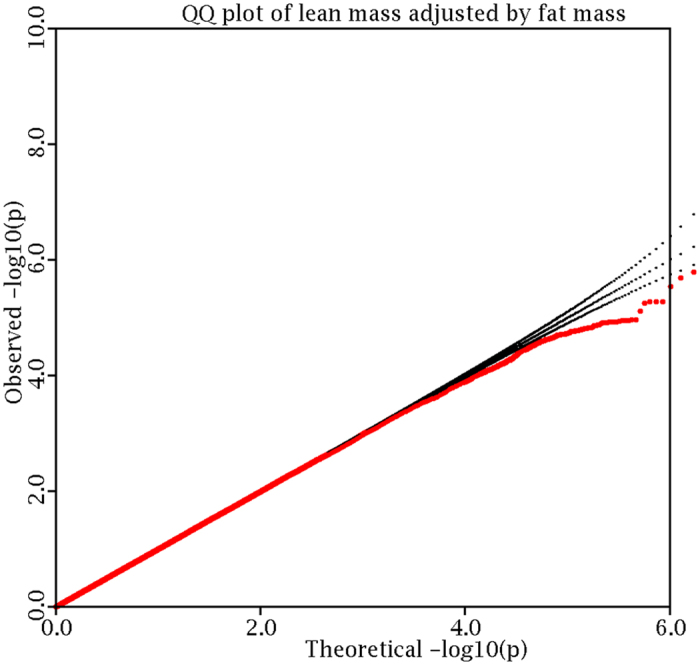
Figure 2. Manhattan plot of individual SNP-based association tests.
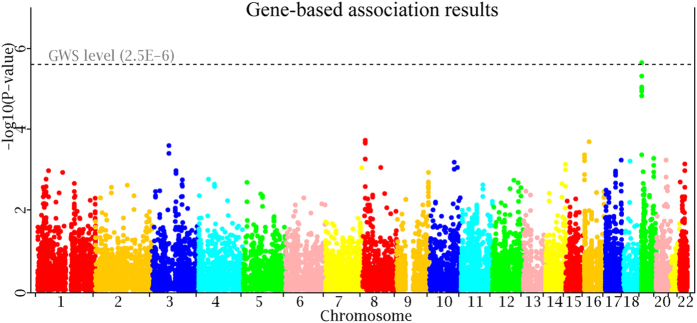
Through individual SNP-based tests, we performed gene-based tests using VEGAS software. A total of 17,511 genes are included in the gene-based association test in the discovery sample. The Bonferroni correction is used to declare the genome-wide significance level (GWS, 0.05/17,511 = 2.86 × 10⁻⁶). The QQ plot of gene-based association results is displayed in Fig. 3. A marked deviation is observed in the tail of the distribution, implying true association signals. The Manhattan plot of gene-based association results is displayed in Fig. 4.
Figure 3. QQ plot of gene-based association tests.
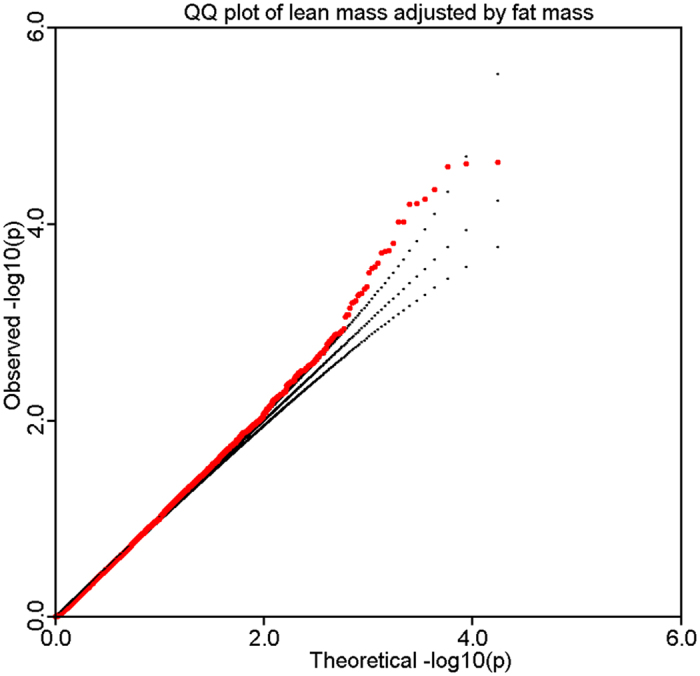
Figure 4. Manhattan plot of gene-based association tests.
None of the genes is significant at the GWS level. At a less stringent borderline level 2 × 10⁻⁴, there are 11 genes that are significant. The most significant gene is GATA4 at 8p23.1 (p = 2.40 × 10⁻⁵). These 11 genes are located into 6 distinct genomic regions.
Replication sample
The 11 suggestively associated genes in the discovery sample are subjected to replication in the replication sample. SNP-based and gene-based association analyses in the replication sample are same to those in the discovery sample. Only three genes from the same locus 19p13.3 (UQCR p = 2.21 × 10⁻³, TCF3 p = 1.84 × 10⁻³, MBD3 p = 6.95 × 10⁻³), while the other 8 genes are not significant.
In the meta-analysis of both the discovery and the replication samples by the Fisher’s method, the signal of UQCR achieves the GWS level (discovery p = 6.10 × 10⁻⁵, replication p = 2.21 × 10⁻³, combined p = 2.26 × 10⁻⁶), while the signals of TCF3 and MBD3 are close to the GWS level (TCF3 combined p = 4.86 × 10⁻⁶, MBD3 combined p = 1.15 × 10⁻⁵).
Combining the evidence from both the discovery and the replication samples, three genes (UQCR, TCF3 and MBD3) from one single locus 19p13.3 are convincingly associated with LMI after adjustment by fat mass. The main results are listed in Table 2.
Table 2. Genes identified for LMI by gene-based association test.
| Gene | Chr | Start | Stop | No. SNPs | Discovery |
Replication |
Combined | ||
|---|---|---|---|---|---|---|---|---|---|
| z | p | z | p | p | |||||
| UQCR | 19 | 1548170 | 1556431 | 30 | 2.36 | 6.10 × 10⁻⁵ | 0.30 | 2.21 × 10⁻³ | 2.26 × 10⁻⁶ |
| TCF3 | 19 | 1560294 | 1601277 | 51 | 1.84 | 1.65 × 10⁻⁴ | 0.41 | 1.84 × 10⁻³ | 4.86 × 10⁻⁶ |
| MBD3 | 19 | 1527677 | 1543652 | 47 | 1.82 | 1.10 × 10⁻⁴ | 0.18 | 6.95 × 10⁻³ | 1.15 × 10⁻⁵ |
Notes: Z-score was the average z-scores over all included SNPs. z-score at each SNP was referred to the increasing-allele in the discovery sample whose z-score was positive by definition. Genome-wide significance (GWS) level significant result was marked in bold.
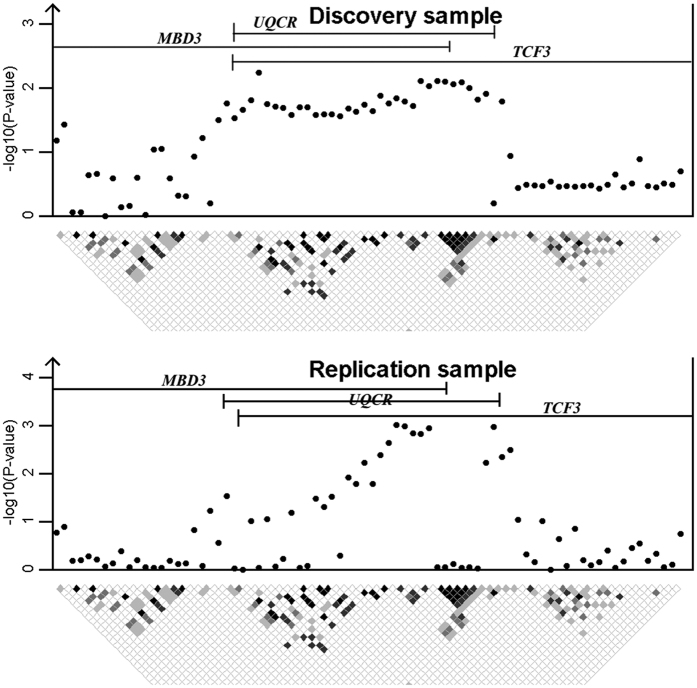
These three genes are apart 170 kb at most. Their tested regions overlap with each other. SNPs in this locus are divided into several haplotype blocks. The regional LD structure and association signals are displayed in Fig. 5.
Figure 5. Regional plot of SNP associations around 19p13.3.
Gene-level effect direction evaluation
We evaluated the consistency of gene-level effect directions between the discovery and the replication samples. We proposed a gene-level effect direction measure in each study and then compared the two measures. The results are listed in Table 2. The z-scores in the discovery sample are always positive by definition. It is clear from the table that the z-scores in the replication sample are also positive in all cases, implying that the two studies are consistent in effect direction for all the three evaluated genes.
Discussion
In this study, we have performed a genome-wide association study in 1000 unrelated Caucasian subjects and replicated in 2283 unrelated Caucasian subjects. Combining evidence from both the discovery sample and the replication sample, we have identified three genes UQCR, TCF3 and MBD3 located at 19p13.3 that were associated with LMI.
Gene density at chromosome 19 is the highest in all the human chromosomes, more than double of the genome-wide average level. The densely located gene families of repetitive DNA sequences implies it being the chromosome of biological and evolutionary significance25,26.
The product of the UQCR gene is the ubiquinol-cytochrome c reductase complex, also called mitochondrial complex III. It functions to form a part of the mitochondrial respiratory chain. It may also act as a binding factor for the iron-sulfur protein. Mitochondrial Complex III is composed of one mitochondrial-encoded subunit (MT-CYB) and ten nuclear-encoded subunits. The complex is located within the mitochondrial inner membrane and plays an important role in biochemical synthesis of ATP. It functions to catalyze electrons to transfer from succinate and nicotinamide adenine dinucleotide linked dehydrogenases to mitochondrially encoded cytochrome b. It also functions to utilize the energy to translocate protons across the membrane27. Deficiency of isolated complex III has been detected in patients of neuromuscular and nonneuromuscular disorders in both children and adults28.
TCF3 (Transcription factor 3) gene encodes two basic helix-loop-helix(HLH) transcription factors E12 (synonyms–Immunoglobulin Transcription Factor-1 (ITF1)) and E47 (Transcription Factor-3 (TCF-3))29. These two factors are believed to function in the regulation of cell growth, differentiation of muscle cells, and commitment. The mechanism is that they act as dimerisation partners for lineage-specific HLH proteins such as the myogenic factors myoblast determination (Myod) and myogenin (Myog)30.
The processes of myogenic specification and differentiation are regulated by a family of myogenic basic HLH transcription factors that include Myod, Myog, myogenic factor 5 (Myf5), and myogenic factor 6 (Myf6) in the human31. These heterodimers yield a sophisticated pathway (Supplemental Fig. 1) that leads to the expression of critical genes that are specific to muscle. They also promote precursor cells (myoblasts) to develop into multinucleated and differentiated muscle cells (myotubes)32.
The MBD3 (methyl-binding 3) gene encoded protein is a subunit of the NuRD, a multi-subunit complex comprised of Hdac1 (histone deacetylase1), Hdac2, Rbbp7 and Rbbp4 containing nucleosome remodeling and histone deacetylase activities33. The class I histone deacetylase Hdac1 is directed associated with MyoD. It is capable of deacetylating MyoD and blocking the function of the latter from initiating the myogenic program under differentiation conditions34. In differentiating muscle cells, the reduced level of HDAC1 is associated with increased level of MyoD acetylation, which stimulates transcription35.
Despite their potential relevance to lean mass development, it is unlikely that all the three identified genes are causal. This is because these genes are identified through statistical association instead of biological validation. Statistical association is affected by LD structure, and is usually called indirect gene mapping. These three genes have overlapping test regions, and they present strong levels of LD.
To further explore their potentially causal role, we used a recently developed method PrediXcan to analyze the three identified genes36. In brief, the PrediXcan method imputes the unobserved gene expression levels of the GWAS samples, and examines the association between imputed gene expressions and the trait. Unfortunately, none of the three identified genes is significant by the PrediXcan method (p > 0.05). We recognized that the PrediXcan method relies on the eQTL effect of SNPs to the analyzed gene. To evaluate whether the eQTL effect is present, we searched the GTEx datasets through Haploreg37, and found that the eQTL effects are very limited for analyzed SNPs. For example, of the 34 SNPs used to calculate the UQCR gene signal, none has eQTL activity to its expression. The determination of causal genes are still awaiting further functional studies.
In summary, we identified the 19p13.3 region containing UQCR, TCF3 and MBD3 genes, which were significantly associated with LMI in the Caucasian population. These results, together with the known functions of the three genes related to LBM, support that the 19p13.3 region containing UQCR TCF3 and MBD3 genes is a novel locus underlying human LBM.
Additional Information
How to cite this article: Ran, S. et al. Gene-based genome-wide association study identified 19p13.3 for lean body mass. Sci. Rep. 7, 45025; doi: 10.1038/srep45025 (2017).
Publisher's note: Springer Nature remains neutral with regard to jurisdictional claims in published maps and institutional affiliations.
Acknowledgments
The study was partially supported by startup fund from Shanghai University of Science and Technology and Shanghai Leading Academic Discipline Project (S30501). The investigators of this work were partially supported by grants from NIH (R01AG026564, RC2DE020756, R01AR057049, R01AR050496 and R03TW008221), a SCOR (Specialized Center of Research) grant (P50AR055081) supported by National Institute of Arthritis and Musculoskeletal and Skin Diseases (NIAMS) and the Office of Research on Women’s Health (ORWH), the Edward G. Schlieder Endowment and the Franklin D. Dickson/Missouri Endowment, the National Natural Science Foundation of China (31571291 to L.Z., 31501026 to Y.F.P., 31301092 to Y.L.), the Natural Science Foundation of Jiangsu Province (BK20150323 to Y.F.P.), the undergraduate innovation program of Jiangsu province (201610285040Z to A.P.F.) and a project of the priority academic program development of Jiangsu higher education institutions.
Footnotes
The authors declare no competing financial interests.
Author Contributions Conceived and designed the experiments: H.W.D. Performed the experiments: S.R., L.Z., Y.F.P. and Y.Y.H. Analyzed the data: Y.F.P., L.Z., L.Z., L.L., X.L., A.P.F., W.W.K., X.Y.Y., W.Z., Y.L., Q.T., H.S. and Y.H.Z. Literature search: L.L., X.L., A.P.F., W.W.K., X.Y.Y. and W.Z. Wrote the paper: S.R., L.Z. and H.W.D. All authors reviewed and approved the manuscript.
References
- Sipila S. et al. Endogenous hormones, muscle strength, and risk of fall-related fractures in older women. J Gerontol a-Biol 61, 92–96 (2006). [DOI] [PubMed] [Google Scholar]
- Karakelides H. & Nair K. S. Sarcopenia of aging and its metabolic impact. Curr Top Dev Biol 68, 123–148 (2005). [DOI] [PubMed] [Google Scholar]
- Hsu F. C. et al. Heritability of body composition measured by DXA in the diabetes heart study. Obesity Research 13, 312–319 (2005). [DOI] [PubMed] [Google Scholar]
- Nguyen T. V., Howard G. M., Kelly P. J. & Eisman J. A. Bone mass, lean mass, and fat mass: Same genes or same environments? Am J Epidemiol 147, 3–16 (1998). [DOI] [PubMed] [Google Scholar]
- Korostishevsky M. et al. Genomics and metabolomics of muscular mass in a community-based sample of UK females. Eur J Hum Genet 24, 277–283 (2016). [DOI] [PMC free article] [PubMed] [Google Scholar]
- Urano T., Shiraki M., Sasaki N., Ouchi Y. & Inoue S. Large-scale analysis reveals a functional single-nucleotide polymorphism in the 5′-flanking region of PRDM16 gene associated with lean body mass. Aging Cell 13, 739–743 (2014). [DOI] [PMC free article] [PubMed] [Google Scholar]
- Patel H. P. et al. Lean Mass, Muscle Strength and Gene Expression in Community Dwelling Older Men: Findings from the Hertfordshire Sarcopenia Study (HSS). Calcified Tissue Int 95, 308–316 (2014). [DOI] [PubMed] [Google Scholar]
- Baumgartner R. N. et al. Epidemiology of sarcopenia among the elderly in New Mexico. Am J Epidemiol 147, 755–763 (1998). [DOI] [PubMed] [Google Scholar]
- Cruz-Jentoft A. J. et al. Sarcopenia: European consensus on definition and diagnosis. Age Ageing 39, 412–423 (2010). [DOI] [PMC free article] [PubMed] [Google Scholar]
- Li M. X., Gui H. S., Kwan J. S. H & Sham P. C. GATES: A Rapid and Powerful Gene-Based Association Test Using Extended Simes Procedure. Am J Hum Genet 88, 283–293 (2011). [DOI] [PMC free article] [PubMed] [Google Scholar]
- Huang H. L., Chanda P., Alonso A., Bader J. S. & Arking D. E. Gene-Based Tests of Association. Plos Genet 7 (2011). [DOI] [PMC free article] [PubMed] [Google Scholar]
- Liu J. Z. et al. A Versatile Gene-Based Test for Genome-wide Association Studies. Am J Hum Genet 87, 139–145 (2010). [DOI] [PMC free article] [PubMed] [Google Scholar]
- Deng H. W. et al. A genomewide linkage scan for quantitative-trait loci for obesity phenotypes. Am J Hum Genet 70, 1138–1151 (2002). [DOI] [PMC free article] [PubMed] [Google Scholar]
- Wang J. et al. Independent associations of body-size adjusted fat mass and fat-free mass with the metabolic syndrome in Chinese. Ann Hum Biol 36, 110–121 (2009). [DOI] [PubMed] [Google Scholar]
- Liu Y. J. et al. Genome-wide association scans identified CTNNBL1 as a novel gene for obesity. Hum Mol Genet 17, 1803–1813 (2008). [DOI] [PMC free article] [PubMed] [Google Scholar]
- Marchini J., Howie B., Myers S., McVean G. & Donnelly P. A new multipoint method for genome-wide association studies by imputation of genotypes. Nat Genet 39, 906–913 (2007). [DOI] [PubMed] [Google Scholar]
- Howie B., Fuchsberger C., Stephens M., Marchini J. & Abecasis G. R. Fast and accurate genotype imputation in genome-wide association studies through pre-phasing. Nat Genet 44, 955-+ (2012). [DOI] [PMC free article] [PubMed] [Google Scholar]
- Zhu X., Li S., Cooper R. S. & Elston R. C. A unified association analysis approach for family and unrelated samples correcting for stratification. American journal of human genetics 82, 352–365 (2008). [DOI] [PMC free article] [PubMed] [Google Scholar]
- Liang J. J. et al. Comparison of Heritability Estimation and Linkage Analysis for Multiple Traits Using Principal Component Analyses. Genet Epidemiol 40, 222–232 (2016). [DOI] [PMC free article] [PubMed] [Google Scholar]
- Chen X. et al. Pathway-Based Analysis for Genome-Wide Association Studies Using Supervised Principal Components. Genet Epidemiol 34, 716–724 (2010). [DOI] [PMC free article] [PubMed] [Google Scholar]
- Li Y., Willer C., Sanna S. & Abecasis G. Genotype Imputation. Annu Rev Genom Hum G 10, 387–406 (2009). [DOI] [PMC free article] [PubMed] [Google Scholar]
- Li Y., Willer C. J., Ding J., Scheet P & Abecasis G. R. MaCH: Using Sequence and Genotype Data to Estimate Haplotypes and Unobserved Genotypes. Genet Epidemiol 34, 816–834 (2010). [DOI] [PMC free article] [PubMed] [Google Scholar]
- Barrett J. C., Fry B., Maller J. & Daly M. J. Haploview: analysis and visualization of LD and haplotype maps. Bioinformatics 21, 263–265 (2005). [DOI] [PubMed] [Google Scholar]
- Devlin B., Roeder K. & Wasserman L. Genomic control, a new approach to genetic-based association studies. Theor Popul Biol 60, 155–166 (2001). [DOI] [PubMed] [Google Scholar]
- Venter J. C. The sequence of the human genome (vol 292, pg 1304, 2001). Science 292, 1838–1838 (2001). [Google Scholar]
- Lander E. S. et al. Initial sequencing and analysis of the human genome. Nature 409, 860–921 (2001). [DOI] [PubMed] [Google Scholar]
- Fernandez-Vizarra E. et al. Impaired complex III assembly associated with BCS1L gene mutations in isolated mitochondrial encephalopathy. Hum Mol Genet 16, 1241–1252 (2007). [DOI] [PubMed] [Google Scholar]
- Visapaa I. et al. GRACILE syndrome, a lethal metabolic disorder with iron overload, is caused by a point mutation in BCS1L. Am J Hum Genet 71, 863–876 (2002). [DOI] [PMC free article] [PubMed] [Google Scholar]
- Slattery C., Ryan M. P. & McMorro T. E2A proteins: Regulators of cell phenotype in normal physiology and disease. Int J Biochem Cell B 40, 1431–1436 (2008). [DOI] [PubMed] [Google Scholar]
- Massari M. E. & Murre C. Helix-loop-helix proteins: Regulators of transcription in eucaryotic organisms. Mol Cell Biol 20, 429–440 (2000). [DOI] [PMC free article] [PubMed] [Google Scholar]
- Krauss R. S. et al. Close encounters: regulation of vertebrate skeletal myogenesis by cell-cell contact. J Cell Sci 118, 2355–2362 (2005). [DOI] [PubMed] [Google Scholar]
- Arnold H. H. & Winter B. Muscle differentiation: more complexity to the network of myogenic regulators. Curr Opin Genet Dev 8, 539–544 (1998). [DOI] [PubMed] [Google Scholar]
- Kaji K., Nichols J. & Hendrich B. Mbd3, a component of the NuRD co-repressor complex, is required for development of pluripotent cells. Development 134, 1123–1132 (2007). [DOI] [PubMed] [Google Scholar]
- Mal A., Sturniolo M., Schiltz R. L., Ghosh M. K. & Harter M. L. A role for histone deacetylase HDAC1 in modulating the transcriptional activity of MyoD: inhibition of the myogenic program. Embo J 20, 1739–1753 (2001). [DOI] [PMC free article] [PubMed] [Google Scholar]
- Jo C., Jang B. G. & Jo S. A. MEK1 plays contrary stage-specific roles in skeletal myogenic differentiation. Cell Signal 21, 1910–1917 (2009). [DOI] [PubMed] [Google Scholar]
- Gamazon E. R. et al. A gene-based association method for mapping traits using reference transcriptome data. Nature genetics 47, 1091–1098 (2015). [DOI] [PMC free article] [PubMed] [Google Scholar]
- Ward L. D. & Kellis M. HaploReg: a resource for exploring chromatin states, conservation, and regulatory motif alterations within sets of genetically linked variants. Nucleic acids research 40, D930–934 (2012). [DOI] [PMC free article] [PubMed] [Google Scholar]


