Abstract
PM2.5 plays a key role in the solar radiation budget and air quality assessments, but observations and historical data are relatively rare for Beijing. Based on the synchronous monitoring of PM2.5 and broadband solar radiation (Rs), a logarithmic function was developed to describe the quantitative relationship between these parameters. This empirical parameterization was employed to calculate Rsn from PM2.5 with normalized mean bias (NMB) −0.09 and calculate PM2.5 concentration from Rsn with NMB −0.12. Our results indicate that this parameterization provides an efficient and straightforward method for estimating PM2.5 from Rs or Rs from PM2.5.
Aerosol particles not only impair the direction of solar radiation through the extinction effect but also interfere with the progress of atmospheric longwave radiation, which influences the energy balance1. The direct and indirect effects of aerosols on Rs in the megalopolis of Beijing and its surrounding areas have been discussed by many scholars and researchers. For example, Rs in Beijing has declined at a rate of 5% per decade since the late 1980s, and this pattern is similar to the decrease of cloud cover over the same period. Previous studies noted that the aerosol concentration may play a more important role in Rs dimming than cloud cover2,3,4. They also suggested that enhanced absorption by the aerosol particles can explain why the diffuse irradiance in the Beijing area has decreased more than 3% per decade, accompanied by an increase in aerosol loading over the last 40 years.
Accompanied by accelerated urbanization and industrialization, remarkably poor air quality and haze pollution have appeared in most regions of China5,6. Regionally severe and complicated air pollution (coal smoke pollution, photochemical smog, etc.) has frequently appeared and is even worse in city clusters. For example, the annual average concentration of the aerosol particle PM2.5 (airborne particles with aerodynamic diameters less than 2.5 μm) reached 72.3 μg m−3 in Beijing from 2004 to 2012. This concentration exceeded 2–5 times that in other developed countries5,7. It is well known that aerosols lead to a significant impairment in the radiation balance due to the scattering and absorption effects on radiant transfer through the atmosphere. Aerosols also weaken the turbulence in the atmosphere, which restrains the development process of the planetary boundary layer (PBL), followed by a weakening of the atmospheric pollutant dispersion ability, leading to heavy pollution8,9. There is no doubt that aerosols play an important role in both global energy balance and the environment. However, quantitative evaluations of aerosol effects on the environment are problematic, especially in the PBL, where evaluation is very difficult due to the large uncertainties in the radiative properties of atmospheric aerosols, which are determined by the chemical and physical properties of aerosol. It should be noted that studies that have focused on the effect of aerosols on solar radiation variation, and PBL evolution processes are mainly based on hypotheses.
Many researchers have sought to retrieve the PM2.5 concentration from the aerosol optical depth (AOD), such as in the U.S. Environmental Protection Agency’s AIRNow program10,11,12. As we know, PM2.5 concentration and AOD are two significantly different physical quantities. The PM2.5 concentrations represent aerosol particle loading at the surface, whereas AOD characterizes the instantaneous integrated vertical profiles of the aerosol extinction coefficient. Fortunately, more than 80% of the aerosol particles are agglomerated in the surface layer, which indicates that the relationship between the PM2.5 concentration and AOD can be quantitatively measured. Therefore, a widely used empirical equation has been established to convey the relation between AOD and the PM2.5 concentration. For example, Al-Saadi et al.12 revealed that AOD can be used to reconstruct the PM2.5 concentration, with the conversion factor of AOD to PM2.5 concentration ranging from 25 to 60 (mg/m3/AOD) over the eastern U.S., and indicated there are more physical links between AOD and PM2.5 concentration under the appropriate assumptions and created theoretical and reliable methods to convert AOD to PM2.5 concentration13.
Xia14 provided a straightforward method to estimate Rs under clear sky conditions with AOD and indicated that AOD can be directly calculated from Rs and other parameters. Li et al.15 reported that the PM2.5 concentration could be accurately estimated from the fine-mode aerosol optical depth, and Tsai et al.16 evaluated the accuracy of estimating the PM2.5 concentration from AOD and confirmed that AOD could be used to obtain acceptable PM2.5 concentrations.
Similar to the AIRNow program methods, the relationship between Rs and the PM2.5 concentration is investigated in this study. An empirical equation is established to convert Rs to the PM2.5 concentration. Long-term simultaneous in situ measurements of PM2.5 concentrations and solar radiation in Beijing provide a chance to quantitatively analyse the interaction between PM2.5 concentration and Rs.
The aim of this study was to explore the variation in the temporal properties of PM2.5 and Rs from sunrise to sunset using in situ data from 2005 to 2015 in Beijing. In addition, a straightforward equation for estimating PM2.5 from Rs was developed based on the quantitative relationship between PM2.5 and Rs.
Results
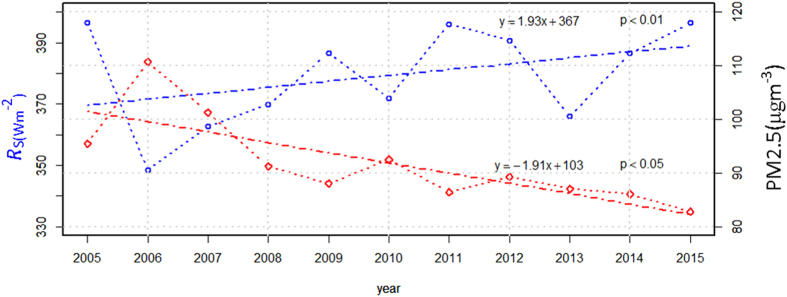
The annual variation in the PM2.5 concentration over Beijing during the study period is presented in Fig. 1. The average annual value for 2005–2015 was 91.9 μg m−3. The highest annual average occurred in 2006, and this was caused by increased occurrences of dust events in the spring of 2006. The PM2.5 concentration during the study period was evidently lower than that observed in 2000 in Beijing17, where the values reached 127 μg m−3 . However, the annual PM2.5 concentration in Beijing during the study period was 6 times higher than the National Ambient Air Quality Standard of the U.S. The PM2.5 concentration in Beijing has persistently declined since 2006, with a rate of decline of 1.91 μg m−3 per year, and this decreasing trend was statistically significant at the 95% confidence level. The PM2.5 concentration in Beijing has remained at a relatively low level since 2008, and the trend has decreased sharply over the past 3 years. These results indicate that the implementation of the recent air pollution improvement programme in Beijing has reduced fine particle pollution.
Figure 1. Variation of the PM2.5 concentration and Rs in Beijing from 2005 to 2015.
P < 0.01 denotes that this linear trend is statistically significant at the 99% confidence level. P < 0.05 denotes that this linear trend is statistically significant at the 95% confidence level. The figure was produced using MATLAB.
The average value of Rs during 2005–2015 was 379.2 W m−2. The lowest annual average occurred in 2006 and was due to the highest PM2.5 concentration that also occurred in 2006. The Rs in Beijing has been increasing since 2006, with a rate of increase of 1.93 W m−2 per year, and this increasing trend was statistically significant at the 99% confidence level. At the same time, there were significant decreasing trends of PM2.5 concentration in Beijing during this period. The trend variations of Rs were opposite to the trends of PM2.5.
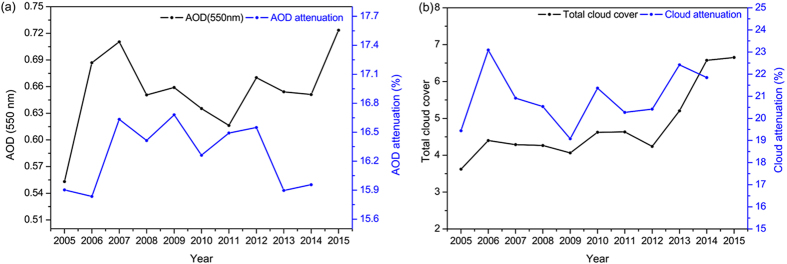
As mentioned above, the amount of Rs received at the Earth’s surface mainly depends on the extinction effects caused by aerosols and clouds. The trends of AOD and the attenuation of Rs by AOD are shown in Fig. 2. As shown in this figure, the trends of AOD are not precisely consistent with those of PM2.5, and this difference can be explained by the fact that AOD is calculated for clear sky conditions rather than PM2.5, which is calculated for all sky conditions. The trends of AOD or AOD attenuation are not in concert with Rs and cannot completely explain the increase of Rs in Beijing. This may be due to the AOD values only being available under clear sky conditions. Of course, the other main influence of cloud cover on Rs should be considered when explaining the variation characteristics of Rs. Figure 2b depicts the changes in cloud cover and the attenuation effect of cloud cover on Rs during this period. The surface observed cloud cover is provided by the Meteorological Information Comprehensive Analysis and Process System (MICAPS) from 2005 to 2015. There was a negative correlation between Rs and the attenuation effect of cloud cover on Rs. The total cloud cover showed a weak increase trend before 2012 and clearly increased after that. The attenuation effect of cloud cover on Rs generally increased during the study period and could not explain the increase of Rs. Thus, the increase trend of Rs is most likely caused by the decrease of aerosol concentration. In this study, we try to prove this assumption with analysis of the quantitative relationship between PM2.5 concentration and Rs.
Figure 2. Annual variations of the AOD, cloud cover and the extinction effects of the AOD and cloud cover relative to Rs attenuation.
(a) Time series of AOD and the contributions of the AOD to Rs attenuation; and (b) time series of cloud cover and the contributions of the cloud cover to Rs attenuation. Cloud cover obtained from CMA. The figure was produced using OriginPro.
Previous research has noted that an accurate Rs can be obtained under clear conditions using SBDART4 and parameterization methods14. The surface albedo, ozone, water vapour, AOD, single-scattering albedo and asymmetry factor were the essential parameters used by SBDART to model Rs. The ozone data were downloaded from OMI (http://acd-ext.gsfc.nasa.gov/Data_services/merged/index.html), and water vapour data were obtained from AERONET. The input parameters of aerosol were also obtained from AERONET. We interpolated and extrapolated the SBDART method to calculate the aerosols’ parameters to meet the spectral signatures of the SBDART model. We used the data collected in 2013 in Beijing to evaluate the performance of SBDART.
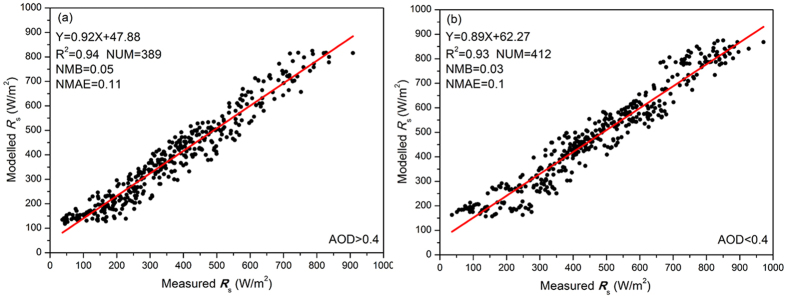
AOD (440 nm) was less than 0.38 under clear sky conditions and greater than 0.4 in haze-fog weather. We used this categorization to classify clear and haze-fog conditions. Figure 3 compares the measured and modelled values of Rs. The model simulations can account for more than 94% of the measurement variances in both clear and haze-fog conditions.
Figure 3. Comparison of measured and modelled Rs based on measured AOD under clear and haze-fog events in 2013 in Beijing.
The figure was produced using OriginPro.
The statistical parameter normalized mean bias (NMB) and normalized mean absolute error (NMAE)18 were used to evaluate the performance of the model. The NMB values between the simulations and measurements were 0.03 and 0.05 in clear and haze-fog conditions, respectively. The NMAE were less than 0.1 under both sky conditions. And this indicates the model overestimates the observations by a factor of 1.05, the absolute gross error is 1.1 times the mean observation and model prediction for over prediction. The linear fits show statistically significant values at a 99% confidence level. The statistical results show that under both clear and haze-fog conditions, SBDART can produce a satisfactory result, which indicates that Rs can be accurately calculated from AOD using this radiative transfer model. As mentioned before, AOD can be inversed from PM2.5 concentration, and this indicated that the parameters of PM2.5 concentration can be used to calculate Rs with an acceptable accuracy. In other words, the relationship between PM2.5 concentration and Rs can be used to reconstruct one from the other.
The monthly averages of PM2.5 concentration and Rsn were used to analyse the influence of PM2.5 on Rsn. In Fig. 4, we can see that there is a good negative linear correlation between the monthly averages of Rsn and PM2.5 concentration in Beijing. This result indicates that one of these two parameters can be estimated from each other using the empirical equation. The amount of Rsn primarily depends on the solar zenith angle (θ) and extinction effects by gases and particles; thus, we first dispelled the influence of the zenith angle on Rsn by multiplying the sine of the solar zenith angle, referred to as the normalized Rsn. Then, we classified the measured PM2.5 into different bins and calculated the average Rsn for each bin. The scatter plot of the dependence of Rsn on PM2.5 from 2005 to 2010 is presented in Fig. 5. There is a logarithmic relationship between PM2.5 and Rsn. The parameterization equation for calculating Rs from PM2.5 is as follows:
Figure 4. Comparison of the monthly average of PM2.5 concentration to Rsn measurements in Beijing from 2005 to 2015.
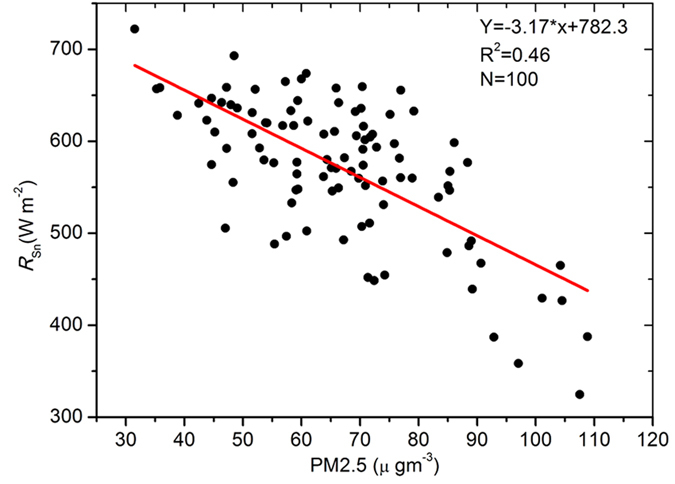
The figure was produced using OriginPro.
Figure 5. Scatter plot of the dependence of Rsn on PM2.5 concentration using measured data from 2005 to 2010.
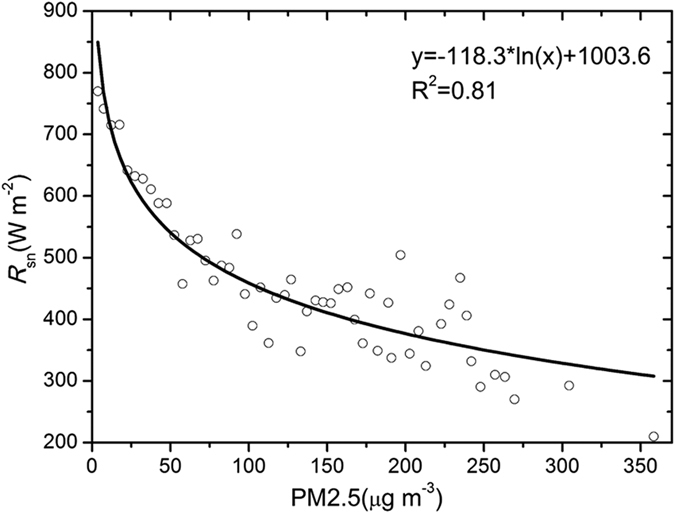
The figure was produced using OriginPro.
 |
 |
where Rs is in situ measured data, θ is the solar zenith angle, and PM2.5 concentration is the measured concentration of PM2.5.
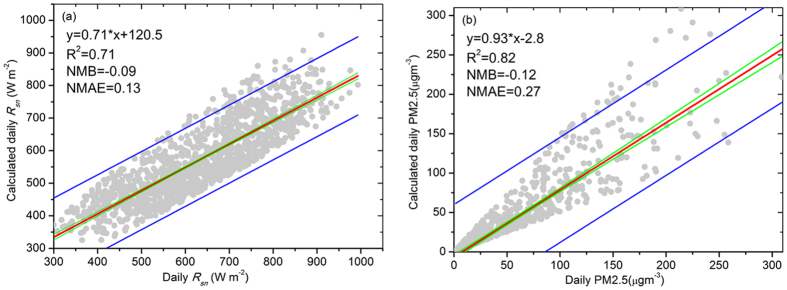
To evaluate the effectiveness of the empirical parameterization for Rsn from the measured PM2.5 concentration or the aerosol concentrations estimated from measured Rsn, measured daily Rsn and PM2.5 concentration from 2011 to 2015 were used. The comparison results show that there was a good linear relationship between the measured and modelled values, except for 1% out of the 90% confidence level limits (Fig. 6). The slope of the linear regression was less than 1, which indicated that this method underestimates Rsn. The NMB and NMAE were −0.09 and 0.13, respectively. The performance of the method in calculating the PM2.5 concentration is shown in Fig. 6b. The slope was near 1, and the NMB and NMAE were −0.12 and 0.27, respectively. When we compared this result to the relative error between the measured and inversely calculated PM2.5 concentration from AOD in Beijing19, this method provides more reliable results for further analysis. This indicates that the parameterization equation established in this study can provide reliable inversion results for both Rsn and the PM2.5 concentrations.
Figure 6. Scatter plot of the in situ measured and estimated values using the proposed method using data measured in Beijing from 2011 to 2015.
(a) Comparison of measured and modelled Rsn; and (b) comparison of measured and modelled PM2.5 concentrations. The fitted regression line (in red), the 90% confidence limits (in blue), and the 95% prediction limits (in green) are displayed. The figure was produced using OriginPro.
The in situ measured data from Xianghe and Shangdianzi stations were used to test the transferability of this estimation method. The statistical results of linear regression between calculated and observed data indicated that this method can provide an acceptable calculated PM2.5 concentration and Rsn for the NCP region (Figs S2 and S3).
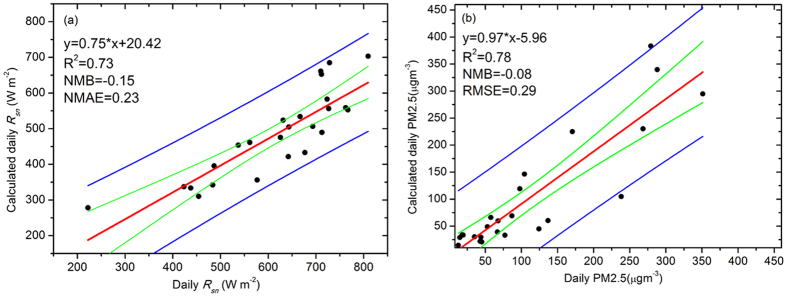
To assess the performance of the method in extreme pollution events, the heavy haze pollution episode in January 2013 in Beijing was used to evaluate the estimation equation. Figure 7 shows the comparison between measured Rsn values and calculations from the parameterization Eq. (1). The NMB and NMAE values were −0.15 and 0.23, respectively. The slopes of both the measured and modelled Rsn and PM2.5 slightly improved, especially the inversion results of PM2.5, whose slope and NMB were 0.97 and −0.08, respectively. These results again indicate that this parameterization method provides reliable results in any event, besides the model underestimates the observations by a factor of about 1.13, the absolute gross error is 1.23 times the mean observation and model prediction for over prediction.
Figure 7.
Comparison of the estimated and measured values of (a) Rsn and (b) PM2.5. The fitted regression line (in red), 90% confidence limits (in blue), and 95% prediction limits (in green) are displayed. The figure was produced using OriginPro.
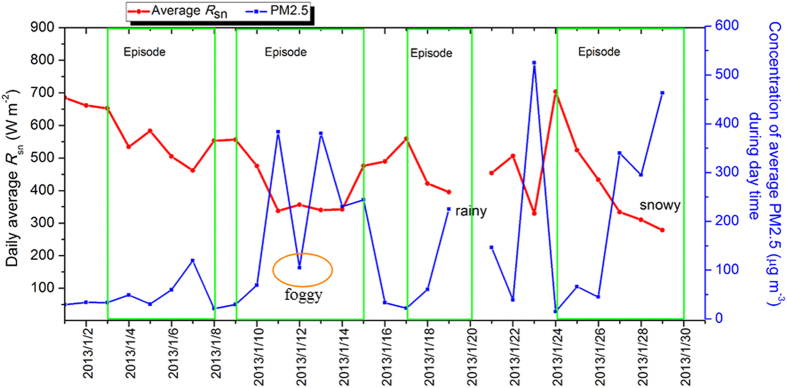
As we know, aerosol can be directly and indirectly influence energy balance via scattering and absorbing effects, and then impact climate. Guo et al.20 and Zhang et al.21 claimed that there is a significant periodic cycle of aerosol concentration in Beijing, and this cycle is mainly controlled by the meteorologic condition. The periodic cycle of PM2.5 concentration presented as a 2- to 7-day variation cycle. The in situ measured data from the January 2013 heavy haze pollution episode has been used to investigate variation trends of Rsn and PM2.5 concentration in Beijing. There is a significant opposite change trend of Rsn compared with PM2.5 concentration (Fig. S4).
The variation of calculated PM2.5 concentration and Rsn is presented in Fig. 8, and the missing data was due to rainy and snowy weather processes. The calculated PM2.5 concentration and Rsn were not consistent with the in situ measurements on January 12, 2013, which may be caused by the dense fog. Evidently, the variation cycle of the calculated Rsn and PM2.5 concentration during the January 2013 pollution period exhibits a clear variation cycle, the same as the measured results.
Figure 8. Periodic variation cycles of calculated Rsn and PM2.5 concentration in Beijing during the heavy haze pollution episode of January 2013.
The figure was produced using OriginPro.
Discussion
A series of reports indicated that the impact of aerosols on downwelling solar irradiance (Rs) was significant and simultaneously impaired visibility in most parts of China2,3,4. Studies of sky dimming or brightening across the whole world have focused on long-term variations of Rs. The variation of Rs in China was significantly different from other regions, which mainly presents the decrease of Rs along with cloud cover decreasing. This indicated that dimming or brightening could not be explained solely by the variation in cloud cover. Many previous results recognized that a sharp increase in anthropogenic aerosol was sufficient to explain the dimming accompanied by cloud cover decrease in China. Liang and Xia22 provide a reliable explanation for the transition of Rs from a tendency to decrease to no significant trend since the 1980s, due to the increments of the aerosol single scattering albedo during this period. According to the analysis in this study, it can be concluded that the long-term variation of PM2.5 concentration has a significant influence on the tendency of Rs in China, especially in city clusters, and this can be used to estimate the PM2.5 concentration and other parameters, which is very important for air quality studies, especially in the areas outside cities without routine measured PM2.5 concentration. Furthermore, this method can prove historic PM2.5 concentration datasets to address the reasons for variation trends of Rs in China.
In this study, we developed a simple and effective parameterization estimation model for estimating the PM2.5 concentration from the more routine measured Rs, or Rs from PM2.5 concentration. The advantage of this method is that the input parameter is simple and more easily obtained, and this will afford a powerful tool for the study of air pollution and interactions between aerosol and radiation. However, this method is not suitable for rain, dust storms, and snow events, and the calculation accuracy decreases when transferred to another site. This may be due to the differences in aerosol size distribution, chemical composition, BC concentration and mixing state of BC. Peng et al.23 suggested that aged black carbon (BC) aerosol, enhanced by a factor of approximately 2.4 to fresh BC, and BC direct radiative forcing (DRF) are approximately 0.77 W m−2. The ageing period is shorter than other sites. These results indicate that the impact of BC on air quality and climate should receive more attention in this region. As we know, the DRF caused by an increased concentration of BC is mainly dependent on the externally or internally mixing state, and atmospheric ageing progress. However, the DRF of BC was still highly uncertain. Therefore, we used the SBDART and aerosol absorption optical depth (AAOD) from AERONET during 2005–2014 to calculate the influence of BC on the energy balance through Beijing (Supplementary Material: The impact of BC on Rs reach at the surface accounted for 21.8% of aerosol on Rs under clear sky conditions (Fig. S5), and this indicated that BC plays an important role in the attention effect on Rs. Therefore, we will endeavour to improve the accuracy and transferability of this estimation method on a larger scale, considering the influence of clouds, aerosol physical and chemical properties, and BC on Rs in further studies.
Aerosol is the main factor impairing visibility and can damage vegetation; at worst, it can cause respiratory difficulties, a variety of other health problems or even premature death. Comprehensive monitoring and analysis of PM2.5 results in societal and economic benefits by advanced planning; therefore, the accurate measurement or estimation of PM2.5 is important. The PM2.5 networks belonging to the China Environmental Protection Agency are still spatially scarce, with only 74 cities measuring PM2.5 in 2013 and 338 cities in 2015. However, these observation stations mainly focus on the city; therefore, the satellite-inverted method has been developed to estimate PM2.5 concentration. Even if acceptable, AOD has been inverted from few satellite observations since 2000 (e.g. the Moderate Resolution Imaging Spectroradiometer (MODIS). The parameterizations in this study provide a straightforward method to calculate PM2.5 from Rs.
In this study, we used global solar radiation measurements that are easier to obtain than direct solar radiation. There were more than 100 stations belonging to the China Meteorological Administration (CMA) and 44 stations belonging to the Chinese Ecosystem Research Network (CERN) that take global solar radiation measurements routinely. The measured Rs data that came from CMA can be traced back to 1961. Furthermore, many results indicate that sunshine duration can be used to calculate acceptable Rs24,25 therefore, the highest spatial and temporal distribution of PM2.5 concentration can be obtained by using this method.
Conclusion
Solar radiation and aerosol are the most important physical quantities that influence climate change and the atmospheric environment. Based on the analysis of the relationship between long-term measured Rs and PM2.5 concentration, it can be concluded that the long-term variation of PM2.5 has a significant influence on the tendency of Rs in China, especially in city clusters. An effective parameterization of Rs using a logarithmic function of these two parameters was developed. Thus, acceptable PM2.5 concentrations could be estimated from Rs, which significantly improved PM2.5 revision from AOD. Another advantage was that this straightforward method has been established to estimate Rs from PM2.5 and vice versa.
Methods
Site description
The super aerosol observation station, focused on the physicochemical characteristics of atmospheric particles, was located in downtown Beijing (39°56|N, 116°17|E, and 75.0 m a.s.l.). The station was near the Institute of Atmospheric Physics, Chinese Academy of Sciences (IAP) 325-m meteorological tower, which was located between the Third and Fourth Ring Roads. This location was surrounded by domestic dwellings, Madian Park in the southeast and Yuandadu Park to the east and west. Liu et al.7 confirmed that this station can be used to represent the atmospheric pollution in Beijing, and Hu et al.26 declared that this site could feature the energy balance properties in Beijing. The measured results obtained from this station can be used to characterize the average properties of the atmospheric environment in urban Beijing. The suburban station Xianghe (39°47′N, 116°57′E, 95 m a.s.l.) and rural station Shangdianzi (40°39′N, 117°07′E, 293.9 m a.s.l.) are used to evaluate the performance of transferability of the quantitative relationship between Rs and PM2.5 concentrations (Fig. S1).
The Santa Barbara DISORT Atmospheric Radiative Transfer (SBDART) model was used to calculate Rs. The inputs for this model were easy to obtain, such as aerosol optical property parameters, surface albedo and cloud property parameters27.
The amount of Rs depends primarily on the solar zenith angle (θ) and extinction effects by gases and particles. Quantitative analysis of the relationship between Rs and aerosol loading under clear sky conditions has been performed by Xia14 using measured aerosol optical depth and Rs, but observations in all sky conditions are limited.
Thus, we used simultaneous observation data of Rs and the PM2.5 concentration during the sunrise to sunset period under all sky conditions, except for rain, dust storms, and snow events, to establish the relationship between these two parameters. First, we dispelled the influence of the zenith angle on Rs by multiplying by sec (θ), referred to as the normalized Rs (Rsn); second, the loading of aerosol during the day was calculated using the hourly dataset (after excluding rain, dust storms, and snow events); third, in order to reduce the dispersion property of scatter plots between Rsn and PM2.5, the measured PM2.5 concentration was classified into different bins, starting at 5 μg m−3 with a step length of 5 μg m−3, and the average Rsn was calculated for each bin. Daily average Rsn and PM2.5 concentration from 2005–2010 at Beijing station were used to investigate the quantitative relation between these two variables.
Then, the data from 2011 to 2015 at Beijing station and Rsn and PM2.5 concentration during 2013 and 2014 at Xianghe and Shangdianzi stations were used to evaluate the accuracy of this method.
Additional Information
How to cite this article: Hu, B. et al. Quantification of the impact of aerosol on broadband solar radiation in North China. Sci. Rep. 7, 44851; doi: 10.1038/srep44851 (2017).
Publisher's note: Springer Nature remains neutral with regard to jurisdictional claims in published maps and institutional affiliations.
Supplementary Material
Acknowledgments
This research was funded by the National Natural Science Foundation of China (41305130, 41230642), Beijing Natural Science Foundation (8161004), the Strategic Priority Research Program of the Chinese Academy of Sciences (XDB05020402), Beijing Municipal Science and Technology Project (Z151100002115045), and AERONET. The PIs for the establishment and maintenance of AERONET stations are greatly appreciated.
Footnotes
The authors declare no competing financial interests.
Author Contributions Author contributions: B.H., X.J. and Y.S. designed the research; B.H, X.J. and H.L., performed the research; Z.R., T.S., L.Q., X.A, G.Q., D.S., T.X., L.L., Y. Sun. and J.Y. contributed data for the model simulation and validation; B.H, X.J., H.L., Z.R. and T.S. analyzed data; and B.H., X.J. and H.L. wrote and reviewed the paper.
References
- Zhang Y. & Li Z. Q. Estimation of PM2.5 from finemode aerosol optical depth. J. Remote Sens. 17, 929–943, doi: 10.11834/jrs.20133063 (2013). [DOI] [Google Scholar]
- Kaiser D. P. & Qian Y. Decreasing trends in sunshine duration over China for 1954–1998: Indication of increased haze pollution? Geophys. Res. Lett. 29(21), 2042, doi: 10.1029/2002GL016057 (2002). [DOI] [Google Scholar]
- Qian Y., Wang W., Leung L. R. & Kaiser D. P. Variability of solar radiation under cloud-free skies in China: The role of aerosols. Geophys. Res. Lett. 34, L12804, doi: 10.1029/2006GL028800 (2007). [DOI] [Google Scholar]
- Xia X., Chen H., Li Z., Wang P. & Wang J. Significant reduction of surface solar irradiance induced by aerosols in a suburban region in northeastern China. J. Geophys. Res. 112, D22S02, doi: 10.1029/2006JD007562 (2007). [DOI] [Google Scholar]
- Chang D., Song Y. & Liu B. Visibility trends in six megacities in China 1973–2007. Atmos Res 94, 161–167 (2009). [Google Scholar]
- Wang Y. S. et al. Mechanism for the formation of the January 2013 heavy haze pollution episode over central and eastern China. Science China: Earth Sciences 57, 14–25, doi: 10.1007/s11430-013-4773-4 (2014). [DOI] [Google Scholar]
- Liu Z. R. et al. Seasonal and diurnal variation in particulate matter (PM10 and PM2.5) at an urban site of Beijing: analyses from a 9-year study. Environ. Sci. Pollut. Res. 22, 627–642 (2015). [DOI] [PubMed] [Google Scholar]
- Quan J. et al. Evolution of planetary boundary layer under different weather conditions, and its impact on aerosol concentrations. Particuology 11, 34–40 (2013). [Google Scholar]
- Petäjä T. et al. Enhanced air pollution via aerosol-boundary layer feedback in China. Sci. Rep. 6, 18998, doi: 10.1038/srep18998 (2016). [DOI] [PMC free article] [PubMed] [Google Scholar]
- Chu D. A. et al. Global monitoring of air pollution over land from the Earth Observing System-Terra Moderate Resolution Imaging Spectroradiometer (MODIS). J. Geophys. Res. 108, 4661, doi: 10.1029/2002JD003179 (2003). [DOI] [Google Scholar]
- Wang J. & Christopher S. A. Intercomparison between satellite-derived aerosol optical thickness and PM2.5 mass: Implications for air quality studies. Geophys. Res. Lett. 30, 2095, doi: 10.1029/2003GL018174 (2003). [DOI] [Google Scholar]
- Al-Saadi J. et al. Improving national air quality forecasts with satellite aerosol observations. Bull. Am. Meteorol. Soc. 86(9), 1249–1261 (2005). [Google Scholar]
- Levy R. C., Remer L. A. & Dubovik O. Global aerosol optical properties and application to Moderate Resolution Imaging Spectroradiometer aerosol retrieval over land. J. Geophys. Res. 112, D13210, doi: 10.1029/2006JD007815 (2007). [DOI] [Google Scholar]
- Xia X. Parameterization of clearsky surface irradiance and its implications for estimation of aerosol direct radiative effect and aerosol optical depth. Sci. Rep. 5, 14376, doi: 10.1038/srep14376 (2015). [DOI] [PMC free article] [PubMed] [Google Scholar]
- Li Z. et al. Aerosol physical and chemical properties retrieved from ground-based remote sensing measurements during heavy haze days in Beijing winter. Atmos. Chem. Phys. 13, 10171–10183 (2013). [Google Scholar]
- Tsai T. C., Jeng Y. J., Chu D. A., Chen J. P. & Chang S. C. Analysis of the relationship between MODIS aerosol optical depth and particulate matter from 2006 to 2008. Atmos. Environ. 27, 4777–4788 (2011). [Google Scholar]
- He K. B. et al. The characteristics of PM2.5 in Beijing, China. Atmos. Environ. 35, 4959–4970 (2001). [Google Scholar]
- Yu Sh. C., Eder B., Dennis R., Chu Sh. H. & Schwartz S. New unbiased symmetric metrics for evaluation of air quality models. Atmospheric Science Letter 7, 26–34 (2006). [Google Scholar]
- Kong L., Xin J., Zhang W. & Wang Y. The empirical correlations between PM2.5, PM10 and AOD in the Beijing metropolitan region and the PM2.5, PM10 distributions retrieved by MODIS. Environmental Pollution 216, 350–360 (2016). [DOI] [PubMed] [Google Scholar]
- Song G. et al. Elucidating severe urban haze formation in China. Proc. Natl. Acad. Sci. USA 111, 17373–17378 (2014). [DOI] [PMC free article] [PubMed] [Google Scholar]
- Zhang R. Y. et al. Formation of urban fine particulate matter. Chemical Reviews 115, 3803–3855 (2015). [DOI] [PubMed] [Google Scholar]
- Liang F. & Xia X. Long-term trends in solar radiation and the associated climatic factors over China for 1961–2000. Ann. Geophys 23, 2425–2432 (2005). [Google Scholar]
- Peng J. F. et al. Markedly enhanced absorption and direct radiative forcing of black carbon under polluted urban environments. Proc. Natl. Acad. Sci. USA 113, 4266–4271 (2014). [DOI] [PMC free article] [PubMed] [Google Scholar]
- Yang K., Koike T. & Ye B. Improving estimation of hourly,daily, and monthly solar radiation by importing global data sets. Agric. Forest. Meteorol 137, 43–55 (2006). [Google Scholar]
- Wang K. C. Measurement Biases Explain Discrepancies between the Observed and Simulated Decadal Variability of Surface Incident Solar Radiation. Sci. Rep. 4, 6144, doi: 10.1038/srep06144 (2014). [DOI] [PMC free article] [PubMed] [Google Scholar]
- Hu B., Wang Y. S. & Liu G. R. Variation characteristics of ultraviolet radiation derived from measurement and reconstruction in Beijing, China. Tellus 62B, 100–108 (2010). [Google Scholar]
- Ricchiazzi P. & Gautier C. Investigation of the effect of surface heterogeneity and topography on the radiation environment of Palmer Station, Antarctica, with a hybrid 3-D radiative transfer model. J. Geophys. Res 103(D6), 6161–6176 (1998). [Google Scholar]
Associated Data
This section collects any data citations, data availability statements, or supplementary materials included in this article.


