Abstract
Background:
Recent studies of molecular biology have provided great advances for diagnostic molecular pathology. Automated diagnostic systems with computerized scanning for sampled cells in fluids or smears are now widely utilized. Automated analysis of tissue sections is, however, very difficult because they exhibit a complex mixture of overlapping malignant tumor cells, benign host-derived cells, and extracellular materials. Thus, traditional histological diagnosis is still the most powerful method for diagnosis of diseases.
Methods:
We have developed a novel computer-assisted pathology system for rapid, automated histological analysis of hematoxylin and eosin (H and E)-stained sections. It is a multistage recognition system patterned after methods that human pathologists use for diagnosis but harnessing machine learning and image analysis. The system first analyzes an entire H and E-stained section (tissue) at low resolution to search suspicious areas for cancer and then the selected areas are analyzed at high resolution to confirm the initial suspicion.
Results:
After training the pathology system with gastric tissues samples, we examined its performance using other 1905 gastric tissues. The system's accuracy in detecting malignancies was shown to be almost equal to that of conventional diagnosis by expert pathologists.
Conclusions:
Our novel computerized analysis system provides a support for histological diagnosis, which is useful for screening and quality control. We consider that it could be extended to be applicable to many other carcinomas after learning normal and malignant forms of various tissues. Furthermore, we expect it to contribute to the development of more objective grading systems, immunohistochemical staining systems, and fluorescent-stained image analysis systems.
Keywords: Computerized analysis system, gastric cancer, pathological diagnosis, tissue section
Introduction
Recent advances in image analysis have contributed to the development of automated diagnostic analysis for sampled cells in fluids or smears. Computerized scanning systems such as AutoPap (currently Focalpoint) are now routine.[1,2] AutoPap provides maps (PapMaps) that exhibit good sensitivity in identifying abnormal areas on cervical cytology slides[3] and reduce interpretation time. However, automated analysis of tissue sections is very difficult because they exhibit a complex mixture of overlapping malignant tumor cells, benign host-derived cells, and extracellular materials. In addition, the existence of various histological conditions such as necrosis, hyperplasia, inflammation, structural abnormalities of tissues, and benign tumors may complicate the task. Furthermore, whereas AutoPap is used for a primary screening, histological diagnosis of tissue sections is generally considered to be a definitive diagnosis and requires high accuracy. Except for immunohistochemical analysis using tissue microarrays,[4] automated analysis of histological sections has not been so helpful in clinical practice as compared to traditional pathologist-based evaluation.
In this study, we demonstrate a novel computer-assisted pathology system for the diagnosis of gastric cancer. We evaluate its performance and show that it allows rapid, automated diagnostic screening of hematoxylin and eosin (H and E)-stained tissue sections.
Methods
Tissue Samples
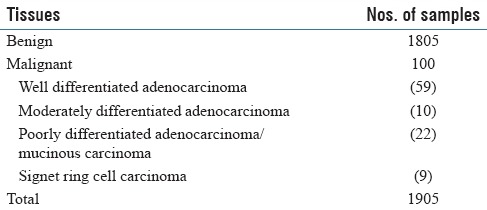
A total of 2005 tissues for training or validation of the system were previously diagnosed by two independent pathologists [Tables 1 and 2]. The H and E section slides were obtained from Kosei Chuo General Hospital.
Table 1.
Summary of tissue samples for training of the system
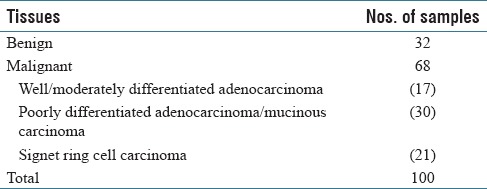
Table 2.
Summary of tissue samples for validation of the system
Digital image acquisition
Because accurate analysis of pathological images demands high resolution and the maximum possible amount of color information, we used the NanoZoomer 2.0-HT (Hamamatsu Photonics K. K., Shizuoka, Japan), with 0.46 µ per pixel and 0.23 µ per pixel for ×20 and ×40 images, respectively.
Regions of interest analysis with info-max algorithm
We have described suspicious areas for cancer as regions of interests (ROIs). The detector (excluding the signet ring cell [SIG] detector) used for ROI detection at ×10 magnification was trained with the Info-Max algorithm.[5] During the training phase, the algorithm selected a feature set that gives the maximum information gain from among a large number of possible features. The feature candidates consisted of color-related and texture-related features; according to color, each pixel was classified into several groups, for example, hematoxylin-stained pixels and eosin-stained pixels. The spatial distributions of such pixels within each subimage were used as color-related feature candidates. Texture-related features were extracted using Gabor functions, which simulate the receptive fields of visual cortical neurons[6] and are widely used for texture analysis. A large number of feature candidates were generated by changing orientation, scale- or position-related parameters, and the algorithm selected the most effective feature set for malignancy detection according to the information-maximization principle.[7] Using the selected features, a detector was automatically generated.[5] We also adopted the “noise method” and “split-and-merge method”[5] to increase the detection accuracy. The system performed a “neighborhood analysis” as a postprocessing to reduce false detections of the detector. For each detected suspicious subwindow, the local density of other detected subwindows was computed, and if the density was too low, the detection was rejected as a false detection. The threshold was determined adaptively according to the normal gland density, which was obtained through a gland structure analysis. For example, if the system detected well-organized gland structure near the subwindow, the threshold was set to a higher value. This was because malignant gastric tissues, especially poorly differentiated adenocarcinoma tissues, show little or no well-organized gland structures within the malignant areas.
Nuclei pleomorphism analysis
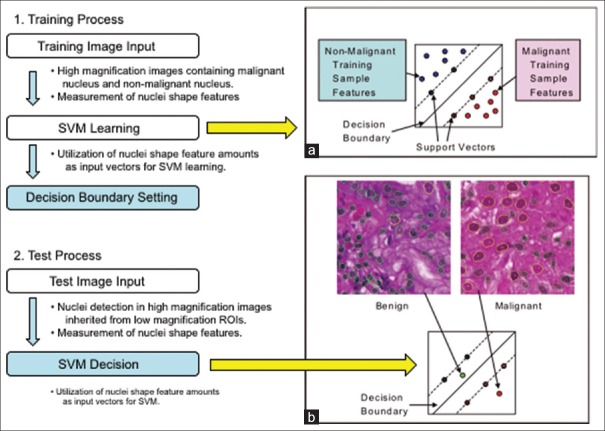
At ×40 magnification, the contour of a nucleus can be safely extracted when it is in sharp focus and not bunched up with other nuclei. Unfortunately, in the majority of cases, there exist nuclei on a ROI which contour cannot be precisely extracted. Hence, an automated analysis algorithm must be able to ignore those difficult nuclei for obtaining meaningful measurement of the nuclear size. In the first step, many candidate contours are extracted using difference of Gaussian filters, Hough transform, and active contour methods. In the second step, features are obtained for each contour, including geometric features (symmetry, smoothness, and concavity) and pixel features (average and variance of hematoxylin, eosin, and white colors). Finally, a support vector machine (SVM) is trained to classify contours (using their corresponding feature vector) as either “good” (i.e., the contour does actually match this of a nucleus) or “bad” (i.e., the contour extraction has failed, and the resulting contour does not exactly match a nucleus). Bad contours are discarded, and the remaining contour sizes are used to compute a statistic over the ROI (we use the 90th percentile of the nuclear area). We trained this SVM using a training set of 10K contours and obtained cross-validation errors lower than 5%. Figure 1 illustrates the training and application of an SVM in the slightly different but related task of discriminating between “benign” and “malignant” nuclei.
Figure 1.
Outlines of training and test processes of the support vector machine algorithm. (a) represents a decision boundary in the feature space constructed from a given training set. (b) represents an example of classification of given test data
Low-resolution signet ring cell detector
Candidate SIGs are detected at ×10 by the following algorithm. Target regions (R1) are masked based on their saturation value (S), where 4% ≤S ≤31%. These values were determined by experiments. Circular regions (R2) are also extracted by means of an edge filter. The R2 regions that overlap with R1 regions in more than 70% of their area are taken as candidate SIGs if they satisfy following conditions: (a) circularity (area-to-circumference ratio) is over 0.9; (b) area is between 367 mm × 367 mm and 734 mm × 734 mm; (c) candidates are not isolated; and (d) candidates are not close to glands (≤27.5 µ). The candidates satisfying those conditions are integrated into ROIs which are examined at × 40 for confirmation.
Signet ring analysis with convolutional neural networks
A Convolutional Neural Network (CNN) is a multilayer neural network that includes a number of so-called convolutional layers. Those layers act as filters on the image directly and are designed to extract low-level features in a manner similar to what the human visual cortex does. We train two separate CNNs to better specialize to detect the two salient characteristics of SIGs. The first CNN finds the vacuole-shaped mucinous part while the second confirms the finding by looking for squashed nuclei at the periphery of the vacuole. The input to the first CNN is done with 200 × 200 RGB pixel patches (color is important) while the input to the second CNN is binary (shape only is important). We labeled a set of such patches using pathologist's guidance. Over 3000 positive SIGs were manually labeled, and an equal number of negative patches were selected automatically. The training of the CNNs consists of presenting alternate positive and negative examples to the input of the CNNs and then to backpropagate the error through the network, thus little by little adjusting its weight.
Results
A pathological diagnosis with the system proceeds by the first analyzing an entire H and E-stained section (tissue) at low resolution (×10, 0.92 µ per pixel), locating suspicious areas for cancer (named ROIs). Then, these ROIs are analyzed at high resolution (×40) to confirm the initial suspicion. Two main analyses are done; one concerns the structural abnormalities, nuclear density, size, and shape alterations that occur in well, moderately, and poorly differentiated adenocarcinomas; the second, more specific to gastric cancer, searches for occurrences of SIGs. All processes of the system are summarized in Figure 2.
Figure 2.
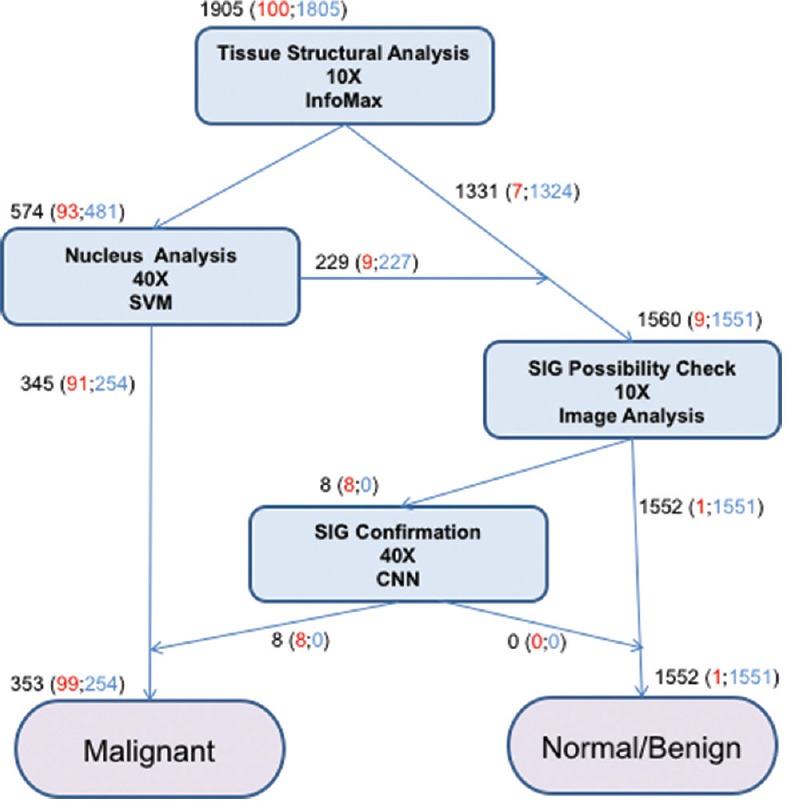
Overview of the flow of gastric cancer detection by the system. Total numbers of the cases judged in each step are described in black. Among them, malignant and benign cases are shown in red and blue, respectively
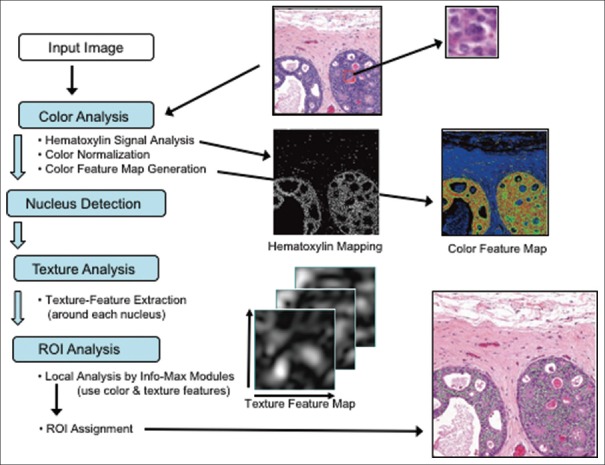
In the first step, a machine-learning algorithm called Info-Max finds suspicious regions (ROIs) for well, moderately, and poorly differentiated adenocarcinomas on a whole H and E-stained section at low magnification (×10). Figure 3 shows the flow of the Info-Max algorithm: first, the computing system detects nuclei within the input image by color analysis, then a subimage around each nucleus is extracted and sent to a detector that determines whether it has malignancy characteristics or not. If the malignancy characteristics are detected, the location of the subwindow within the original image is recorded. Each subimage contains not only the nucleus but also its surrounding components, that is, the detector makes a decision taking into account not only the nucleus-related features but also characteristics of the surrounding regions. The detector by the Info-Max algorithm was trained with about 4000 malignant and normal/benign subimages. The most important step during Info-Max training is a feature selection step that is performed according to the information-maximization principle.[7] The Info-Max method typically selects about 200 features from about 180,000 possible features. Finally, a postprocessing is performed to determine the location of ROIs, taking into account the gland information as well as the detector output (see methods).
Figure 3.
Outline of the processing flow of the Info-Max algorithm. Through color analysis, a hematoxylin map (middle row, left image) is generated and each nucleus is located. A color feature map (middle row, right image) is also computed from color analysis. A subimage (upper right image) is extracted around each nucleus and is tested to detect whether it contains malignancy characteristics. Texture feature maps (lower left image) and color feature maps are used for the decision. Postprocessing is performed to determine regions of interests (indicated in green in the lower right image)
Based on the selection of ROIs by the Info-Max algorithm at low magnification, we extract high magnification images (×40) at these locations. To confirm whether the lesions present in a given ROI are malignant or not, we measure over that ROI statistics of neoplastic nuclei. Using image analysis techniques (methods), several candidate contours are extracted for as many nuclei as possible on that ROI. Then, an SVM classifier[8] is trained to give each contour, a confidence level using several features based on its geometry and the pixels it bounds (see methods). Low confidence contours are discarded, and nuclear area measurements are performed only on the highest confidence ones. Finally, the 90th percentile of the nuclear area on the ROI is calculated, and if it reaches beyond a threshold, the ROI is declared malignant. This threshold is obtained using the training set of labeled tissues.
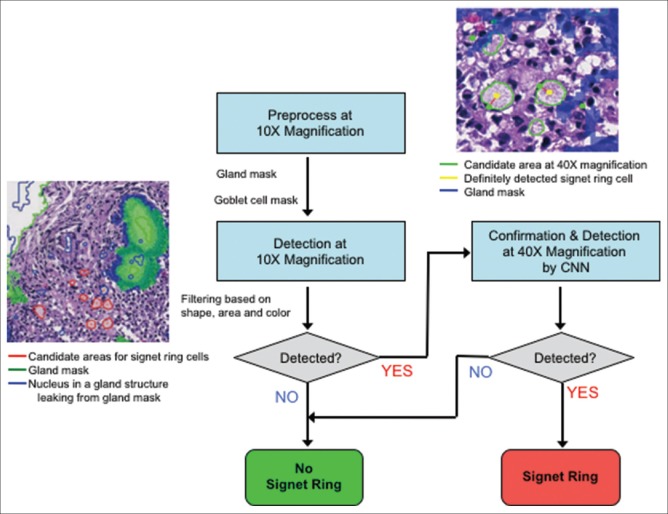
In contrast to well, moderately, and poorly differentiated adenocarcinomas, the important feature in SIG carcinoma is not in the shape of the nucleus but the cytoplasm. Our system thus applies a specific SIG cell detector [Figure 4] when a tissue is not confirmed as cancerous by the analysis described above. SIGs are distinguished by the appearance of squashed nuclei on their periphery. Whereas well, moderately, and poorly differentiated adenocarcinomas exhibit histological phenomena across a large region of tissue, SIGs may occur only at a few dozen sites. Typically, these cells have mucinous cytoplasm and do not form glands or tubules.
Figure 4.
Detection flow for signet ring cells. First, gland areas are detected at ×10 to mask goblet cells. Next, outside of the glands, candidate areas for signet ring cells are detected based on the cytoplasm's color and shape. Finally, the candidates are confirmed at ×40 using two Convolutional Neural Networks, the one focuses on the squashed nuclei, and the other on cytoplasm characteristics
It is sometimes difficult for the system to distinguish between SIGs and goblet cells because both cells have similar features. However, SIGs and goblet cells can be distinguished by analyzing gland structures: goblet cells locate within a gland structure while SIGs locate outside of gland structures. Gland structures can be extracted by an anisotropic edge extraction filter, for example, Gabor–Wavelet filter.[9] Based on the distances between the extracted glands and the candidate areas, the SIG detector decides whether a candidate ROI is suspicious for SIG carcinoma.
Analogous to the pleomorphism confirmation process, the detection of SIGs is confirmed by analysis at high magnification (×40). Because SIGs exhibit a complex pattern, involving both cytoplasm and nuclei, it is harder to find defining features for them (such as size). Thus, we choose to teach the computer to recognize them directly from the image. An ideally suited method is the CNN. Such neural networks are optimized for scanning entire images for patterns, they have been trained to recognize. Thus, we train two CNNs to recognize individual instances of SIGs using a training set of manually selected examples (see methods). The first CNN is trained to recognize squashed nuclei while the second focuses on the cytoplasm. The count of the combined activations over the ROI (with the gland areas returned by the ×10 analysis masked out) is then used to confirm whether the ROI is malignant or benign [Figure 4].
This system is designed and implemented as full automatic system. The operator just needs to set H and E section slides and press the start button on the whole slide imaging scanner NanoZoomer 2.0-HT to execute all processes of the system. The scanner can process up to 210 slides consecutively. The average analysis time is approximately 9 min per one CPU core although it depends on the size of tissue area. The system can analyze multiple slides simultaneously by increasing the number of cores. In our study, we used the system with 10-core processors. The system evaluates the stain variability in H and E sections by values of hue, saturation, and value (HSV) and normalizes the average chromaticities of whole sections to maximum 1.0. When the difference between S and V values is lower than 0.1, the system defines that the H and E staining is too pale. In contrast, when the difference is higher than 0.3, the section is judged to be too dark. Then, these poor images are rejected by the system as insufficient for analysis.
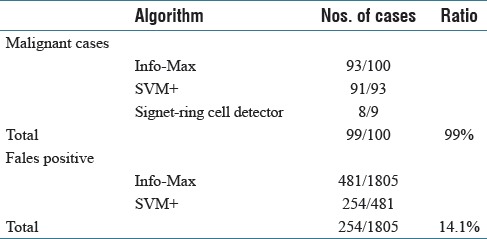
We trained our system using 100 tissues from gastric biopsy sections [Table 1]. Then, we examined its performance using other 1905 gastric tissues [Table 2]. Info-Max detected 93 tissues out of the 100 gastric cancer tissues as suspicious lesion. Moreover, SVM judged 91 tissues out of the 93 tissues as cancer. On the other hand, in the 100 gastric cancer tissues, nine tissues that the flow of Info-Max and SVM did not confirm as cancer were SIG carcinoma, and SIG detector succeeded to detect eight out of the nine tissues containing SIGs. The one case that SIG detector failed to detect was a strongly crushed artifact (data not shown). Incidentally, several samples containing SIG were possible to be detected by accompanied undifferentiated carcinoma cells. As for benign lesion, Info-Max detected 481 out of 1805 benign tissues as malignant. SVM judged that 254 out of the 481 cases were not malignant. In all, the system correctly diagnosed 99 out of the 100 positive samples and 1551 out of the 1805 negative samples. One out of 100 malignant cases was false negative (1.0%), and 254 out of 1805 benign cases were false positives (14.1%). Details are given in Figure 2 and Table 3. There are no borderline lesions, benign tumor (adenoma), and severe inflammatory tissues in the samples. In addition, the H and E-stained tissue sections examined were prepared from a single hospital under similar conditions. Thus, at present, our results do not always guarantee the same level of accuracy to other sample sets from many hospitals. Nevertheless, our results show that the system is at least useful as double check for diagnosis at one pathologist site and/or basic system for companion diagnostics.
Table 3.
Detection ratios of the tissue samples as malignant
Discussion
In our automated system, we proceed from low-resolution detection to high-resolution confirmation, thus closely following the mental process of pathologists. Two types of detectors are used that are constructed to recognize the different (nuclear versus cytoplasmic) characteristics of well, moderately, and poorly differentiated adenocarcinomas and SIG carcinoma.
It is important for such a system to avoid misdiagnosing cancerous tissues (false negatives). In our system, typical false-negative cases (miss detection) were well-differentiated carcinomas with small structural abnormalities without nuclear morphological abnormalities [Figure 5]. In contrast, erosion cases tended to be false positives (overdetection). While on the other hand, false positives (erroneously calling a tissue cancerous while it is not) are less problematic as they can usually be corrected by the pathologist at the later stage (this is the case for quality control or screening). Hence, we bias the classifiers so that the rate of false negatives approaches zero. Even with such strict false-negative range, the system managed to return a 14.1% false-positive rate, showing high potential as a screening system. If the samples are borderline lesions, have only very small problem areas, or contain artifacts from clinical procedures, the diagnoses are often different among the pathologists. In such cases, the system returns the result as malignant.
Figure 5.
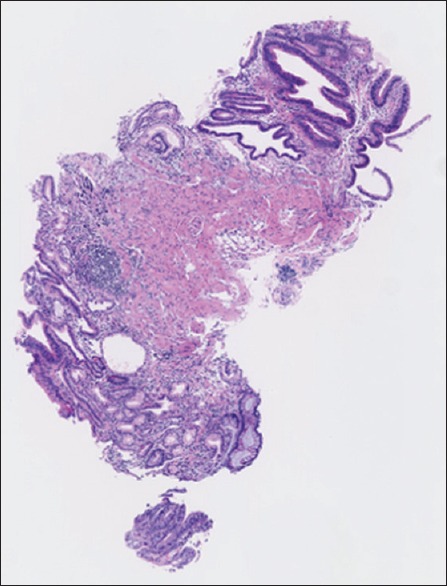
A typical false-negative image of well-differentiated carcinoma with small number of atypical cells
Determining prognosis is essential for cancer treatment, and histological grade is one of the most useful prognostic factors. However, histological grading traditionally has not been completely objective because pathologists differ in their application of grading criteria. In contrast, the system can produce objective histological information. Furthermore, we expect that modification of our system will make it possible to develop a novel histological grading system.
Conclusion
Our novel computerized analysis system allows rapid, automated histological analysis of hematoxylin and eosin (H&E) stained sections, being useful for screening and quality control. Although we used the system for the diagnosis of only gastric cancer in this study, the system has the potential to be applied for many types of carcinoma after learning of normal and malignant forms of various tissues. Furthermore, we expect that the system will contribute to the development of more objective grading systems, immunohistochemical staining systems, and fluorescent-stained image analysis systems.
Financial support and sponsorship
Nil.
Conflicts of interest
There are no conflicts of interest.
Acknowledgments
This study was supported by Grants-in-Aids from the Ministry of Education, Culture, Sports, Science and Technology (MEXT) of Japan, the Ministry of Health, Labor, and Welfare of Japan, Japan Health Sciences Foundation, and Yamaguchi Endocrine Research Association, and the grant of “University-Industry Joint Research Project” for private universities as well as a matching fund subsidy from the MEXT, 2007–2009.
Footnotes
Available FREE in open access from: http://www.jpathinformatics.org/text.asp?2017/8/1/5/201114
References
- 1.Patten SF, Jr, Lee JS, Wilbur DC, Bonfiglio TA, Colgan TJ, Richart RM, et al. The AutoPap 300 QC system multicenter clinical trials for use in quality control rescreening of cervical smears: II. Prospective and archival sensitivity studies. Cancer. 1997;81:343–7. doi: 10.1002/(sici)1097-0142(19971225)81:6<343::aid-cncr8>3.0.co;2-m. [DOI] [PubMed] [Google Scholar]
- 2.Vassilakos P, Carrel S, Petignat P, Boulvain M, Campana A. Use of automated primary screening on liquid-based, thin-layer preparations. Acta Cytol. 2002;46:291–5. doi: 10.1159/000326724. [DOI] [PubMed] [Google Scholar]
- 3.Ronco G, Vineis C, Montanari G, Orlassino R, Parisio F, Arnaud S, et al. Impact of the AutoPap (currently Focalpoint) primary screening system location guide use on interpretation time and diagnosis. Cancer. 2003;99:83–8. doi: 10.1002/cncr.11057. [DOI] [PubMed] [Google Scholar]
- 4.Camp RL, Chung GG, Rimm DL. Automated subcellular localization and quantification of protein expression in tissue microarrays. Nat Med. 2002;8:1323–7. doi: 10.1038/nm791. [DOI] [PubMed] [Google Scholar]
- 5.Imaoka H, Okajima K. An algorithm for the detection of faces on the basis of Gabor features and information maximization. Neural Comput. 2004;16:1163–91. doi: 10.1162/089976604773717577. [DOI] [PubMed] [Google Scholar]
- 6.Heeger DJ. Half-squaring in responses of cat striate cells. Vis Neurosci. 1992;9:427–43. doi: 10.1017/s095252380001124x. [DOI] [PubMed] [Google Scholar]
- 7.Linsker R. Self-organization in a perceptual network. Computer. 1988;21:105–17. [Google Scholar]
- 8.Vapnik V, Chapelle O. Bounds on error expectation for support vector machines. Neural Comput. 2000;12:2013–36. doi: 10.1162/089976600300015042. [DOI] [PubMed] [Google Scholar]
- 9.Daugman JG. Complete discrete 2-D Gabor transforms by neural networks for image analysis and compression. IEEE Trans Acoust. 1988;36:1169–79. [Google Scholar]


