

Abstract
Serotonin 5-HT3 receptors are involved in various brain functions including as an emesis target during cancer chemotherapy. We report here the development of (S)-2,3-dimethoxy-5-(3′-[18F]fluoropropyl)-N-(1-azabicyclo[2.2.2]oct-3-yl)benzamide ([18F]fesetron) as a potential PET imaging agent for serotonin 5-HT3 receptors. By radiolabeling((S)-2,3-dimethoxy-5-(3′-tosyloxypropyl)-N-(1-azabicyclo[2.2.2]oct-3-yl)benzamide) with fluorine-18, (S)-[18F]fesetron was obtained in 5 to 10% decay-corrected yields and with specific activities >74 GBq/μmol at the end of radiosynthesis. PET imaging in rats showed low uptake of [18F]fesetron in the brain with retention of binding in the striatal and cerebellar regions. Using colliculi as a reference region, ratios were 3.4 for striata and 2.5 for cerebellum. Ex vivo brain PET analysis displayed binding of [18F]fesetron in the hippocampus, striatum and cerebellar regions. Cerebellar regions corresponded to area postrema and nucleus tract solitaris known to contain 5-HT3 receptors. Dorsal hippocampus showed the highest uptake with ratio of >17 with respect to colliculi, while area postrema and striata had ratios of >10. Thus, [18F]fesetron exhibited a unique binding profile to rat brain regions known to contain significant amounts of serotonin 5-HT3 receptors. However, the very low brain uptake limits its usefulness as a PET radiotracer in this animal model.
Keywords: Fesetron, Serotonin 5-HT3 receptors, PET, Autoradiography, Palonosetron, Zacopride, Cancer chemotherapy
The serotonin 5-HT3 receptor is a ligand-gated cation channel belonging to the nicotine/gamma-aminobutyrate (GABA) receptor super-family.1 The 5-HT3 receptors are found in the brain mainly in presynaptic regions associated with axons and nerve terminals (70–80%). In the hippocampus, they are predominately postsynaptic receptors located on somatodendritic regions.2 They have been found at many central nervous system (CNS) locations and mostly on GABAergic neurons. The 5-HT3 receptor is involved with pain processing, integration of the vomiting reflex (emesis), sensory transmission, the reward system, often associated with dopaminergic pathways, anxiety control and gastrointestinal disorders.3,4 Therapeutically, antagonists have shown the most promise in chemotherapy induced nausea and vomiting (CINV). The 5-HT3 receptor has also been investigated for its potential use in treating drug addiction.4 Subtypes of 5-HT3 receptor have been reported: 5-HT3A, 5-HT3B, 5-HT3C, 5-HT3D, and 5-HT3E of which the 5-HT3A subtype has been reported across species.1,4
Several ligands with high affinity and selectivity for the 5-HT3 receptor, including zacopride have been reported (Fig. 1).5 Zacopride is a 3-aminoquinuclidinyl derivative exhibiting antiemetic effects which were found to be greater for its (S)-isomer.6–8 In order to study the distribution of these receptors, [3H]zacopride,9 related radioiodinated derivatives, [125I]DAIZAC10 and [125I] MIZAC11 and other compounds without the 3-aminoquinuclidinyl moiety as in [3H]GR6563012 have been synthesized (Fig. 1). Although in vitro studies have been reported with these radioligands, no in vivo studies are available.10 Additionally, positron emission tomography (PET) imaging agents with high affinity such as [18F]MR1844513 and [11C]MDL7222214 were not successful in vivo for selective binding to 5-HT3 receptors.
Figure 1.
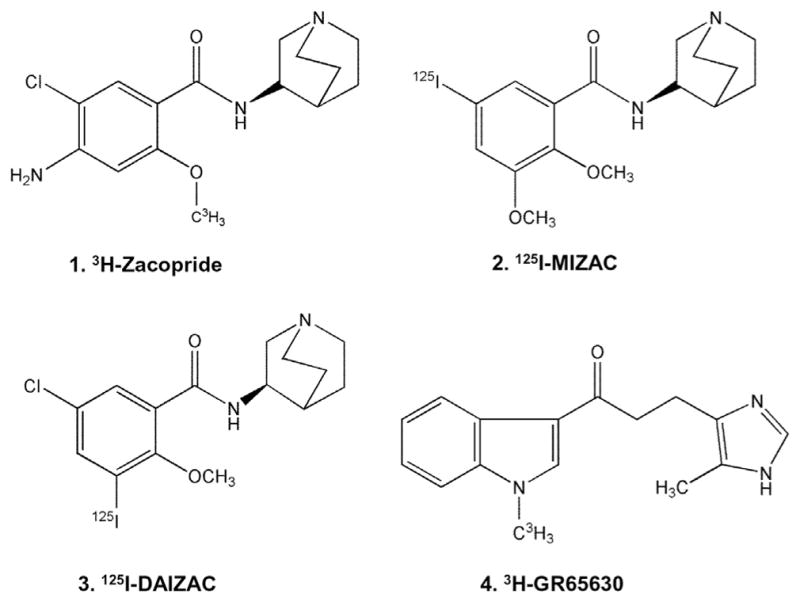
Chemical structures of 5-HT3 radioligands: four radiolabeled derivatives with subnanomolar affinities for the 5-HT3 receptor used for in vitro studies. 3-Aminoquinuclidine derivatives 1. [3H]Zacopride, 2. [125I]MIZAC, and 3. [125I]DAIZAC. Derivative without 3-aminoquinuclidine ring, 4. [3H]GR65630.
The ‘setron’ drugs (defined as selective serotonin 5-HT3 receptor antagonists) were first used because of their effects on CINV due to high affinity for the 5-HT3 receptor (Fig. 2). They belong to the same substance class because of their binding to the orthosteric ligand binding site on the receptor protein.15 Although only granisetron and palonosetron are selective to the 5-HT3 receptor,16,17 all the setron drugs are equally capable of inhibiting Ca2+ influx.4 Palonosetron, being the ‘newer’ setron drug, seems to show a longer plasma half-life and a higher affinity to 5-HT3 receptors when compared to the other setron drugs.16,18 Also, palonosetron has shown to be effective not only in treating acute CINV but also delayed CINV.18 Because of its apparent advantages, we took an interest in palonosetron and looked closely at its chemical structure. Like zacopride analogs, palonosetron also contains the 3-aminoquinuclidinyl moiety (Fig. 2).
Figure 2.

Chemical structures of 5-HT3 ligands: the ‘setron’ drugs used as antiemetic agents: 5. Ondansetron, 6. Granisetron, and 7. Palonosetron. Palonosetron contains the 3-aminoquinuclidine ring structure (blue dashed box in 7). Based on the structures of MIZAC and Palonosetron, Fesetron 8 was developed as a potential PET radiotracer for 5-HT3 receptors and is reported in this Letter.
Using the fluoropropyl group as a bioisostere for the iodine atom in MIZAC, we synthesized (S)-2,3-dimethoxy-5-(3′-fluoropropyl)-N-(1-azabicyclo[2.2.2]oct-3-yl)benzamide (fesetron), as a potential PET radioligand for the 5-HT3 receptor when labeled with fluorine-18. The wide array of structural features in the setron drugs developed for the 5-HT3 receptors suggested reasonable bulk tolerance on the aromatic ring and with the (S)-isomer having greater pharmacological activity.15,19 Due to the lack of in vivo imaging findings of the various radioligands for the 5-HT3 receptor, perhaps due to low blood brain barrier (BBB) permeability, our primary goal in this work was to evaluate the BBB permeability of the 3-aminoquinuclidinyl derivative, [18F]fesetron. Thus, here we report radiosynthesis of [18F]fesetron and preliminary in vivo PET studies in rats.
Synthesis of fesetron was carried out by coupling (S)-3-aminoquinuclidinylamine 10 with 2,3-dimethoxy-5-(3′-hydroxypropyl) benzoic acid 9 as shown in Figure 3.20 This reaction proceeded smoothly in modest yields. Tosylation of alcohol 11 afforded the tosylate precursor 12 in 50% yield which served to incorporate the unlabeled fluorine in order to prepare fesetron 8 as well as fluorine-18 for preparing [18F]fesetron 13. Nucleophilic displacement of the tosylate 12 with tetrabutylammonium fluoride afforded fesetron 8 in sufficient yields for biological studies.
Figure 3.

Synthesis of fesetron 8 and [18F]fesetron 13. Step A: coupling of carboxylic acid 9 with amine 10 to provide the substituted amide 11 (BOP: benzotriazol-1-yloxy-tris (dimethylamino) phosphonium hexafluorophosphate; Et3N: triethylamine; CH3CN: acetonitrile). Step B: tosylation of alcohol 11 to the tosylate 12 (TsCl: p-toluenesulfonyl chloride; CH2Cl2: dichloromethane). Step C: nucleophilic displacement of tosylate with fluoride to provide fesetron 8 (Bu4NF: tetrabutylammonium fluoride; THF: tetrahydrofuran). Step D: radiolabeling of tosylate 12 with K[18F]Kryptofix in CH3CN to provide [18F]fesetron which was purified by HPLC.
The radiosynthesis of [18F]fesetron 13 required a single chemical step by incorporation of the fluorine-18 by radiolabeling the fesetron tosylate 12 and proceeded efficiently with [18F]fluoride-Kryptofix-K2CO3 in CH3CN at 96 °C for 30 min.21 [18F]Fesetron was purified and isolated by reverse-phase HPLC in modest yields (5–10% decay corrected) in specific activities of >74 GBq/μmol at the end of radiosynthesis.
Brain uptake of [18F]fesetron in the rat was low (Fig. 4).22 Retention of activity was identified in the striatal region and the cerebellar region both of which exhibited a maximal uptake of approximately 0.12% injected dose/cc (Fig. 4A). This uptake of [18F]fesetron is approximately 10 times lower than the uptake of other non-quinuclidinyl substituted benzamides in the rat.24 Because of the low activity in vivo other brain regions were difficult to visualize and colliculi region with lower activity was used as a reference region. The coregistered PET/CT image confirmed cranial uptake and uptake in muscles. Uptake of [18F]fesetron in the brain reached initial values of up to 30 kBq/cc in the striata and the cerebellar region which gradually went down to approximately 10 kBq/cc in 2 h (Fig. 4D). Activity levels in the skull bone (Fig. 4A and B) initially went up to >80 kBq/cc and went down to approximately 50 kBq/cc in about an hour before rising back to approximately 80 kBq/cc. The initial rapid uptake in the skull suggests delivery of the radiotracer and possibly some defluorination with [18F]fluoride accumulation in the bone. The subsequent gradual increase in the skull indicates defluorination over the course of the scan. Blood brain barrier (BBB) permeability of [18F]fesetron appears to be low either due to its low lipophilicity (logP of [18F]fesetron was measured to be <0.5, using the shake-flask method). At 115 min post-injection of [18F]fesetron, striata to colliculi ratio was 3.4, and the cerebellar region to colliculi was 2.5 thus suggesting retention of [18F]fesetron in these regions. Pre-injection of zacopride (1 mg/kg, iv) reduced dramatically (>80%) the uptake of [18F]fesetron in these brain regions (see inset in Fig. 4C).
Figure 4.

In vivo rat [18F]fesetron PET/CT. (A) A summed PET image (2 h) after intravenous administration of 22 MBq of [18F]fesetron (containing ~0.10 μg of unlabeled fesetron) under anesthesia. Very low brain uptake was observed. Uptake was observed in hippocampal regions, striatal regions and cerebellar nuclei. (B) Corresponding PET/CT image showing presence of some radioactivity in the skull. (C) Inset showing summed PET and PET/CT image of 32 MBq of [18F]fesetron (containing ~0.15 μg of unlabeled fesetron) with pre-injection of zacopride (−30 min, 1 mg/kg). Little uptake of [18F]fesetron in the brain was observed. (D) Time activity curve of striata, cerebellar region, colliculi and skull. Rapid uptake was seen in the various regions, with slower clearance from striata and cerebellar regions compared to colliculi. Skull activity increased marginally suggesting little defluorination. Striata/colliculi = 3.4 and cerebellar region/colliculi = 2.5 at 120 min post-injection.
In order to better visualize the whole brain without the interference from the skull activity, the brains of rats were excised after two-hour [18F]fesetron PET study.25 Figure 5 shows axial and coronal brain slices along with the CT scans from the ex vivo PET/CT scan of the isolated whole brain. The striatum and cerebellar regions exhibited significant binding (Fig. 5A), consistent with the in vivo PET study. But in addition hippocampal regions were clearly seen in both the axial and coronal sections (Fig. 5A and C). In the in vivo scan, it was difficult to clearly highlight the hippocampus due to the adjacent skull activity which we have pointed out for other radiotracers.26 Figure 5E shows highest uptake of [18F]fesetron in the hippocampus followed by cerebellar regions and striatum. With respect to the background (taken around the colliculi), the ratio of hippocampus and cerebellar regions were >23 while that of striata was approximately 19 (Fig. 5E).
Figure 5.

Ex vivo MicroPET images of whole rat brain after 2 h of in vivo scan (from Fig. 4). Ex vivo PET images ((A) axial; (C) coronal) with corresponding CT slices (B and D) of the excised brain of the same rat showing binding of [18F]fesetron in various brain regions (striatum (ST), hippocampus (HP) and cerebellar nuclei (CB). (E) Plot shows uptake in the various regions; Bkd = background region near the colliculi. Ratios of HP, CB and ST with respect to Bkd were 23.6, 22.9 and 19.6, respectively.
Subsequent to the ex vivo brain MicroPET scan, an autoradiographic study was carried out.27 Figure 6 shows ex vivo sagittal brain sections with localization of [18F]fesetron in the hippocampus (DHP and VHP), in the striatum (ST) and cerebellar regions which may correspond to AP and NTS. Dorsal hippocampus showed the highest uptake with ratio of >17 with respect to colliculi while VHP had lower ratios <10. Area postrema and striata exhibited ratios of >10. Both area postrema and nucleus tract solitaris have been shown to be enriched in 5-HT3 receptors.28 The CINV drugs are known to mediate their effects by acting on this region in the brain and brain stem.1,29 Further confirmation of this brain region will have to be carried out.
Figure 6.

Male Sprague–Dawley rat was injected with 37 MBq of [18F]fesetron and sacrificed 2.5 h after administration (A and C are scans of brain slices and B and D are the autoradiographs): Sagittal sections, 40 micron thick, showing binding in hippocampus, dorsal (DHP) and ventral (VHP), striatal (ST) region, area postrema (AP), nucleus tract solitaris (NTS) and low binding in cortex. (E) Plot shows binding of [18F]fesetron from the autoradiographs (B and D). Using colliculi (Col) as reference region, ratios, shown in red bars were: Striatum/Col = 13.2; DHP/Col = 17.2; VHP/Col = 9.42; AP-NTS/Col = 11.4.
Using [125I]DAIZAC, 5-HT3 receptors were highly concentrated in the entorhinal cortex, hippocampus, frontal cortex and medulla.10 Similar findings have been reported with [125I]MIZAC which exhibited greater binding around the temporal cortex, hippocampus, frontal cortex, and the medulla.11 Our results on the binding of [18F]fesetron in the hippocampus and cerebellum/brain stem regions (AP and NTS) are consistent with the findings of 5-HT3 receptors. The structural similarity of these 3-aminoquinuclidinyl derivatives thus appears to manifest in their binding profiles (Figs. 1 and 2). When using [3H]GR65630 (Fig. 1), which has a different structure than the aforementioned antagonists, the highest concentration of the 5-HT3 in the postmortem human brain was found to be in area postrema and striatum (13.1 and 4.8 fmol/mg protein, respectively).12 This is consistent with the regional distribution using [18F]fesetron in the rat brain.
Information on the in vivo characteristics of the various 5-HT3 radioligands has been lacking. This is due to low brain uptake, low selectivity and the low density of 5-HT3 receptors in the brain regions.2 Increasing the lipophilicity by decreasing the basicity of the amine in [18F]fesetron and related analogs may be necessary in order to increase its brain permeability which will assist in the in vivo characterization of binding in the brain and its regional selectivity. However, it should be noted that therapeutic success of the ‘setron’ drugs comes from action on the area postrema and nucleus tract solitaris which is located outside the BBB.30 Thus, a similar pharmacological blocking effect of zacopride on cisplatin-induced emesis with zacopride administered intravenous or intra-cerebroventricular (i.c.v) routes has been observed.6 Also noteworthy is the recent report of micromolar affinity of zacopride for mammalian α7 nicotinic acetylcholine receptor.31
In summary, [18F]fesetron was prepared in modest radiochemical yields and high specific activity. In vivo brain uptake of [18F]fesetron was low and an extensive amount of activity was unable to cross the blood brain barrier. The small amount of activity detected in the brain suggested preferred retention in regions containing the 5-HT3 receptors. However, the very low rat brain uptake in the rat brain limits the usefulness of [18F]fesetron as a PET radiotracer in this animal model. Future studies on PET radiotracer development for 5-HT3 receptors will need to first address the brain permeability issues.
Acknowledgments
This research was financially supported by a grant from R01 AG029479 (J.M.) and R21 DA038866. We like to thank Drs. Evegueni Sevrioukov and Cristian Constantinescu for technical assistance.
References and notes
- 1.Barnes NM, Hales TG, Lummis SC, Peters JA. Neuropharmacology. 2009;56:273. doi: 10.1016/j.neuropharm.2008.08.003. [DOI] [PMC free article] [PubMed] [Google Scholar]
- 2.Miquel MC, Emerit MB, Nosjean A, Simon A, Rumajogee P, Brisorgueil MJ, Doucet E, Hamon M, Verge D. Eur J Neurosci. 2002;15:449. doi: 10.1046/j.0953-816x.2001.01872.x. [DOI] [PubMed] [Google Scholar]
- 3.Faerber L, Drechsler S, Ladenburger S, Gschaidmeier H, Fischer W. Eur J Pharmacol. 2007;560:1. doi: 10.1016/j.ejphar.2007.01.028. [DOI] [PubMed] [Google Scholar]
- 4.Walstab J, Rappold G, Niesler B. Pharmacol Ther. 2010;128:146. doi: 10.1016/j.pharmthera.2010.07.001. [DOI] [PubMed] [Google Scholar]
- 5.Smith WW, Sancilio LF, Owera-Atepo JB, Naylor RJ, Lambert L. J Pharm Pharmacol. 1988;40:301. doi: 10.1111/j.2042-7158.1988.tb05253.x. [DOI] [PubMed] [Google Scholar]
- 6.Smith WL, Callaham EM, Alphin RS. J Pharm Pharmacol. 1988;40:142. doi: 10.1111/j.2042-7158.1988.tb05202.x. [DOI] [PubMed] [Google Scholar]
- 7.Pinkus LM, Sarbin NS, Gordon JC, Munson HR., Jr Eur J Pharmacol. 1990;179:231. doi: 10.1016/0014-2999(90)90425-6. [DOI] [PubMed] [Google Scholar]
- 8.Sancilio LF, Pinkus LM, Jackson CB, Munson HR., Jr Eur J Pharmacol. 1991;192:365. doi: 10.1016/0014-2999(91)90226-g. [DOI] [PubMed] [Google Scholar]
- 9.Barnes NM, Costall B, Naylor RJ. J Pharm Pharmacol. 1988;40:548. doi: 10.1111/j.2042-7158.1988.tb05300.x. [DOI] [PubMed] [Google Scholar]
- 10.Hewlett WA, Trivedi BL, Zhang ZJ, de Paulis T, Schmidt DE, Lovinger DM, Ansari MS, Ebert MH. Pharmacol Exp Ther. 1999;288:221. [PubMed] [Google Scholar]
- 11.Hewlett WA, Fridman S, Trivedi BL, Schmidt DE, De Paulis T, Ebert MH. Prog Neuro-Psychopharmacol Biol Psychiatry. 1998;22:397. doi: 10.1016/s0278-5846(98)00012-8. [DOI] [PubMed] [Google Scholar]
- 12.Marazziti D, Betti L, Giannaccini G, Rossi A, Masala I, Baroni S, Cassano GB, Lucacchini A. Neurochem Res. 2001;26:187. doi: 10.1023/a:1010939530412. [DOI] [PubMed] [Google Scholar]
- 13.Katounina T, Besret L, Dhilly M, Petit-Taboue MC, Barbelivien A, Baron JC, Dauphin F, Barre L. Bioorg Med Chem. 1998;6:789. doi: 10.1016/s0968-0896(98)00035-2. [DOI] [PubMed] [Google Scholar]
- 14.Barre L, Debruyne D, Lasne MC, Gourand F, Bonvento G, Camsonne R, Moulin M, Baron JC. Int J Radiat Appl Instrum A. 1992;43:509. doi: 10.1016/0883-2889(92)90133-y. [DOI] [PubMed] [Google Scholar]
- 15.Thompson AJ, Lummis ACR. Curr Pharm Des. 2006;12:3615. doi: 10.2174/138161206778522029. [DOI] [PMC free article] [PubMed] [Google Scholar]
- 16.Wong EH, Clark R, Loury D, Bonhaus DW, Jakeman L, Parnes H, Whiting RL, Eglen RM. Br J Pharmacol. 1995;114:851. doi: 10.1111/j.1476-5381.1995.tb13282.x. [DOI] [PMC free article] [PubMed] [Google Scholar]
- 17.Aapro M. Oncologist. 2004;9:673. doi: 10.1634/theoncologist.9-6-673. [DOI] [PubMed] [Google Scholar]
- 18.Aapro M. Oncology. 2005;69:97. doi: 10.1159/000087979. [DOI] [PubMed] [Google Scholar]
- 19.Young R, Johnson DN. Eur J Pharmacol. 1991;201:151. doi: 10.1016/0014-2999(91)90338-q. [DOI] [PubMed] [Google Scholar]
- 20.All chemicals and solvents were of analytical or HPLC grade from Aldrich Chemical Co. and Fisher Scientific. Electrospray mass spectra were obtained on a Model 7250 mass spectrometer (Micromass LCT). Proton NMR spectra were recorded on a Bruker OMEGA 500 MHz spectrometer. Analytical thin layer chromatography (TLC) was carried out on silica coated plates (Baker-Flex, Phillipsburg, NJ). Chromatographic separations were carried out on preparative TLC (silica gel GF 20 × 20 cm 2000 micron thick; Alltech Assoc. Inc., Deerfield, IL) or silica gel flash column or semi-preparative reverse-phase columns using the Gilson high performance liquid chromatography (HPLC) systems. (S)-2,3-dimethoxy-5-(3′-hydroxypropyl)-N-(1-azabicyclo[2.2.2]oct-3-yl)benzamide 11: In order to synthesize fesetron the reaction scheme described in Figure 3 was followed. 2,3-Dimethoxy-5-(3′-hydroxypropyl)benzoic acid 9 (0.24 g; 1 mmol) and (S)-3-aminoquinuclidine 10 (0.2 g, 1 mmol; dihydrochloride neutralized with aq 1 N NaOH prior to use) were dissolved in anhydrous acetonitrile (5 mL). To this was added triethylamine (0.4 mL) and subsequently benzotriazol-1-yloxy-tris(dimethylamino)phosphonium hexafluorophosphate (BOP; 0.44 g, 1 mmol) was added and the reaction was stirred overnight. Solvents were removed in vacuo and the residue was taken up in dichloromethane and washed with water and saturated aq NaHCO3. The organic portions were pooled together, dried (MgSO4), filtered, evaporated, and purified by preparative TLC (silica gel; CH2Cl2:MeOH, 9:1; Rf = 0.27 on analytical TLC plates) to yield 11 (105 mg) as a yellow oil. NMR (CDCl3, 500 MHz) δ ppm: 1H NMR δ 8.50 (br, 1H), 7.90 (s, 1H), 6.60 (d, 1H, J = 2 Hz), 4.32 (t, 2H, J = 6 Hz), 3.90 (s, 6H), 3.50–0.81 (m, 18H). Mass spectra (m/z, %), 349 ([M+H]+, 100%). (S)-2,3-dimethoxy-5-(3′-tosyloxypropyl)-N-(1-azabicyclo[2.2.2]oct-3-yl) benzamide 12: The alcohol 11 (70 mg, 0.2 mmol) in CH2C12 (4 mL) was treated with triethylamine (40 μL) and p-toluenesulfonyl chloride (46 mg, 0.24 mmol). The reaction vessel was stirred at room temperature for 18–20 h. The reaction mixture was washed with saturated aq NaHCO3 and water. The pooled organic layers were dried (MgSO4), filtered, concentrated, and purified by preparative TLC (silica gel; CH2Cl2:MeOH, 9:1; Rf = 0.42 on analytical TLC plates) to yield 12 (50 mg; 50% yield) as a colorless oil. NMR (CDCl3, 500 MHz) δ ppm: 1H NMR δ 8.50 (br, 1H), 7.80 (d, 2H, J = 2 Hz, tosyl), 7.30 (d, 2H, J = 2 Hz, tosyl), 7.10 (s, 1H), 6.77 (s, 1H), 4.30 (br, 2H), 3.79 (s, 3H, OCH3), 3.77 (s, 3H, OCH3), 3.30 (s, 3H, CH3), 3.30–0.80 (m, 18H). Mass spectra (m/z, %): 503 ([M+H]+, 90%). (S)-2,3-dimethoxy-5-(3′-fluoropropyl)-N-(1-azabicyclo[2.2.2]oct-3-yl)benzamide 8: The tosylate 12 (25 mg, 0.05 mmol) was dissolved in THF (1 mL). The solution was treated with tetrabutylammonium fluoride (TBAF), 1.0 M solution in THF (1.5 mL) and heated at 60 °C for 2 h and subsequently cooled. The reaction mixture was concentrated to dryness in vacuo and the residue was then purified by preparative TLC (silica gel; CH2Cl2:MeOH, 9:1; Rf = 0.37 on analytical TLC plates) providing 8 (Fesetron, 10 mg, 57% yield) as a colorless oil. NMR (CDCl3, 500 MHz) δ ppm: 1H NMR δ 8.40 (br, 1H), 7.40 (s, 1H), 6.74 (s, 1H), 4.34–4.43 (dt, 2H, CH2F; JHF = 46 Hz, J2,3 = 15 Hz), 3.78 (s, 3H, OCH3), 3.76 (s, 3H, OCH3), 3.65–1.25 (m, 18H). Mass spectra (m/z, %): 351 (100%, [M+H]+).
- 21.High specific activity [18F]fluoride was produced using a MC-17 cyclotron and oxygen-18 enriched water. The high specific activity [18F]fluoride was used in subsequent reactions which were carried out using an automated radiosynthesis units (chemistry processing control unit (CPCU)). Fluorine-18 radioactivity was counted in a Capintec CRC-15R dose calibrator while low level counting was carried out in a Capintec Caprac-R well-counter. Radioactive thin layer chromatograms were obtained by scanning in a Bioscan system 200 Imaging scanner (Bioscan, Inc., Washington, DC). The radiosynthesis of [18F]fesetron was conducted in the chemistry process control unit (CPCU). Hydrogen [18F]fluoride in H218O from the MC-17 cyclotron was passed through a light QMA sep-pak (Waters Corp.), preconditioned with 3 mL of aq K2CO3, 140 mg/mL, followed by 3 mL of anhydrous acetonitrile. The trapped [18F]fluoride in QMA was eluted with 1 mL of Kryptofix 2.2.2 (Aldrich)/aq K2CO3 solution (stock solution of 360 mg Kryptofix and 75 mg K2CO3 in 24 mL acetonitrile and 1 mL water) and transferred to the reaction vessel in the CPCU. The SYNTH1 program was used for the synthesis that involved an initial drying step of the [18F]fluoride, Kryptofix 2.2.2., and K2CO3 mixture at 120 °C for 10 min. The [18F] solution was further dried with acetonitrile (2 mL) at 120 °C for 7 min. Dried [18F] reaction mixture was treated with the tosylate precursor 12 (1 mg) in acetonitrile (0.5 mL). This solution was heated at 96 °C for 30 min and cooled. The crude product was transferred out of CPCU using methanol (5 mL). The methanol containing [18F]fesetron was evaporated in vacuo. Semipreparative HPLC purification was performed using an Alltech C18 column (10 μm, 250 × 10 mm) and UV detector (254 nm), mobile phase: 40% acetonitrile–60% 0.1 M NH4HCO2, flow rate 2.5 mL/min, r.t. = 8.5 min. [18F] Fesetron 13 was made in modest yields (5–10% decay corrected) in specific activities of 74 GBq/μmol (Fig. 3). The collected fraction was taken to near dryness in vacuo. The final formulation was carried out using approx. 5 mL of saline (0.9% NaCl INJ) followed by filtration through a membrane filter (0.22 μm) into a sterile dose vial.
- 22.All animal studies were approved by the Institutional Animal Care and Use Committee of University of California-Irvine. A preclinical Inveon dedicated PET scanner (Siemens Medical Solutions, Knoxville, TN) with a transaxial FWHM of 1.46 mm, and axial FWHM of 1.15 mm was used for the PET studies.23 Both in vivo and ex vivo PET images of rat brains were obtained and analyzed using ASIPro VM software. Male Sprague-Dawley normal rats (n = 4; 300–600 g) were fasted 24 h prior to time of scan. On the day of the study, rats were anesthetized using 4.0% isoflurane. The rat was then positioned on the scanner bed by placing it on a warm-water circulating heating pad and anesthesia applied using a nose-cone. Preparation of dose injection was as follows: 22–37 MBq of [18F]fesetron was drawn into a 1 mL syringe with a 25 gauge needle and diluted with sterile saline to a final volume of 0.3 mL. The dose, containing approximately 0.10–0.20 μg of fesetron, was injected intravenously into the tail vein of the rat. Isoflurane was reduced and maintained at 2.5% following injection. Scans were carried out for 120 min and acquired by the Inveon MicroPET in full list mode. List mode data was collected dynamically which were rebinned using a Fourier Rebinning algorithm. The images were reconstructed using Fourier rebinning and 2-dimensional filtered back-projection (2D FBP) method (ramp filter and cutoff at Nyquist frequency) with an image matrix of 128 × 128 × 159, resulting in a pixel size of 0.77 mm and a slice thickness of 0.796 mm. Calibration was conducted to Bq/cc units using a Germanium-68 phantom which was scanned in the Inveon MicroPET and reconstructed under the same parameters as the subjects. Analyses of all data were carried out using Acquisition Sinogram Image Processing IDL’s virtual machine (ASIPRO VM) and Inveon Research Workplace (IRW). Volume-of-interest (VOI) were drawn on the summed PET image on different brain regions (striatum, cerebellum, colliculi) and skull to obtain extent of radiotracer binding in kBq/cc. Since colliculi exhibited the least amount of binding and was lower than the cerebellar regions, it was used as the reference region. Ratios were calculated for the various brain regions with respect to colliculi. In order to evaluate the effect of zacopride on the binding of [18F]fesetron, rats (n = 2) were injected intravenously with the serotonin 5-HT3 receptor ligand, zacopride (1 mg/kg, dissolved in 10% ethanolic sterile saline) 30 min prior to [18F] fesetron.
- 23.Constantinescu C, Mukherjee J. Phys Med Biol. 2009;54:2885. doi: 10.1088/0031-9155/54/9/020. [DOI] [PMC free article] [PubMed] [Google Scholar]
- 24.Constantinescu C, Coleman R, Pan ML, Mukherjee J. Synapse. 2011;65:778. doi: 10.1002/syn.20904. [DOI] [PMC free article] [PubMed] [Google Scholar]
- 25.After completion of the in vivo MicroPET scans, rats were sacrificed and the brain was extracted for ex vivo MicroPET imaging. The whole brain was placed in a hexagonal polystyrene weighing boat (top edge side length 4.5 cm, bottom edge side length 3 cm) and covered with powdered dry ice. This boat was placed securely on the scanner bed and a transmission scan acquired. Subsequently a 60 min emission scan was acquired by the Inveon MicroPET scanner in full list mode. List mode was collected in a single frame and reconstruction of images was similar to the procedure previously described. Images were analyzed using ASIPRO VM software. VOI’s were drawn on the PET image on different brain regions (striatum, cerebellum, hippocampus, colliculi) to obtain extent of radiotracer binding in kBq/cc. Ratios were calculated for the various brain regions with respect to colliculi.
- 26.Saigal N, Bajwa A, Faheem SS, Coleman R, Pandey S, Constantinescu CC, Fong V, Mukherjee J. Synapse. 2013;67:596. doi: 10.1002/syn.21665. [DOI] [PMC free article] [PubMed] [Google Scholar]
- 27.Ex vivo rat brain slices were prepared at 40 μm thick using a Leica 1850 cryotome. Fluorine-18 autoradiographic studies were carried out by exposing tissue samples on storage phosphor screens (Perkin Elmer Multisensitive, Medium MS). The apposed phosphor screens were read and analyzed by OptiQuant acquisition and analysis program of the Cyclone Storage Phosphor System (Packard Instruments Co., Boston, MA). The brain after the ex vivo MicroPET imaging experiment was removed from the dry ice and rapidly prepared for sectioning. Horizontal sections (40 μm thick) were cut using a Leica CM1850 cryotome, containing brain regions of the striatum, thalamus, hippocampus, cortex, cerebellum and other regions. The sections were air dried and exposed to phosphor films overnight. Films were read using the Cyclone Phosphor Imaging System. Region-of-interest of same size were drawn and analyzed on brain regions using OptiQuant software and binding of [18F] fesetron measured in Digital Light Units/mm2 (DLU/mm2). Ratios of DLU/mm2 in the striatum, area postrema (AP), nucleus tract solitaris (NTS), hippocampus (dorsal, DHP and ventral, VHP), were calculated for the various brain regions with respect to colliculi.
- 28.Parker RM, Barnes JM, Ge J, Barber PC, Barnes NM. J Neurol Sci. 1996;144:119. doi: 10.1016/s0022-510x(96)00211-0. [DOI] [PubMed] [Google Scholar]
- 29.Schwartzberg L, Barbour SY, Morrow GR, Ballinari G, Thorn MD, Cox D. Support Care Cancer. 2014;22:469. doi: 10.1007/s00520-013-1999-9. [DOI] [PMC free article] [PubMed] [Google Scholar]
- 30.Miller AD, Leslie RA. Front Neuroendocrinol. 1994;15:301. doi: 10.1006/frne.1994.1012. [DOI] [PubMed] [Google Scholar]
- 31.Bourdin CM, Lebreton J, Mathe-Allainmat M, Thany SK. Bioorg Med Chem Lett. 2015;25:3184. doi: 10.1016/j.bmcl.2015.05.094. [DOI] [PubMed] [Google Scholar]