Abstract
Transmembrane signaling in bacterial chemotaxis has become an important model system for experimental and theoretical studies. These studies have provided a wealth of detailed molecular structures, including the structures of CheA, CheW, and the cytoplasmic domain of the serine receptor Tsr. How these three proteins interact to form the receptor/signaling complex remains unknown. By using EM and single-particle image analysis, we present a three-dimensional reconstruction of the receptor/signaling complex. The complex contains CheA, CheW, and the cytoplasmic portion of the aspartate receptor Tar. We observe density consistent with a structure containing 24 aspartate-receptor monomers and additional density sufficient to house the expected four CheA monomers and six CheW monomers. Within this bipolar structure are four groups of three receptor dimers that are not threefold symmetric and are therefore unlike the symmetric trimers observed in the x-ray crystal structure of the cytoplasmic domain of the serine receptor. In the latter, the interdimer contacts occur in the signaling domains near the hairpin loop. In our structure, the signaling domains within trimers appear spaced apart by the presence of CheA and CheW. This structure argues against models where one CheA and one CheW bind to the outer face of each of the dimers in the trimer. This structure of the receptor/signaling complex provides an additional basis for understanding the architecture of the large arrays of chemotaxis receptors, CheA, and CheW found at the cell poles in motile bacteria.
Keywords: chemotaxis, electron microscopy, macromolecular assembly, signal transduction
Motile bacteria are capable of detecting and moving in response to gradients of nutrients, oxygen, light, and other stimuli. They do so in response to temporal changes in the stimuli by altering the behavior of the motors that generate the force for cell movement. The signal transduction system controlling bacterial chemotaxis has become an important model for the study of transmembrane signaling, and the most studied system is that in Escherichia coli.
The core components of the E. coli chemotaxis signal-transduction system are found in nearly all motile bacteria and consist of transmembrane chemoreceptors; an associated histidine kinase, CheA; and an associated CheA-activator, CheW. Signaling occurs within the context of the assembled receptor/CheW/CheA complexes within a large, densely packed patch of chemoreceptors, which is typically located at one (or both) poles of the cell (1). No gross structural changes in the receptor/signaling complex are observed in response to stimulatory ligands (2).
Recent studies and modeling of the chemotaxis system have emphasized the importance of interactions among large numbers of receptors in terms of the system's sensitivity and adaptive response (3, 4), and chemoreceptors for different ligands appear to communicate with one another (3). The lack of detailed information about how CheA and CheW interact with the chemoreceptors and each other in the receptor/signaling complexes is a critical gap in our understanding of how the signaling works at the molecular level. The x-ray crystal structure of the cytoplasmic domain of the serine receptor (TsrC) has been solved (5) and shows the cytoplasmic domain to be a dimeric four-helix bundle composed of two symmetric antiparallel coiled coils. The four-helix bundles were found to associate into trimers in the crystal, and this “trimer of dimers” has become the basis for most current models of how large numbers of receptors might interact.
Soluble, active complexes can be formed from CheW, CheA, and the cytoplasmic domain of the aspartate receptor (TarC) fused to a leucine zipper dimerization domain (lz) (6–8), and the basic organization of this lzTarC/CheW/CheA complex has been determined (9). To elucidate the three-dimensional structure of the receptor/signaling complex and gain insight into the mechanism of CheA activation, we have carried out high-resolution EM studies of these soluble complexes. To locate the TarC C terminus and the lz domains, we also examined complexes formed with a related receptor fusion lacking the C-terminal 37 residues. These C-terminal residues are not necessary for signaling and CheA regulation (10) but contain the binding site for the CheR and CheB adaptation enzymes (11, 12). Here, we present three-dimensional structures for both complexes based on EM and single-particle image analysis. In these structures, we see clear indications that receptor four-helix bundles play an important role but are arranged differently from the symmetric trimer of dimers observed in the x-ray crystal structure of TsrC.
Materials and Methods
Protein Expression and Purification. CheA, CheW, CheY, and lzTarC (with gln at all four modification sites) were purified as described in refs. 7–9.
A truncated form of lzTarC (lzTar516) was purified by using the expression plasmid pPW001. The lzTar516 protein is 37 residues shorter than lzTarC, corresponding to a calculated mass difference of 4.07 kDa. The insert for plasmid pPW001 was constructed by using PCR amplification with Pfu Turbo DNA polymerase (Stratagene) using plasmid pMS103 as a template (7), with primers pGB008-pro (CGA CAT CAT AAC GGT TCT GGC) and Tar516-HindIII (ATT AAG CTT ATG CCA GGC GGA AAG CCG). The reverse primer appends a stop codon and a HindIII site after the codon in the lzTarC sequence (GenBank accession no. AF470454) that corresponds to Tar residue 516. The resulting 1.1-kb PCR product was ligated into the expression plasmid pGB008 (7, 13) after cutting with NcoI and HindIII. The insert was verified by automated DNA sequencing. The lzTar516 protein was purified essentially as described for lzTarC (7).
Assembly and Purification of Complexes. Ternary complexes of lzTarC/CheW/CheA (TCWA) and lzTar516/CheW/CheA (T516WA) were assembled as described in refs. 8 and 9. Proteins at a final concentration of 50 μM lzTar, 10 μM CheA, and 10 μM CheW were mixed with buffer (25 mM Tris·HCl/50 mM potassium glutamate/25 mM NaCl/5% DMSO/10% glycerol, pH 7.5). The final concentration of potassium glutamate was adjusted to 50 mM, and DTT was added to 1 mM. The complexes were sterile-filtered by using spin-X filters (Corning) and incubated at 30°C overnight. After formation, complexes were stored at room temperature (≈25°C).
TCWA and T516WA complexes were purified by HPLC and characterized as described in refs. 8 and 9. The T516WA complexes eluted with the same retention time as the TCWA complexes on a gel filtration column and activated CheA to a similar degree, confirming that the C-terminal 37 residues of Tar are not critical for formation of the receptor/signaling complexes.
HPLC gel filtration was performed on a TSK-Gel G5000PWXL column (Tosoh, Tokyo) using an elution buffer without glycerol, because glycerol interferes with the EM experiments. Previously, we used a TKGND buffer (25 mM Tris·HCl/50 mM potassium glutamate/25 mM NaCl/5% DMSO, pH 7.5) (9). We have used a simpler buffer, TKGM (25 mM Tris·HCl/50 mM potassium glutamate/5 mM MgCl2, pH 7.5). This buffer improved both the stability of the complexes after purification and the quality of sample grid preparation.
Kinase Activity Measurements. Kinase activity of the complexes before and after HPLC elution was determined by using a spectrophotometric coupled ATPase assay (8). After exchange into TKGND or TKGM buffers and their concomitant dilution, the activity of the complexes decreases exponentially. As previously reported, the activity of TCWA complexes in TKGND decays with t1/2 ≈60 min (9). The activity of TCWA complexes in TKGM decays with t1/2 ≈100 min, and the activity of T516WA complexes in TKGM decays with t1/2 ≈40 min. Aliquots of the peak fraction were placed on microscope grids within 30 min of elution to ensure that the majority of complexes were intact.
EM. After HPLC purification, the TCWA or T516WA complexes were diluted in TKGM up to 20-fold as necessary to give a suitable density of particles on the grids. Five microliters of the diluted complexes were applied to 400-mesh copper microscope grids covered by continuous carbon foils, which were then washed with TKGM buffer, stained with 2% uranyl acetate, blotted, and allowed to dry. Images at ×60,000 were recorded with doses of fewer than 20 electrons per Å2 on SO163 film (Eastman Kodak) by using a CM12 microscope (Philips Electronic Instruments, Mahwah, NJ) equipped with a cryostage and an anticontaminator (models 626 and 651, respectively; Gatan, Pleasanton, CA), both cooled to ≈–170°C. Micrographs were digitized by using a mode 1 SCAI scanner (Zeiss) at 7 μm per pixel. Groups of four adjacent pixels were averaged to give 14-μm pixels corresponding to 2.33 Å per pixel in the specimen.
Image Analysis and Three-Dimensional Reconstruction. Images of single particles were manually selected by using XIMDISP and were windowed from the digitized micrographs by using the spider image processing program (15). Particles were treated to remove any ramp of density and were normalized. About 4,900 TCWA and ≈1,300 T516WA particles were selected for analysis, and the TCWA and T516WA images were treated as independent data sets.
All particles were aligned initially by using the program imagic (Image Science Software, Berlin). The aligned images were subjected to multivariate statistical analysis (MSA), classified, and class averages were calculated. The upper and lower halves of the complexes (long axis vertical) did not present identical views. The images were divided into two parts, either the top or bottom two-thirds of the image, with the entire middle bulge included in both parts. The “bottom” image was rotated 180° to match the orientation of the “top”. The partial images were aligned and again subjected to MSA, yielding 60 class averages. The aligned images were combined to generate a two-dimensional average before generating a three-dimensional map.
The common lines-based function OP in the SPIDER package was used to determine the relative orientations of the class averages to one another. Three different initial sets of angles were used for the procedure. The results of the three independent orientation searches were three sets of Euler angles from which three reconstructions were calculated. The three reconstructions for the TCWA and T516WA complexes were very similar, differing only in orientation within the reconstructed volume. The similarity confirmed that the result was independent of the starting point. One model each for TCWA and T516WA was arbitrarily chosen and rotated to orient the long axis of the complex along the z-axis of the volume. This model was the starting point for further rounds of alignment.
In subsequent alignments, the most current three-dimensional model was used to generate the reference projections for the next round of multireference alignment. Because the elongated structure lies on its side, the reference projections were spaced every 4.5° around the long axis of the complex (Z) and out of plane tilt angles limited from –40° to +40° in 2° increments. Reconstructions were calculated by using BP 3F in SPIDER. The alignment was iterated until the reconstructions were stable and the resolution no longer improved. To determine the effect choice of reference had on the reconstruction, an additional reconstruction based on alignment to the middle bulge alone was carried out.
Results
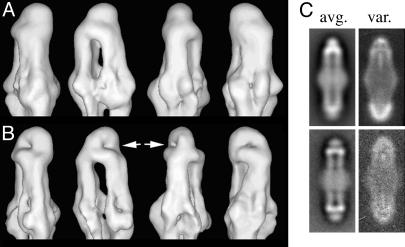
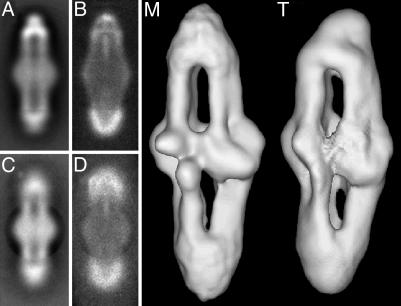
Three-Dimensional Reconstructions of TCWA and T516WA. We obtained three-dimensional reconstructions of the TCWA and T516WA receptor/signaling complexes (Fig. 1) with a resolution of 27 Å by using the 0.143 Fourier shell correlation criteria of Rosenthal and Henderson (15) (data not shown). The reconstructions of TCWA and T516WA differ very little in surface views. The complexes are 42 nm long by 12 nm wide, with an 18-nm-wide bulge in the center. There are two pillars of density separated by ≈2.5–4.0 nm that extend from the central bulge and meet at the ends of the complex. The pillars are narrower at the terminal knobs than near the central bulge. The two halves of the complex in these reconstructions do not appear to be related by a twofold axis of symmetry (compare the top to bottom or left to right in Fig. 2 M and T). One side of the complex appears flattened relative to the other, and there appears to be a slight rotation between the top and bottom. The flattening and the rotation may be distortions caused by contact of the particle with the continuous carbon film or due to flattening and drying during the staining process.
Fig. 1.
Reconstructions of the receptor/signaling complex. (A) Views of the reconstruction of the TCWA complex. (B) The same views of the T516WA complex. Only the upper portion is shown. The white arrows indicate surface dimples that correlate with C-terminal density that is missing in the T516WA complex. The bulges around the middle correspond to CheW and CheA. (C) The two-dimensional average and variance of the TCWA complex (Upper) and two-dimensional average and variance of the T516WA complex (Lower).
Fig. 2.
Comparison of end versus center alignments. Shown are the averages (A and C) and variance maps (B and D) for TCWA. Images in A and B are from alignments to the top two-thirds of the complex, and C and D are from alignments using the middle of the complex. The effect of the circular mask used is clearly seen in C. (M) A surface view of the reconstruction of the TCWA map aligned at the middle. (T) The map aligned by using the top two-thirds. 18-Å and 25-Å filters have been applied to maps M and T, respectively; both maps are contoured using a 1.2-σ cutoff.
Although only the upper or lower two-thirds partial images of the complexes shown in Fig. 1 were analyzed during alignment, we carried each complete image through the reconstruction. The bottom half of the map that includes the parts of the images not used for alignment is weaker and wider in appearance than the upper half generated from the aligned parts of the images. Including only the best images according to cross correlation value resulted in a lower-resolution map (data not shown). The best resolution was obtained when all images were included, suggesting that sample heterogeneity was not the limiting factor.
Our previous experience with alignment of the coaxial rings of the flagellar motor (17, 18) suggested that conformational variability due to flexing of the structure was a source of distortion in our averaged images. For the motor, we improved the average of a particular component by using that component alone for the alignment. To use this approach, we realigned the complexes by using only the middle bulge. As a result, the parts of the two-dimensional averages and three-dimensional reconstructions corresponding to the middle bulge were stronger and sharper than the ends, which were somewhat weaker and more diffuse. The resolution of the middle of the reconstruction, corresponding to the segment used for alignment, is 21 Å (15), suggesting that the middle is more ordered or stable than the ends. In the average for TCWA in which the two-thirds partial images were used for alignment, the aligned (top) end appears stronger and better defined than the other end (Fig. 2 A). The variance map (Fig. 2B) for this average has high variance at the unaligned (bottom) end, indicating significant misalignment. This high variance cannot arise from variation in composition among the complexes because both halves are represented in both the top and bottom of the averages and variance. Any variation in composition would thus result in the same variance at both ends. Where the complexes have been aligned by using only the middle (Fig. 2C), the two ends are blurred and the middle is sharp. There is equal variance (Fig. 2D) at both ends of the complex. The two reconstructions are very similar (Fig. 2 M and T) but with better structural definition in the regions included in the alignment.
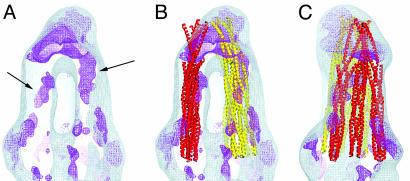
Locating the C-Terminal Domain of Tar. Francis et al. (9) used immunolabeling and EM to identify the general locations of CheA, CheW, and CheY binding, and the leucine zippers within the TCWA complex. We have determined the location of the C-terminal residues that should represent the only difference between the TCWA and T516WA complexes. The surface similarity between the structures suggested that the missing density was mainly internal; we thus calculated three-dimensional difference maps between the two structures. The missing density was found to be internal, in the terminal knob adjoining the central cavity that lies between the pillars of density (Fig. 3).
Fig. 3.
Three-dimensional map of differences between the TCWA and the C-terminally truncated T516WA complexes. (A) A gray wire mesh view of the surface of the reconstruction of the TCWA complex and a darker (magenta) wire mesh representation of density that is missing in the T516WA map (both contoured at 1.2 σ). (B) The same reconstruction with two groups of three TsrC four-helix bundles inserted as arranged in Fig. 5. (C) The same structures after a 90° rotation about the vertical axis. The strongest difference is found within the knob at the end. This difference is not seen in the surface maps (Fig. 1) except as a dimple in the surface of lzTar516 complex. Rods of difference density are seen in A (right arrow), for which there are neighboring negative rods (not shown) consistent with a change in the position of the related four-helix bundle. The other differences are located peripherally and are likely small changes in packing.
Whereas the TCWA and T516WA complexes activate CheA to a similar degree, the lower stability of the T516WA complexes suggests that the C-terminal domain plays a role in stabilizing these soluble complexes. This region of the receptor is not necessary for signaling and CheA regulation (10) but serves as a binding site for the CheR and CheB adaptation enzymes (11, 12). The stabilizing effect may be a result of the packing of TarC within the soluble TCWA complex but also could be relevant to membrane receptor/signaling complex formation.
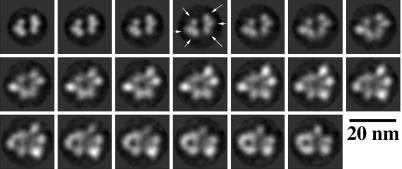
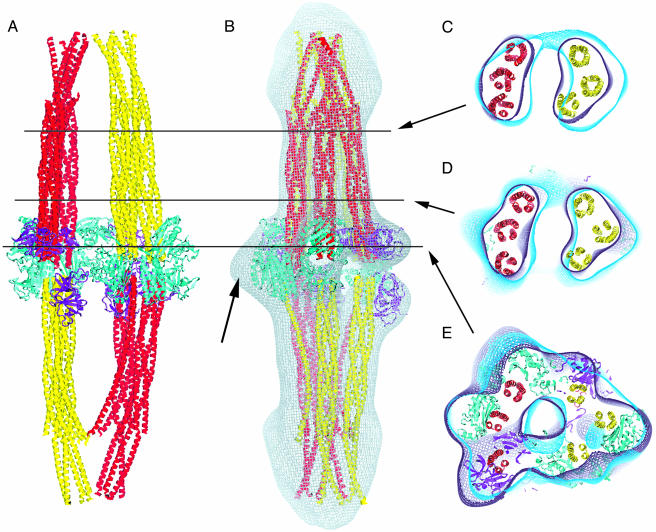
Location and Stoichiometry of the Tar Cytoplasmic Domain. To determine the stoichiometry of lzTarC in our structure, we fit the TsrC dimer structure (5) into our structure manually by using the visualization program o (19). We previously demonstrated that the N termini of lzTarC are located at the two ends of the complex (9), and we predicted that the C termini would be as well. The large difference observed in the terminal knob due to the deletion of the C-terminal 37 aa of Tar confirms this prediction. This difference fixes the approximate horizontal location of the TarC four-helix bundles within the complex, whereas the axial (up-down) placement and location of the signaling domains are determined by the need to accommodate CheA and CheW. Each of the four pillars of density could accommodate only three four-helix bundles as indicated by the appearance of three well defined densities in the pillars near the middle of the complex (see Fig. 4). The separation seen is consistent with our calculated resolution of 21 Å.
Fig. 4.
Axial sections through the electron density map of the TCWA complex. The sections, spaced 4.7 Å apart, begin at the top left and are ordered left to right in successive rows. The sections begin just below the knob at the top of the complex in Fig. 2M and end just below the central bulge, ≈two-thirds of the way down the complex. The sections show the presence in each pillar of three blobs of density (arrows) corresponding to the three Tar dimers in each quarter of the complex. The map resolves each of the receptor four-helix bundles at our resolution of 21 Å.
Placement of CheA and CheW Within the Complex. By using known molecular structures, we assembled a complete complex (Fig. 5). The purpose of this modeling was to determine whether there was sufficient contiguous density to accommodate the expected numbers of CheA and CheW subunits. The placement of the components is consistent with the density in the reconstruction and with our previous determination of the general organization of the complex. Despite the fact that we observed no true twofold symmetry in our reconstructions, it is reasonable to expect Tar, CheA, and CheW to have consistent relationships with one another as a consequence of the specific binding sites in the proteins. It was possible to fit the structure of the core P3, P4, and P5 domains of CheA (20) as a dimer only after rotations about the linker between the P3 dimerization domain and the P4 kinase domain. This altered dimer could then be fit into two very similar (almost symmetric) locations (Fig. 5). Two CheW molecules could be fit easily into locations on one side of the complex, and two others were fit into weaker density on the opposing side in very similar environments. The final two CheW molecules could be fit on the inner face of the pillars. Receptor- and CheA-binding faces of CheW have been identified (21). We were able to orient the receptor-binding face of each CheW toward a TsrC helical bundle and the CheA-binding face of each CheW toward a CheA. There is a great deal of flexibility in the CheA structure, and we do not know how the P1 and P2 domains are arranged relative to P3, P4, and P5. There is, however, additional density in the reconstruction, and we can accommodate the structures of the P1 (22) and P2 (23) domains within this density.
Fig. 5.
Modeling of the electron density with the atomic models for TsrC, CheA, and CheW. (A) A view of the complete model without the density map. Shown are CheA (cyan), CheW (magenta), and the TsrC four-helix bundles representing TarC (yellow or red). (B) A view after a rotation of 90° about the long axis. The map in gray is identical to Fig. 2M but a different view. The black arrow indicates unoccupied density that can accommodate the P1 and P2 (data not shown) domains of CheA. (C–E) Show are ≈5.0-nm-thick sections through the maps and model. The lines indicate the center of the sections relative to A and B. The maps shown in Fig. 2 M and T are both shown as violet and blue, respectively.
After docking 24 TsrC, 4 CheA, and 6 CheW monomers, we conclude that there is not enough density to account for any additional CheA or CheW monomers. These results and our previous observations (8) suggest that the composition of the complex is 24 lzTar, 6 CheW, and 4 CheA monomers. Our assignment of locations to the C-terminal CheR-binding domain and the pillars of density that correspond to TarC suggests that the remaining density at the ends of the complex must correspond to C-terminal Tar residues ≈490–516 and the lz domains, consistent with our previous studies (9).
In Fig. 5, the TsrC dimers do not interdigitate but meet roughly tip-to-tip at the signaling domain hairpin. This arrangement is necessitated by two factors. First, interdigitating the TsrC dimers precludes the fitting of CheA within the density. Second, the difference map between the TCWA and T516WA suggests a natural point at which to align the N- and C-terminal ends of the TsrC dimers (see Fig. 3). Based on this arrangement, we conclude that there is a bend between each TarC and its associated lz domain, and that the lz domains pack at the outer surfaces of the two ends of the complex, whereas the C termini pack internally as suggested by the difference map. Comparison with the TsrC structure seems to suggest that the C-terminal portion of the TarC helices is bent, and that they may be interacting with the TarC dimers from the laterally opposing pillar, stabilizing the complex. There is a stretch of six alanines in both Tar and Tsr (beginning at Tar residue 493) that could switch from a helix to a strand or loop allowing such a bend.
Discussion
The details of the receptor/signaling complex provide insight into the protein–protein interactions within this structure. Based on lower-resolution, two-dimensional averages, we had previously proposed that the structure was a symmetric barrel-shape with a hollow center (9). Our three-dimensional reconstruction shows two sets of two pillars of receptors with an open space between, joined at the signaling domains of the receptor by interactions with CheA and CheW. The complex lacks exact symmetry (e.g., P2), although our exploration of the structure suggests approximately equivalent relationships among the components. Our previous work on these soluble receptor/signaling complexes demonstrated that complex assembly is self-limiting and produces fairly uniform complexes ≈1.4 MDa in size (8). The closed shape we observe for the complex may be because of the need to bury protein–protein interaction surfaces. In membrane receptor complexes in vivo, these interactions may be satisfied by lateral interactions among the receptors at the cell pole.
The observed stoichiometry of six lzTarC dimers per CheA dimer is consistent with other recent in vitro studies of receptor/signaling complexes. We had previously estimated that there were 7 ± 1 lzTarC dimers per CheA dimer (8). Analysis of the activation of CheA by TsrC found a concentration dependence on TsrC that could be fit with a Hill coefficient of 5.3 (24). Direct analysis of the stoichiometry of complexes between Tsr in membranes and CheA found a ratio of 6:1 under conditions of saturating CheA (25). Finally, analysis of the activation of CheA by Tar in membranes using a heterogeneous two-state model gave a fit to the data suggesting that the ratio of receptor dimers to CheA dimers is 6:1 or less (26). Recent in vivo studies by Li and Hazelbauer (27) of the total cellular content of chemotaxis proteins found a lower stoichiometry of 3.4 receptor dimers per CheA dimer. However, there is significant uncertainty as to the fraction of the total cellular CheA that is bound into complexes, so this result should not be taken as conflicting with the in vitro studies of the composition of the receptor/signaling complexes.
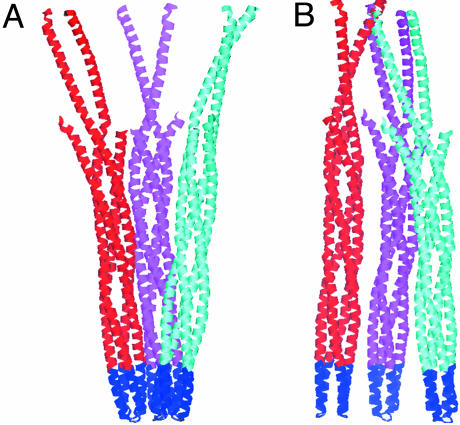
The x-ray crystal structure of TsrC (5), which has been widely used as a basis for modeling how the receptor/signaling complexes might assemble and function (28–32), contains a symmetric “trimer of dimers”, where the signaling domains form tight hairpin turns and are in close proximity (Fig. 6A). In our structure of the TCWA complex, we have 24 Tar cytoplasmic domains in four groups of three dimers. However, the arrangement of the three dimers in the TCWA complex is quite unlike the trimer of dimers in the x-ray crystal structure (Fig. 6). This result is not surprising, because in the crystal structure, the portions of the Tsr receptor that are likely to interact with CheA and CheW are in contact with each other. Unlike the trimer of dimers, the groups of three dimers we observe are not threefold symmetric. The trimer of dimers in the x-ray crystal structure has its interdimer contacts in the signaling domain near the hairpin loop; the dimers in our structure appear to spread apart at the signaling domain with CheA and CheW bound asymmetrically to the groups of dimers. This arrangement of receptors, CheA, and CheW argues against models where CheA and CheW bind symmetrically around the outside of the trimer of dimers (28). In our model, the CheA and CheW molecules appear to form a continuous network that connects the receptor-signaling domains from the top and bottom halves of the complex and also laterally links the groups of three receptors together.
Fig. 6.
Comparison of receptor four-helix bundle interactions for TsrC from the x-ray structure with interactions in our model of the receptor/signaling complex. (A) The TsrC trimer of dimers as seen in the x-ray crystal structure (5). Individual four-helix bundles are colored in red, magenta, or cyan. (B) The group of three dimers seen as the yellow cluster in the upper half of Fig. 5A. The signaling domains that interact with CheA and CheW (both at the bottom, in blue) are tightly associated in A, whereas in B they are spread apart, presumably because of their interactions with CheA and CheW.
Since the discovery of the clustering of chemotaxis receptors (1), it has been proposed that the receptors are in some way interconnected to facilitate coordination in regulating CheA (see ref. 32 for a review). Extended arrays of receptors have been visualized by EM in cells overexpressing Tsr in the absence of CheW and CheA (34, 35). In these cells, Tsr tended to form bilaminar structures where the signaling domains are apparently interdigitated in an antiparallel manner. The overlap between receptor-signaling domains in these bilayers is ≈6.5 nm (35). It is possible that the TarC dimers interdigitate or overlap to some extent, although a significant overlap does not seem consistent with our structure. The lzTarC constructs do tend to form tetramers in solution (6), and such a tetramer may form a building block of the assembled complex. This tetramer might correspond to a domain-swapped form with an extended signaling domain that interacts with CheW and CheA (9, 36). Another possibility is that the tetramer forms through the interaction suggested above between the N- and C-terminal portions of the Tar cytoplasmic domain. Either of these interdimer interactions could serve as the basis for communicating information about one receptor's state to neighboring receptors and play a role in vivo in the formation of extended receptor arrays that incorporate CheA and CheW.
Our provisional placement, which is intended primarily to show the map can house the molecular structures of TsrC, CheW, and CheA, is consistent with predicted contacts between the Tar signaling domain, CheA, and CheW, which are critical to the formation of the active receptor/signaling complex. One important consequence of our model is that it suggests that there must be changes in the conformations of the components from those observed in the atomic structures of the isolated components. For example, the arrangement that accommodates both CheA and CheW results in some protrusion of the TsrC helices from the density of the reconstruction. Also, we needed to employ rotations about the P3–P4 linker to generate a CheA dimer that could be docked into two, roughly symmetric, locations. Conformational changes seem likely to be essential to the formation of active receptor/signaling complexes and are key to understanding the activation and regulation of CheA.
The biochemical evidence that CheA is activated to the same extent in complexes with membrane receptors and in the TCWA complex strongly argues that the protein–protein interactions among CheA and CheW and the receptors must be very similar in both cases (9). Within the complex, the CheA dimer seems likely to be bridging the quarters of the complex and holding it together, and CheW appears to propagate this bridging. Although further studies will be needed to determine the true positions and orientations of Tar, CheA, and CheW, this first structure provides a new framework for understanding the receptor/signaling complex and has enabled us to present a model for the interactions of CheA and CheW with the chemotaxis receptors.
Acknowledgments
We thank M. N. Levit, C. Mercogliano, T. Tolstykh, and T. R. Shaikh for valuable advice and assistance. This work was supported by National Institutes of Health Fellowship F32 GM064228 (to P.M.W.); National Institutes of Health Grants R01 GM057773, P01 GM062580, and R01 GM35433 (to D.J.D.); and Defense Advanced Research Projects Agency Grant 3416183 (to J.B.S.).
Author contributions: N.R.F., P.M.W., J.B.S., D.J.D., and D.R.T. designed research; N.R.F., P.M.W., and D.R.T. performed research; N.R.F., P.M.W., D.J.D., and D.R.T. analyzed data; P.M.W. contributed new reagents/analytic tools; and N.R.F., P.M.W., J.B.S., D.J.D., and D.R.T. wrote the paper.
Abbreviations: Tsr, serine receptor; TsrC, cytoplasmic domain of Tsr; Tar, aspartate receptor; TarC, cytoplasmic domain of Tar; lz, leucine zipper dimerization domain; lzTarC, a chimeric protein consisting of a lz domain fused with TarC; lzTar516, a truncated form of lzTarC; TCWA, ternary complex of lzTarC/CheW/CheA; T516WA, ternary complex of lzTar516/CheW/CheA.
References
- 1.Maddock, J. R. & Shapiro, L. (1993) Science 259, 1717–1723. [DOI] [PubMed] [Google Scholar]
- 2.Gegner, J. A., Graham, D. R., Roth, A. F. & Dahlquist, F. W. (1992) Cell 70, 975–982. [DOI] [PubMed] [Google Scholar]
- 3.Sourjik, V. & Berg, H. C. (2004) Nature 428, 437–441. [DOI] [PubMed] [Google Scholar]
- 4.Duke, T. A. & Bray, D. (1999) Proc. Natl. Acad. Sci. USA 96, 10104–10108. [DOI] [PMC free article] [PubMed] [Google Scholar]
- 5.Kim, K. K., Yokota, H. & Kim, S. H. (1999) Nature 400, 787–792. [DOI] [PubMed] [Google Scholar]
- 6.Cochran, A. G. & Kim, P. S. (1996) Science 271, 1113–1116. [DOI] [PubMed] [Google Scholar]
- 7.Surette, M. G. & Stock, J. B. (1996) J. Biol. Chem. 271, 17966–17973. [DOI] [PubMed] [Google Scholar]
- 8.Liu, Y., Levit, M., Lurz, R., Surette, M. & Stock, J. (1997) EMBO J. 16, 7231–7240. [DOI] [PMC free article] [PubMed] [Google Scholar]
- 9.Francis, N. R., Levit, M. N., Shaikh, T. R., Melanson, L. A., Stock, J. B. & DeRosier, D. J. (2002) J. Biol. Chem. 277, 36755–36759. [DOI] [PubMed] [Google Scholar]
- 10.Okumura, H., Nishiyama, S., Sasaki, A., Homma, M. & Kawagishi, I. (1998) J. Bacteriol. 180, 1862–1868. [DOI] [PMC free article] [PubMed] [Google Scholar]
- 11.Wu, J., Li, J., Li, G., Long, D. G. & Weis, R. M. (1996) Biochemistry 35, 4984–4993. [DOI] [PubMed] [Google Scholar]
- 12.Barnakov, A. N., Barnakova, L. A. & Hazelbauer, G. L. (1999) Proc. Natl. Acad. Sci. USA 96, 10667–10672. [DOI] [PMC free article] [PubMed] [Google Scholar]
- 13.Bustos, S. A. & Schleif, R. F. (1993) Proc. Natl. Acad. Sci. USA 90, 5638–5642. [DOI] [PMC free article] [PubMed] [Google Scholar]
- 14.Smith, J. (1999) J. Struct. Biol. 125, 223–228. [DOI] [PubMed] [Google Scholar]
- 15.Frank, J., Radermacher, M., Penczek, P., Zhu, J., Li, Y., Ladjadj, M. & Leith, A. (1996) J. Struct. Biol. 116, 190–199. [DOI] [PubMed] [Google Scholar]
- 16.Rosenthal, P. B. & Henderson, R. (2003) J. Mol. Biol. 333, 721–745. [DOI] [PubMed] [Google Scholar]
- 17.Sosinsky, G. E., Francis, N. R., Stallmeyer, M. J. & DeRosier, D. J. (1992) J. Mol. Biol. 223, 171–184. [DOI] [PubMed] [Google Scholar]
- 18.Thomas, D., Morgan, D. G. & DeRosier, D. J. (2001) J. Bacteriol. 183, 6404–6412. [DOI] [PMC free article] [PubMed] [Google Scholar]
- 19.Jones, T. A., Zou, J. Y., Cowan, S. W. & Kjeldgaard, M. (1991) Acta Crystallogr. A 47, 110–119. [DOI] [PubMed] [Google Scholar]
- 20.Bilwes, A. M., Alex, L. A., Crane, B. R. & Simon, M. I. (1999) Cell 96, 131–141. [DOI] [PubMed] [Google Scholar]
- 21.Boukhvalova, M., VanBruggen, R. & Stewart, R. C. (2002) J. Biol. Chem. 277, 23596–23603. [DOI] [PubMed] [Google Scholar]
- 22.Mourey, L., Da Re, S., Pédelacq, J.-D., Tolstykh, T., Faurie, C., Guillet, V., Stock, J. B. & Samama, J.-P. (2001) J. Biol. Chem. 276, 81074–81082. [DOI] [PubMed] [Google Scholar]
- 23.Welch, M., Chinardet, N., Mourey, L., Birck, C. & Samama, J. P. (1998) Nat. Struct. Biol. 5, 25–29. [DOI] [PubMed] [Google Scholar]
- 24.Ames, P. & Parkinson, J. S. (1994) J. Bacteriol. 176, 6340–6348. [DOI] [PMC free article] [PubMed] [Google Scholar]
- 25.Levit, M. N., Grebe, T. W. & Stock, J. B. (2002) J. Biol. Chem. 277, 36748–36754. [DOI] [PubMed] [Google Scholar]
- 26.Bornhorst, J. A. & Falke, J. J. (2003) J. Mol. Biol. 326, 1597–1614. [DOI] [PMC free article] [PubMed] [Google Scholar]
- 27.Li, M. & Hazelbauer, G. L. (2004) J. Bacteriol. 186, 3687–3694. [DOI] [PMC free article] [PubMed] [Google Scholar]
- 28.Shimizu, T. S., Le Novere, N., Levin, M. D., Beavil, A. J., Sutton, B. J. & Bray, D. (2000) Nat. Cell. Biol. 2, 792–796. [DOI] [PubMed] [Google Scholar]
- 29.Kim, S. H., Wang, W. & Kim, K. K. (2002) Proc. Natl. Acad. Sci. USA 99, 11611–11615. [DOI] [PMC free article] [PubMed] [Google Scholar]
- 30.Ames, P., Studdert, C. A., Reiser, R. H. & Parkinson, J. S. (2002) Proc. Natl. Acad. Sci. USA 99, 7060–7065. [DOI] [PMC free article] [PubMed] [Google Scholar]
- 31.Studdert, C. A. & Parkinson, J. S. (2004) Proc. Natl. Acad. Sci. USA 101, 2117–2122. [DOI] [PMC free article] [PubMed] [Google Scholar]
- 32.Homma, M., Shiomi, D. & Kawagishi, I. (2004) Proc. Natl. Acad. Sci. USA 101, 3462–3467. [DOI] [PMC free article] [PubMed] [Google Scholar]
- 33.Webre, D. J., Wolanin, P. M. & Stock, J. B. (2004) Trends Cell Biol. 14, 478–482. [DOI] [PubMed] [Google Scholar]
- 34.Lefman, J., Zhang, P., Hirai, T., Weis, R. M., Juliani, J., Bliss, D., Kessel, M., Bos, E., Peters, P. J. & Subramaniam, S. (2004) J. Bacteriol. 186, 5052–5061. [DOI] [PMC free article] [PubMed] [Google Scholar]
- 35.Weis, R. M., Hirai, T., Chalah, A., Kessel, M., Peters, P. J. & Subramaniam, S. (2003) J. Bacteriol. 185, 3636–3643. [DOI] [PMC free article] [PubMed] [Google Scholar]
- 36.Wolanin, P. M. & Stock, J. B. (2004) Curr. Biol. 14, R486–R487. [DOI] [PubMed] [Google Scholar]


