

Abstract
The phosphoenolpyruvate:glycose phosphotransferase system (PTS) participates in important functions in the bacterial cell, including the phosphorylation/uptake of PTS sugars. Enzyme I (EI), the first protein of the PTS complex, accepts the phosphoryl group from phosphoenolpyruvate, which is then transferred through a chain of proteins to the sugar. In these studies, a mutant GFP, enhanced yellow fluorescent protein (YFP), was linked to the N terminus of EI, giving Y-EI. Y-EI was active both in vitro (≥90% compared with EI) and in vivo. Unexpectedly, the subcellular distribution of Y-EI varied significantly. Three types of fluorescence were observed: (i) diffuse (dispersed throughout the cell), (ii) punctate (concentrated in numerous discrete spots throughout the cell), and (iii) polar (at one or both ends of the cell). Cells from dense colonies grown on agar plates with LB broth or synthetic (Neidhardt) medium showed primarily bipolar or punctate fluorescence. In liquid culture, under carefully defined carbon-limiting growth conditions [ribose (non-PTS), mannitol (PTS sugar), or dl-lactate], cellular levels of enzymatically active Y-EI remain essentially constant for each carbon source, but fluorescence distribution depends on C source, cell density, growth phase, and apparently on “conditioned medium.” Fluorescence was diffuse during exponential growth on LB or ribose/Neidhardt medium. On ribose they became punctate in the stationary phase, reverting to diffuse when more ribose was added. In LB, both Y-EI and a nonphosphorylatable mutant, H189Q-Y-EI, showed a diffuse fluorescence during growth, but, shortly after the addition of isopropyl β-d-thiogalactopyranoside, Y-EI became bipolar; H189Q-Y-EI did not. The functions of EI sequestration remain to be determined.
Keywords: sequestration, subcellular localization, yellow fluorescent fusion protein, bipolar, punctate
The phosphoenolpyruvate:glycose phosphotransferase system (PTS) phosphorylates many sugars during their translocation across the bacterial cytoplasmic membrane and utilizes the following phosphotransfer sequence
 |
[1] |
where PEP is phosphoenolpyruvate and HPr is the histidinecontaining phosphocarrier protein.
The reactions are physiologically reversible, except for the last step (sugar phosphorylation and translocation). The Escherichia coli PTS phosphorylates hexoses, hexitols such as mannitol, N-acetylglucosamine, and several disaccharides but not other sugars such as lactose, ribose, and other pentoses (for reviews, see refs. 1–5).
The first step in sugar uptake by the PTS is the transfer of the phosphoryl group from phosphoenolpyruvate to enzyme I (EI), an indispensable component of the complete system (see reviews in refs. 6 and 7). One key, we think, to the physiological behavior of the PTS is the fact that EI exists in a monomer/dimer transition, and only the dimer accepts the phosphoryl group from phosphoenolpyruvate. The E. coli monomer contains 575 amino acids (63.5 kDa).
In the present studies, mutants of the genes encoding two enhanced GFP mutants, enhanced yellow fluorescent protein (YFP) and cyan fluorescent protein (CFP) (8), were fused to ptsI for studies aimed at determining the EI dimer level during sugar phosphorylation, both in vitro and in vivo. The fusions were constructed so that YFP and CFP each was linked at the N and C termini of EI, giving Y-EI, C-EI, EI-Y, and EI-C, respectively. Each of the proteins was ≥90% as active as wild-type EI in two types of in vitro assays, and each supported normal growth of an E. coli EI deletion mutant on mannitol, a sugar alcohol that requires a functional PTS.
Completely unanticipated results were obtained when cells expressing the fluorescent proteins were observed microscopically during growth. The fluorescence distribution varied from diffuse (dispersed throughout the cell) to punctate (concentrated in a number of discrete spots in the cell) to polar (at one or both ends of the cell). The distribution of diffuse to punctate, for example, was reversible and time-dependent, and, therefore, during the transition, the cells contained both diffuse and localized fluorescence.
We report here some of the conditions necessary for the subcellular localization of EI, a cytoplasmic protein essential for the catabolism of many sugars by bacterial cells.
Materials and Methods
Materials. The following chemicals, reagents, and materials were purchased from the indicated sources: DNA restriction and modifying enzymes were from New England Biolabs; d-ribose and dl-lactate were obtained from Calbiochem (grade A); d-mannitol was from Sigma and was stated to be >99% pure. pRSETB-FP clones (8) were a kind gift from J. Remington (University of Oregon, Eugene). Other buffers and reagents were of the highest purity commercially available.
Growth and Maintenance of E. coli Strains. BL21-DE3-ΔEI strain was used except where noted. Cells were grown in LB or in Neidhardt minimal medium with the indicated sugar. Optical density (OD) was measured at 420 nm or 600 nm as indicated.
Construction and Expression of Fusion Proteins. DNA preparation and analysis, restriction enzyme digests, ligation, and transformations were performed according to standard techniques described in ref. 9. YFP-EI and CFP-EI were cloned as follows: a NotI site was introduced in the FP constructs by PCR (primer pair for pRSETB-YFP: plasmid-F-NotI, 5′-GGAAAGAAGCTTGATCCGGCTGCTAACA-3′, and plasmid-R-NotI-YFP, 5′-ATGGCGGCCGCTTTGTATAGTTCATCCA-3′; primer pair for pRSETB-CFP: plasmid-F-NotI and plasmid-R-NotI-CFP, 5′-AATAAGCGGCCGCCTTGTACAGCTCGTCCA-3′; underlines indicate NotI sites). The E. coli EI gene [amplified from pDS20 plasmid (10) by PCR with primers Ec-EI-N-NotI, 5′-GCGGCCGCAATGATTTCAGGCATTTTAGCA-3′, and Ec-EI-R-HindIII, 5′-GTAAGCAAGCTTCATCTCGTGGATTAG-3′] was inserted into the NotI and HindIII sites of the corresponding NotI-modified FP plasmid. The resulting clones have three additional amino acids (AAA) separating FP and EI.
EI-YFP and EI-CFP were cloned as follows: The second NdeI site in the FP plasmid was eliminated by a silent mutation by using PCR with the primer pair F-2NdeI, 5′-ATGAAACGGCATGACT-3′, and R-2NdeI, 5′-GTGATCTGGGTATCTTG-3′. The E. coli EI gene was amplified from pDS20 by PCR with the primer pair EI-N-NdeI, 5′-GGCGGGCATATGATTTCAGGCATTTTAGCA-3′, and Ec-EI-C-AseI, 5′-GGGCGATTAATVGCAGATTGTTTTTTCTTCA-3′. The right construct was screened by restriction analysis (NdeI–HindIII digestion to produce a 2.5-kb fragment). The final constructs contain an additional amino acid (I) inserted between EI and FP. The QuikChange Site-Directed Mutagenesis Kit (Stratagene) was used to mutate His-189 of EI to Gln.
Expression and Purification of Fusion Protein. BL21-DE3-ΔEI cells carrying the respective plasmid were grown to an OD600 of 0.5, induced with isopropyl β-d-thiogalactopyranoside (IPTG) (0.5 mM), and further allowed to grow at 37°C for 2 h. The cell pellet of a 3-liter culture was resuspended in 30 ml of buffer A (25 mM NaPi, pH 7.5/0.5 M NaCl/1 mM 2-mercaptoethanol) and lysed (with a hydraulic French press), and DNA was precipitated (5 ml of 10% streptomycin sulfate solution). The lysate was centrifuged at 200,000 × g for 1 h at 4°C. The supernatant fluid was filtered through a 0.22-μm filter and transferred to a 12-ml Ni-NTA bead column (flow rate of 1 ml/min, Qiagen, Valencia, CA). The column was washed with 5 column volumes of buffer A and then with buffer A containing 12.5 mM imidazole (5 volumes). Buffer A containing 25 mM imidazole (2.5 volumes) was then applied to the column, which eluted most of the protein (brightly colored fractions). Applied to the column next were 1.5 column volumes each of buffer A containing 50 and 75 mM imidazole, respectively. Fractions were examined by SDS/PAGE. The fusion proteins migrated at the expected molecular weights. The activities of the fluorescent fusion proteins and wild-type EI were determined by lactate dehydrogenase and sugar-phosphorylation assays, which were performed as described in ref. 11. Y-EI exhibited at least 90% of the activity of wild-type EI. The activity of the fusion protein was also tested in vivo. Transformants of the E. coli deletion mutant that expressed Y-EI fermented and grew on mannitol. This sugar alcohol has an absolute requirement for a functional PTS. In addition to the activity assays, physical properties of Y-EI were extensively characterized.
Microscopic Observation and Quantitation of Subcellular Distribution of Y-EI. Y-EI was selected for the present study. We used a Zeiss Axioplan light microscope equipped with a CoolSnap digital monochrome camera and a Zeiss Axiovert inverted light microscope equipped with Photometrics CH300 (Tucson, AZ) and I-Pentamax 512 (Princeton Instruments, Trenton, NJ) digital cameras. Both microscopes were equipped with appropriate YFP filters. The digital cameras in both cases were connected to a computer, and images were acquired by using ip lab software. Pseudocolors are used for representation of the yellow fluorescence visible to the eye. Cells from culture were observed with a ×100 oil-immersion objective, either directly or in soft agar applied to the slide at room temperature. Several observations at 25°C–37°C were performed with a Labtech stage warmer (Nevtek, Burnsville, VA), but there was no detectable effect of changing the temperature within this range. Quantitation was performed by counting the number of cells with a given distribution relative to the total number of cells in a field. A minimum of five fields was counted for each sample (total of 100–300 bacteria per field, depending on cell density). For obtaining a growth curve in Neidhardt medium, cultures were inoculated with overnight cultures grown on the same carbon source (at either 1.89 mM or 20 mM for ribose, glucose, and mannitol and twice these concentrations for lactate). Cell growth was monitored by periodically measuring OD at 420 nm and at 600 nm; the samples also were observed microscopically to determine the distribution of the fluorophore.
Results
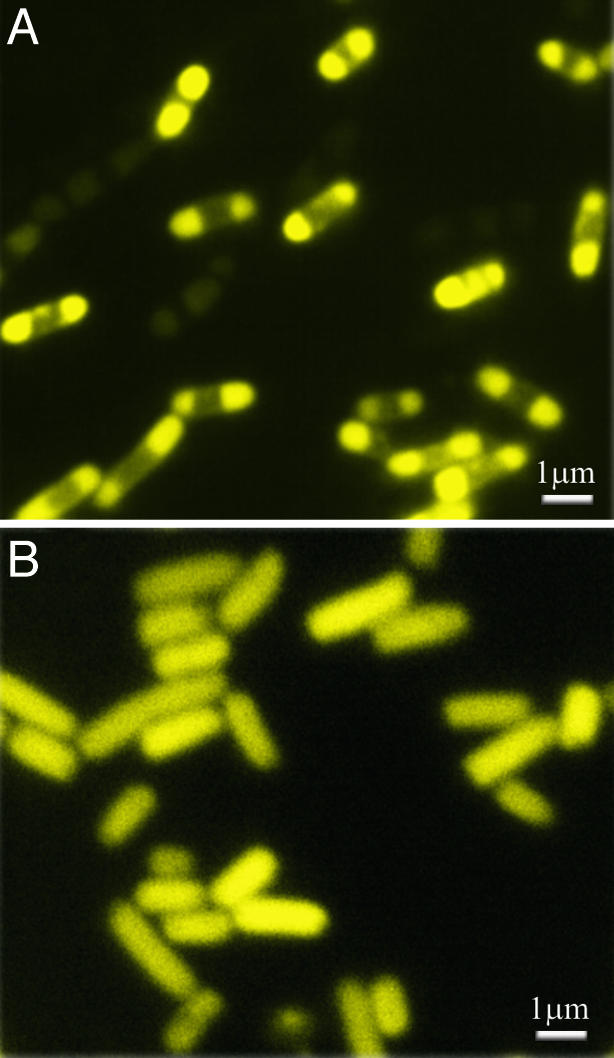
Preliminary Results. For purification and characterization purposes, the four fusion fluorescent EI proteins were overexpressed in BL21-DE3-ΔEI cells. Examination during growth showed that under some conditions the FPs were not distributed uniformly throughout the cells. The bacteria were grown on agar plates containing either LB broth or the Neidhardt synthetic medium (12) supplemented with different carbon sources. Small samples of the colonies on the agar plates were spread on slides and examined microscopically. As is evident in Fig. 1 A–D, for dense colonies, ≥80% of the cells grown on either the LB or the Neidhardt medium showed a marked bipolar or punctate distribution of fluorescence (sometimes both in the same cell). The same cells grown in Neidhardt liquid medium containing a non-PTS sugar [d-ribose (Fig. 1E)], a sugar alcohol with an absolute requirement for a functional PTS (d-mannitol), or a noncarbohydrate carbon source (dl-lactate) also displayed highly localized distributions of the fluorescence, but in these cases the FPs were primarily punctate. The images shown in Fig. 1 are typical of the three types of distributions regardless of growth conditions (e.g., agar vs. liquid culture), although there was considerable variation in cell size and diameter.
Fig. 1.

Subcellular distribution of FP under different growth conditions. Fluorescence micrographs of BL21-DE3-ΔEI cells harboring pRSETB-Y-EI plasmid grown on agar plates containing LB medium (A) or Neidhardt medium supplemented with 20 mM d-mannitol (B), 20 mM d-ribose (C), or 40 mM dl-lactate (D). (E and F) Cells in liquid culture. Shown are 20 mM d-ribose in Neidhardt medium (E) and control cells harboring pRSETB-YFP (no enzyme I) in LB broth in the presence of 0.5 mM IPTG (F). See Results.
Dense colonies of DH5α-ΔEI cells harboring Y-EI showed a similar bipolar distribution on LB plates (data not shown), indicating that this phenomenon occurs in strains derived from E. coli B, as well as in K strains.
It is, of course, well established that a colony of bacteria on an agar plate is exceedingly heterogeneous with respect to metabolism and other cell functions. A more thorough study was therefore required, and all remaining experiments were conducted in liquid culture (see Materials and Methods).
To determine the requirements for the subcellular distribution of the EI analogues in these cells, they were grown on a number of carbon sources in the synthetic medium. Briefly, 18 different carbon sources were screened, mostly sugars (PTS and non-PTS) but also l-aspartate, l-serine, and dl-lactate. The same phenomenon was observed in virtually every case: subcellular localization of the fluorescence. A few experiments in LB broth gave the same results.
Growth on d-Ribose-Limiting Synthetic Medium. For microbial physiological studies, we turned to the important and meticulous studies of Neidhardt et al. (12). These researchers developed a synthetic medium in which a number of components (Pi, N, Mg2+,  , or carbon source) could be used to limit growth in a highly predictable manner. With excess carbon source, for instance, this medium permits growth of E. coli to an OD420 of ≈7, at which point nitrogen becomes growth limiting.
The same carbon sources were tested as were used for the agar plate experiments shown in Fig. 1, i.e., ribose, mannitol, and lactate. Similar (albeit not identical) results were obtained with all three compounds, and the data obtained with ribose are shown in Fig. 2.
Fig. 2.

Growth of BL21-DE3-ΔE1 containing pRSETB-Y-EI in Neidhardt medium/ribose (1.89 mM). When cells reached stationary phase (at an OD420 of 1), more ribose (1.89 mM; indicated by left-most arrow) was added. This cycle was repeated twice. After the third addition, cells showed a punctate distribution (80% of the population) in stationary phase. When more ribose (10 mM) was added (right-most arrow), the population of punctate cells decreased progressively for 60–90 min, when ≈10% of cells were punctate and the remainder were diffuse.
As stated in ref. 12, when the inoculum was grown in the Neidhardt medium containing 20 mM ribose, diluted 1:100 in the same medium containing 1.89 mM ribose, the cells grew to an OD420 of ≈1.0 and entered stationary phase. Supplementing the medium containing the stationary-phase cells with another 1.89 mM ribose permitted growth to an OD420 of 1.5, i.e., another increase of 0.5 in the OD. These additions were performed a total of three times and were followed by adding 10 mM ribose, which resulted in a final (N-limiting) growth density of ≈4.5 OD420. In other words, the cells grew through five cycles, each consisting of an exponential growth phase followed by a stationary phase (Fig. 2).
Aliquots of the samples taken to determine cell number (OD420) were examined microscopically and photographed (Fig. 1E). In the first cycle, the FP distribution was diffuse in the exponential phase and largely (90–95%) diffuse in the stationary phase. This distribution did not change when these aliquots were maintained for at least 30 h (with no ribose added). In all of the remaining cycles, this same diffuse distribution of FP was observed during the exponential growth phases. However, changes became evident in the stationary phases. In the second cycle, a small percentage (10–15%) of the cells showed a punctate distribution of FP, and this percentage increased in every subsequent stationary phase. During the last cycles >90% of the cells showed the punctate distribution (Fig. 1E).
One concern with these experiments was the length of time required to complete the cycles (a total of >60 h), which conceivably could have a deleterious effect on the cells. However, a number of controls showed that the results are valid. For example, in single growth cycles (Fig. 3) where growth was limited by the quantity of ribose added to the medium initially, the same phenomenon was detected. It should be noted that punctation of FP was observed in the stationary phase but only at high cell density. In another type of control, to decrease the total time in the culture, cells were grown through only two cycles to an OD420 of ≈5.0 by using the requisite quantities of ribose. The predicted results were obtained: a diffuse FP distribution at low cell densities in the stationary phase and a punctate distribution at high cell densities (data not shown).
Fig. 3.

Growth curves of BL21-DE3-ΔE1 harboring pRSETB-Y-EI cells in Neidhardt medium at the indicated ribose concentrations. In stationary phases, the percentages of punctate cells were as follows: in 1.89 mM ribose, 5–10%; 3.78 mM, 15%; 5.67 mM, 30%; 7.56 mM, ≈35%; 30 mM, >80%. During the growth phases, no punctate cells were observed; only a diffuse distribution of fluorescence was seen.
Time Dependence of FP Localization and Delocalization. As the cells switched from exponential to stationary growth phases, the FP distribution switched from diffuse to punctate. In general, this effect was first observed ≈3–5 h after the cells entered the stationary phase, and the fraction of cells showing this distribution gradually increased for an additional 5–8 h, after which this fraction remained constant (observed for 30 h). It should be emphasized that these changes in distribution occurred over many minutes, and we did not observe sudden switches from diffuse to punctate distribution.
The switch from stationary to exponential growth triggered by adding 1.89 mM ribose reverted the fluorescence distribution from punctate to diffuse. To determine the “kinetics” of the process, after the last addition of ribose in Fig. 2, the cells were monitored every 10 min. The change to diffuse started ≈15 min after the addition of ribose and continued for another 60–90 min when the punctate distribution diminished (to ≤5%). In this context, it should be noted that the generation time for these cells on ribose is ≈110 min. In other words, the punctate-to-diffuse change in FP distribution may not require cell division.
Effects of Cell Density and Conditioned Medium on Y-EI Subcellular Localization. The results described above could be ascribed to a requirement for high cell density and/or some signaling compound(s) secreted into the medium by high-density cells (e.g., the quorum-sensing factors). To test these ideas, cells were grown in ribose medium to stationary phase at both low and high cell densities (OD420 = 1.0 and 4.5, respectively). The cells and supernatant fluids were separated, mixed again in eight different combinations, and observed microscopically (Table 1).
Table 1. Effects of cell density and conditioned medium on localization of Y-EI in E. coli BL21-DE3-ΔEI harboring the plasmid pRSETB-Y-EI.
| OD420
|
Punctate cells after incubation at 37°C, %
|
||||||
|---|---|---|---|---|---|---|---|
| Exp. | Cells | Supernatant | Mixture | 0 min | 30 min | 60 min | 150 min |
| I | 1 | 1 | 1.0 | 5 | — | — | — |
| II | 1 | 1 | 4.5 | 5 | 40 | 50 | 70 |
| III | 1 | 4.5 | 1.0 | 5 | — | — | 15-20 (4 h) |
| IV | 1 | 4.5 | 4.5 | 5 | — | 70 | — |
| V-VIII | 4.5 | 1 or 4.5 | 1.0 or 4.5 | 70-80 | — | — | — |
E. coli BL21-DE3-ΔEI harboring pRSETB-Y-EI was grown overnight in Neidhardt medium containing 20 mM ribose and inoculated at a dilution of 1:100 into two 25-ml culture flasks. One contained 4 ml of the same medium with 1.89 mM ribose (culture 1); the second contained 20 mM ribose (culture 2). Growth was followed as described in the text. At stationary phase, culture 1 exhibited an OD420 of 1.0, and culture 2 was at OD420 of 4.5. After 7 h in stationary phase, 4-ml samples of the cultures were centrifuged, and the cells were separated from the supernatants. This gave four fractions: cells 1 and supernatant 1 from culture 1 and cells 4.5 and supernatant 4.5 from culture 2. Microscopic examination showed that the fluorescence in cells 1 was 95% diffuse and ≈5% punctate; cells 4.5 were ≈70-80% punctate and ≈20% diffuse. The cells were not washed but were resuspended to an OD420 of 1.0 or 4.5 in supernatants 1 or 4.5 as specified. The suspension were shaken at 37°C, and aliquots were examined microscopically at the indicated times.
—, no change.
It is important to emphasize that no additional ribose or other carbon source was added to these mixtures; i.e., they remained in stationary phase.
The results of the experiments in Table 1 with cells showing primarily a diffuse FP distribution (harvested at an OD420 of 1.0) led to the following conclusions:
Experiments I and II show that a high cell density is required for the conversion from diffuse to punctate distribution. Cells harvested at an OD420 of 1 and resuspended in the same medium at an OD420 of 4.5 resulted in the punctate distribution starting at ≈30 min.
Conditioned medium isolated from cells grown to an OD420 of 4.5 produced a smaller but similar effect on cells grown to an OD420 of 1.0 (experiment III), and it took longer for this effect to be detected.
The most rapid and extensive conversion to the punctate distribution was observed when cells collected at an OD420 of 1 were suspended at high density in the conditioned medium (experiment IV).
Cells harvested at high density (labeled “Cells 4.5” in Table 1) showed an initial 70–80% punctate distribution, and this distribution did not change under any of the conditions tested (experiments V–VIII). Perhaps the most interesting result here was that dilution of the cells did not result in conversion to the diffuse phenotype. Only the addition of more ribose to the medium gave this result.
Localization of Y-EI in Actively Growing Cells and the Effect of IPTG. The results described thus far suggest that sequestration of EI occurs only in the stationary phase, perhaps as the result of a signal produced by cells at high density. However, this is not the case.
Expression of the gene encoding the Y-EI fusion was under control of the T7 promoter, which, in these cells, is under the classic lac repressor/promoter system and is derepressed by the gratuitous inducer IPTG. The plasmids used for these experiments were “leaky,” and significant fluorescence was observed without the addition of IPTG to cells growing in LB broth. In these cells, the FP distribution was entirely diffuse during exponential growth.
IPTG (0.5 mM) was added to the exponentially growing cells at OD420 readings ranging from 0.1 to 1.0, at each 0.1 increase in the OD. In every case, the FP became bipolar, as shown in Fig. 4A. The change in distribution was followed quantitatively, as shown in Fig. 5. In the experiment displayed in Fig. 5 Upper, the Y-EI cells were grown in LB medium until they had attained an OD420 of 1.0. At this point, fluorescence distribution was diffuse. The IPTG was added, and, after 30 min, a bipolar distribution was detected. After an additional 60 min, virtually all of the cells exhibited this distribution.
Fig. 4.
Fluorescence micrographs of BL21-DE3-ΔE1 cells containing either plasmid pRSETB-Y-EI (A) or pRSETB-Y-EI H189Q (B) in LB broth. The samples were taken 2 h after the addition of 0.5 mM IPTG. Virtually all cells expressing Y-EI (A) exhibited a polar distribution of the fluorescence, whereas all cells that expressed the H189Q mutant (B) displayed a diffuse distribution.
Fig. 5.

Growth curves of BL21-DE3-ΔE1 cells harboring either pRSETB-Y-EI (Upper) or pRSETB-Y-EI H189Q (Lower). The cells were grown in LB medium, and when the OD420 was 1.0 for each culture, IPTG (0.5 mM) was added as denoted by the arrows. Samples were removed at the indicated times to determine the OD420 (left ordinate, □, ▵) and the percentage of cells that exhibited a bipolar distribution of fluorescence (right ordinate, ▪, ▴). Although ≈99% of Y-EI-containing cells showed a polar distribution at 2 h after addition of IPTG, essentially all H189Q-containing cells showed a diffuse distribution.
An important control is shown in Fig. 4B and Fig. 5 Lower. The identical experiment was conducted with a nonphosphorylatable mutant of Y-EI, namely H189Q-Y-EI (13), in which the active-site His residue of EI was replaced by Gln. The mutant grew at the same rate as Y-EI and displayed diffuse fluorescence. The mutant also responded to IPTG with respect to expression of the fusion protein. However, in sharp contrast to the results with Y-EI, the H189Q mutant showed no change in distribution after the addition of IPTG; i.e., the fluorescence remained diffuse. This result is further discussed below.
Controls. A number of control experiments were performed and will be described elsewhere in detail. The results can be summarized as follows:
One possible explanation for the localization of EI was that the proteins formed inclusion bodies when overexpressed. This was not the case. They were soluble and readily purified and exhibited the predicted properties for such fusions, including absorption and emission spectra, the expected migration rates on SDS/PAGE, and enzymatic activities (≥90% of the specific activity of the wild-type EI). Also, the FP can complement the EI deletion in vivo and restore growth on PTS sugars of the EI deletion mutant.
Localization of the fluorescent protein was not a function of the YFP and CFP prosthetic groups. That is, cells transformed with plasmids that expressed only unlinked YFP and CFP showed a diffuse fluorescence phenotype under all conditions of growth (Fig. 1F).
All available evidence indicates that Y-EI is not truncated when it is localized in the cell. Further experiments are needed to firmly establish this important point.
The localization phenomena are not ascribed to the expression of excessive quantities of EI. The quantity of EI expressed by wild-type E. coli cells varies (14) from 1.3 to 1.8 μg of EI per mg of protein, depending on growth conditions; the highest yields are obtained from cells grown on glucose. In the experiments described above, Y-EI was expressed at ≈2–5 times wild-type levels. This level is somewhat higher than normal, but below this level, the fluorescence signal was very low. It should be noted that much higher quantities of EI can be expressed by whole cells with no apparent deleterious effect, for instance, on glucose transport (15).
Localization of EI is not related to the T7 polymerase. The gene encoding the fusion protein Y-EI was placed under control of the lac promoter (no T7) and used to transform BL21-DE3-ΔEI and DH5α-ΔEI mutant. Both showed polar localization of the fluorescence when grown in LB to which IPTG was added.
Discussion
Prokaryotic cells form specialized structures (such as stalks in Caulobacter and spores in Bacillus subtilis), segregate their chromosomes, and regulate the position of septa formation. These and other structural phenomena have led to an increased appreciation of the subcellular complexity and organization of bacterial cells (16–20). It should be emphasized that the asymmetric distribution of E. coli proteins does not necessarily involve those proteins that play a role in determining a structural element or shape of the cell or in cell division. For instance, the methylating chemotaxis receptor proteins tend to segregate within the membrane, although the physiological function of this phenomenon is not known (21). Virtually all of the proteins involved in these events, including the Min proteins that determine the proper placement of the septum in E. coli (19), are membrane-associated. Additional accessory proteins are also often required, such as actin-like proteins MreB and Mbl, FtsZ (a cytosolic tubulin homologue), and undoubtedly others (22). Remarkably, the time scales for sequestration of the proteins involved in these assorted phenomena range from seconds for the Min proteins in E. coli (19) to hours for the signaling proteins that control the cell cycle in Caulobacter (23). Unlike the results reported here for EI, sequestration of these proteins (none of which are catabolic enzymes) is apparently independent of the growth conditions, stationary phase, or cell density.
EI has always been regarded as a freely diffusible cytoplasmic protein; it is routinely isolated from soluble fractions. Here we report that EI is sequestered under certain conditions and that this effect can result in a punctate and/or polar distribution.
Virtually all samples of cells from large colonies grown on agar plates showed the punctate distribution, bipolar distribution, or both. Samples from isolated colonies typically displayed a mixed population, with both diffuse and localized distributions. Eighteen compounds were tested as carbon sources in liquid culture, and essentially all showed the same distribution as on agar plates. To quantitatively analyze this phenomenon, we used three carbon-limiting compounds in the Neidhardt medium (12), mannitol (PTS sugar), d-ribose (non-PTS sugar), and dl-lactate, as sources of carbon. In each case, the cells showed a diffuse distribution of Y-EI during the growth phase and a punctate distribution in the stationary phase, which reverted back to diffuse when growth was initiated again by adding more of the carbon source. Sequestration was cell-density-dependent and was maximal at high cell density in conditioned medium in the stationary phase.
The sequestration phenomenon is even more complex. Early in the cell cycles of Fig. 2, only a fraction of the total population exhibited localization. The process occurred over a period of 3–5 h in the stationary phase, after which the fraction of the population that displayed this effect remained constant. Why? Perhaps the key is the degree of EI phosphorylation in individual cells, which could easily vary from one to another. The stationary phase of growth of bacteria is extraordinarily complex and involves many hundreds of genes (24). Under these conditions, one can hardly expect the cell population to be uniform and synchronized with respect to EI phosphorylation. Furthermore, because the localization phenomenon occurs over a period of hours, it may require some additional factors in the medium that are both unstable (e.g., the quorum-sensing signal homoserine lactone) and not necessarily produced at a constant rate.
The sequestration of Y-EI is not limited to stationary-phase cells. Figs. 4A and 5 show the results with cells in exponential phase in LB broth. In this case, the fluorescence was diffuse, but when IPTG was added to the medium the fluorescence became bipolar, starting ≈15 min after the addition of IPTG and continuing for an additional 1.5 h, at which time virtually all of the cells showed this distribution. The figures also show that no such effect was observed with H189Q-Y-EI, a nonphosphorylatable mutant of EI (13).
In this case at least, phospho-Y-EI is sequestered in actively growing cells that have been induced by IPTG, whereas nonphosphorylatable Y-EI remains in the diffuse orientation. This result probably cannot be generalized, because a few preliminary experiments suggest that H189Q-Y-EI behaves similarly to Y-EI under other conditions. We do not yet understand how or why IPTG induces this effect, but some speculation is offered below.
Whether it is solely phospho-EI or EI or both that are localized, there are two overriding questions that must be answered:
Are other PTS proteins (or any other proteins) required for the localization phenomena? Special attention will be given to the sugar-specific, membrane-bound enzymes II. If these integral membrane proteins are involved, does this mean that the PTS operates in sugar uptake as an undissociated complex of all of the PTS proteins rather than as has always been visualized, in a stepwise series of bimolecular phosphotransfer reactions (15)? An obvious extension of the present results is to test other fluorescent labeled PTS proteins.
What is the function of EI sequestration? We do not know, but perhaps a clue can be derived from the relatively rapid IPTG-induced bipolar sequestration of Y-EI in growing cells. IPTG induces gene expression and requires increased activity of adenylate cyclase. The latter is a membrane enzyme and is regulated by the PTS, although it is not clear precisely how this regulation occurs (there have been conflicting reports on which of the PTS proteins is involved in this regulatory phenomenon). Does sequestration result from the binding of phospho-EI (but not EI) to adenylate cyclase, perhaps with other PTS proteins? One important series of experiments to answer this question will be to assay for EI localization in cells induced for the expression of different operons, some that require and some that do not require increased activity of adenylate cyclase.
The results reported here should, we believe, lead to a new understanding of how EI functions (directly or indirectly) in its diverse physiological roles, including sugar transport and catabolism, chemotaxis, gene regulation, and diauxic growth.
Acknowledgments
The fluorescence microscopy could not have been performed without the expertise, assistance, and special equipment provided by J. Michael McCaffery, Gerry Sexton, and Michelle Husain of the Integrated Imaging Center, Department of Biology, The Johns Hopkins University. We also thank Drs. Norman Meadow, Ludwig Brand, and Dmitri Toptygin (The Johns Hopkins University) for valuable suggestions. This work was supported by National Institutes of Health Grant GM38759 and a grant from New England Biolabs generously made available by Dr. Donald Comb.
Author contributions: H.V.P., K.A.V., and S.R. designed research; H.V.P. and K.A.V. performed research; X.L. and R.S. contributed new reagents/analytic tools; H.V.P., K.A.V., and S.R. analyzed data; and H.V.P., K.A.V., and S.R. wrote the paper.
Abbreviations: FP, fluorescent protein; CFP, cyan FP; PTS, phosphoenolpyruvate:phosphotransferase system; EI, enzyme I of the PTS; IPTG, isopropyl β-d-thiogalactopyranoside; YFP, enhanced yellow FP; Y-EI, fusion of YFP and EI at the N terminus of EI.
References
- 1.Meadow, N. D., Fox, D. K. & Roseman, S. (1990) Annu. Rev. Biochem. 59, 497–542. [DOI] [PubMed] [Google Scholar]
- 2.Roseman, S. & Meadow, N. D. (1990) J. Biol. Chem. 265, 2993–2996. [PubMed] [Google Scholar]
- 3.Postma, P. W., Lengeler, J. W. & Jacobson, G. R. (1993) Microbiol. Rev. 57, 543–594. [DOI] [PMC free article] [PubMed] [Google Scholar]
- 4.Saier, M. H. & Reizer, J. (1992) J. Bacteriol. 174, 1433–1438. [DOI] [PMC free article] [PubMed] [Google Scholar]
- 5.Saier, M. H. & Reizer, J. (1994) Mol. Microbiol. 13, 755–764. [DOI] [PubMed] [Google Scholar]
- 6.Chauvin, F., Brand, L. & Roseman, S. (1996) Res. Microbiol. 147, 471–479. [DOI] [PubMed] [Google Scholar]
- 7.Ginsburg, A. & Peterkofsky, A. (2002) Arch. Biochem. Biophys. 397, 273–278. [DOI] [PubMed] [Google Scholar]
- 8.Tsien, R. Y. (1998) Annu. Rev. Biochem. 67, 509–544. [DOI] [PubMed] [Google Scholar]
- 9.Ausubel, F. M., Brent, R., Kingston, R. E., Moore, D. D., Seidman, J. G., Smith, J. A. & Struhl, K. (1996) Current Protocols in Molecular Biology (Wiley, New York), Vols. 1–3.
- 10.Saffen, D. W., Presper, K. A., Doering, T. & Roseman, S. (1987) J. Biol. Chem. 262, 16241–16253. [PubMed] [Google Scholar]
- 11.Waygood, E. B., Meadow, N. D. & Roseman, S. (1979) Anal. Biochem. 95, 293–304. [DOI] [PubMed] [Google Scholar]
- 12.Neidhardt, F. C., Block, P. L. & Smith, D. F. (1974) J. Bacteriol. 119, 736–747. [DOI] [PMC free article] [PubMed] [Google Scholar]
- 13.Napper, S., Brokx, S. J., Pally, E., Kindrachuk, J., Delbaere, L. T. J. & Waygood, E. B. (2001) J. Biol. Chem. 276, 41588–41593. [DOI] [PubMed] [Google Scholar]
- 14.van der Vlag, J., van't Hof, R., van Dam, K. & Postma, P. W. (1995) Eur. J. Biochem. 230, 170–182. [DOI] [PubMed] [Google Scholar]
- 15.Rohwer, J. M., Meadow, N. D., Roseman, S., Westerhoff, H. V. & Postma, P. W. (2000) J. Biol. Chem. 275, 34909–34921. [DOI] [PubMed] [Google Scholar]
- 16.Ryan, K. R. & Shapiro, L. (2003) Annu. Rev. Biochem. 72, 367–394. [DOI] [PubMed] [Google Scholar]
- 17.Shapiro, L. & Losick, R. (2000) Cell 100, 89–98. [DOI] [PubMed] [Google Scholar]
- 18.Van Ooij, C., Eichenberger, P. & Losick, R. (2004) J. Bacteriol. 186, 4441–4448. [DOI] [PMC free article] [PubMed] [Google Scholar]
- 19.Shih, Y. L., Le, T. & Rothfield, L. (2003) Proc. Natl. Acad. Sci. USA 100, 7865–7870. [DOI] [PMC free article] [PubMed] [Google Scholar]
- 20.Ben Yehuda, S., Rudner, D. Z. & Losick, R. (2003) Science 299, 532–536. [DOI] [PubMed] [Google Scholar]
- 21.Falke, J. J. & Hazelbauer, G. L. (2001) Trends Biochem. Sci. 26, 257–265. [DOI] [PMC free article] [PubMed] [Google Scholar]
- 22.Carballido-Lopez, R. & Errington, J. (2003) Trends Cell Biol. 13, 577–583. [DOI] [PubMed] [Google Scholar]
- 23.Lam, H., Matroule, J. Y. & Jacobs-Wagner, C. (2003) Dev. Cell 5, 149–159. [DOI] [PubMed] [Google Scholar]
- 24.Neidhardt, F. C. & VanBogelen, R. A. (2000) in Bacterial Stress Responses, eds. Storz, G. & Hengge-Aronis, R. (Am. Soc. Microbiol., Washington, DC), pp. 445–452.