Abstract
It is well-known that policosanol can improve serum lipid profiles, although the physiological mechanism is still unknown. Here, we investigated functional and structural changes in lipoproteins after consumption of policosanol. To investigate the physiological effect of policosanol, we analyzed serum parameters in young non-smoker (YN; n=7, 24.0±2.4 years), young smoker (YS; n=7, 26.3±1.5 years), and middle-aged subjects (MN; n=11, 52.5±9.8 years) who consumed policosanol daily (10 mg/day) for 8 weeks. After 8 weeks, systolic blood pressure was significantly lowered to 4% (7 mmHg, p=0.022) from initial levels in the YS and MN groups. Moisture content of facial skin increased up to 38 and 18% from initial levels in the YS and MN groups, respectively. Serum triglyceride (TG) levels decreased to 28 and 26% from initial levels in the YN and MN groups, respectively. The percentage of high-density lipoprotein-cholesterol (HDL-C) in total cholesterol was elevated in all subjects (YN, 36%; YS, 35%; MN, 8%) after 8 weeks of policosanol consumption. All groups showed a reduction in serum glucose and uric acid levels. Serum cholesteryl ester transfer protein (CETP) activity was significantly diminished up to 21 and 32% from initial levels in the YN and MN groups, respectively. After 8 weeks, oxidation of the low-density lipoprotein fraction was markedly reduced accompanied by decreased apolipoprotein B (apoB) fragmentation. In the HDL fraction, paraoxonase activity was elevated by 17% along with elevation of apoA-I and cholesterol contents. Electron microscopy revealed that the size and number of HDL particles increased after 8 weeks, and the YS group showed a 2-fold increase in particle size. Daily consumption of policosanol for 8 weeks resulted in lowered blood pressure, reduced serum TG level and CETP activity, and elevated HDL-C contents. These functional enhancements of HDL can prevent and/or attenuate aging-related diseases, hypertension, diabetes and coronary heart disease.
Keywords: policosanol, high-density lipoprotein, functionality, blood pressure, apoA-I, cholesteryl ester transfer protein
Introduction
Many studies on animals and humans have reported that policosanol consumption can improve serum lipid profiles by increasing high-density lipoprotein (HDL)-cholesterol (HDL-C) and by decreasing low-density lipoprotein (LDL)-C contents (1,2). Although its exact mechanism has not been clearly identified, an American group proposed that the action of policosanol involves multiple pathways, including elevation of hepatic Acyl-CoA and AMP levels to activate AMP kinase and inactivate HMG-CoA reductase (3). On the other hand, several studies on familial hypercholesterolemic patients detected no significant effect of policosanol on serum lipid levels in middle-aged patients (4,5). Policosanol consumption is known to improve the lipid profile and inhibit LDL oxidation. Recently, a Chinese group reported that a combination of policosanol and atorvastatin in patients with atherosclerosis was able to attenuate statin-induced elevation of serum PCSK9 levels (6) accompanied by reduced serum total cholesterol (TC) and triglyceride (TG) contents, indicating a putative effect of policosanol on lipid composition. Despite numerous controversies, however, previous studies have focused on changes in serum lipid levels, not lipoprotein properties. On the other hand, a Cuban group reported that policosanol supplementation to healthy volunteers decreased LDL oxidation and serum TG levels, whereas TC and HDL-C contents were unchanged (7).
To date, no study has evaluated changes in HDL and LDL compositions and functionality in terms of antioxidant, anti-glycation, and anti-aging activities after consumption of policosanol. Since LDL oxidation is directly related to atherogenic properties, apolipoprotein B (apoB) and lipid compositions can be evaluated as a measure of oxidation extent. Oxidative susceptibility is highly dependent on HDL3-associated paraoxonase (8) and apoA-I contents of HDL (9). Higher cholesteryl ester transfer protein (CETP) activity in HDL is inversely correlated with beneficial functionality as well as atherogenic composition (10).
In a previous study, encapsulation of policosanol into HDL was shown to enhance HDL functions and exert anti-senescence and tissue regeneration effects via improvement of anti-glycation, anti-apoptosis and CETP inhibition (11). Policosanol alone or in combination with HDL (PCO-rHDL) has been shown to potently inhibit human serum CETP activity (12). PCO-rHDL was also shown to facilitate greater cell growth and replication with less apoptosis in BV-2 microglial cells. Policosanol supplementation for 9 weeks in zebrafish showed serum lipid-lowering and HDL-C-elevating effects via CETP inhibition along with amelioration of fatty liver changes.
The present study was designed to investigate the physiological effects of policosanol consumption for 8 weeks on the quality of lipoproteins in young and middle-aged subjects in a human study. We compared the functionality of lipoproteins and expression levels of apolipoproteins as well as changes in body fat, blood pressure and serum lipid profiles.
Materials and methods
Commercially available policosanol tablets (10 mg/each) were obtained from Rainbow and Nature Pty, Ltd. (Thornleigh, NSW, Australia). Policosanol (sugar cane wax alcohol) contains several alcohol chains of various length, including 1-tetracosanol (0.1–20.0), 1-heptacosanol (1.0–30.0), 1-nonacosanol (1.0–20.0), 1-dotriacontanol (50.0–100.0), 1-hexacosanol (30.0–100.0), 1-octacosanol (600.0–700.0), 1-triacontanol (100.0–150.0) and 1-tetratriacontanol (1.0–50.0).
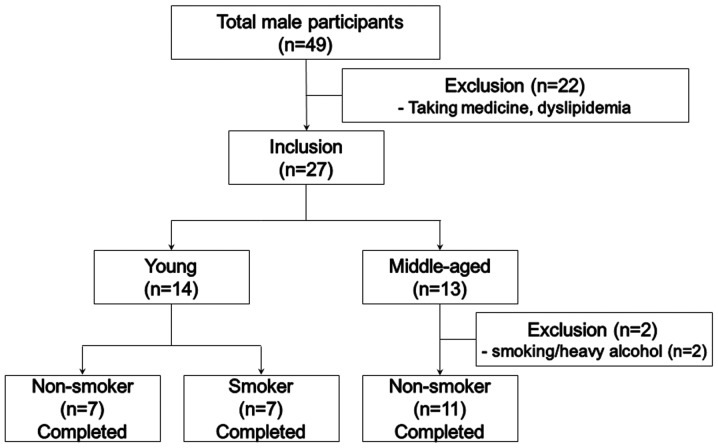
We recruited healthy male volunteers who consumed policosanol for 8 weeks, as shown in the study design (Fig. 1). We analyzed serum parameters from young non-smoker (YN; n=7, 24.0±2.4 years), young smoker (YS; n=7, 26.3±1.5 years) and middle-aged non-smoker subjects (MN; n=11, 52.5±9.8 years) who consumed policosanol daily (10 mg/day for young subjects) for 8 weeks. Heavy alcohol consumers (>30 g EtOH/day) and those who had consumed any prescribed drugs to treat hyperlipidemia, diabetes mellitus or hypertension were excluded. All subjects had unremarkable medical records without illicit drug use or past history of systemic diseases. Informed consent was obtained from all patients and subjects prior to enrollment in this study, and the Institutional Review Board at Yeungnam University (Gyeongsan, Korea) approved the protocol (IRB; no. 7002016-A-2015-003).
Figure 1.
Design of the study and subjects. Inclusion criteria were normolipidemic, normoglycemic and healthy subjects. Exclusion criteria were heavy alcohol drinkers (>30 g EtOH/day), patients with endocrinological disorders, and those taking hyperlipidemic medicine.
Anthropometric analysis
Blood pressure was measured each morning at 2-week intervals by an Omron HEM-1000 (Omron Co., Ltd., Kyoto, Japan). Height, body weight, body mass index (BMI), total body fat (%), total body fat mass (kg), and visceral fat mass (kg) were measured individually at the same time of day at 2-week intervals using an X-scan Plus II body composition analyzer (Jawon Medical Co., Ltd., Gyeongsan-si, Korea).
Measurement of facial skin melanin content
During policosanol supplementation, the facial skin conditions of all participants were measured every week using a Multi Probe Adapter system (MPA5; Courage and Khazaka Electronic GmbH, Cologne, Germany). Probes for facial melanin and erythema were measured using a Mexameter (MX18; Courage and Khazaka Electronic GmbH). Moisture and sebum in facial skin were measured by a Corneometer (CM825) and Sebumeter (SM815), respectively, provided by Courage and Khazaka Electronic GmbH. To minimize bias, we performed measurements on the cheekbone at the same position three times and averaged the data from subjects at the same room temperature and humidity.
Plasma analysis
Blood was obtained following overnight fasting from all subjects. Blood was collected using a vacutainer (BD Biosciences, Franklin Lakes, NJ, USA) containing EDTA (final concentration, 1 mM) at 0 and 8 weeks during intake of policosanol. Plasma was isolated by low-speed centrifugation (3,000 rpm) and stored at −80°C until analysis. To analyze plasma, TC, TG, HDL-C, glucose, aspartate aminotransferase (AST) and alanine aminotransferase (ALT) levels were measured using commercially available kits (Cleantech TS-S; Wako Pure Chemical, Osaka, Japan).
Ferric reducing ability of plasma (FRAP) assay
FRAP was determined using the method described by Benzie and Strain (13) with a slight modification, as described recently by our research group (14). The antioxidant activities of individual HDL fractions (20 µg each in PBS) were then estimated by measuring the increase in absorbance induced by generated ferrous ions.
Characterization of lipoproteins
Very low-density lipoprotein (VLDL; d < 1.019 g/ml), LDL (1.019 < d < 1.063), HDL2 (1.063 < d < 1.125), and HDL3 (1.125 < d < 1.225) were isolated from pooled plasma of each group via sequential ultracentrifugation (15), and the density was adjusted by addition of NaCl and NaBr in accordance with standard protocols. Samples were centrifuged for 22 h at 10°C and 100,000 × g using a himac CP100WX (Hitachi, Tokyo, Japan) at the Instrumental Analysis Center of Yeungnam University. To analyze lipoproteins, TC and TG levels were measured using commercially available kits (Cleantech TS-S; Wako Pure Chemical). Protein concentrations of lipoproteins were determined via Lowry protein assay, as modified by Markwell et al (16). Expression levels of apoA-I (28 kDa) and apoB (550 kDa) were determined by sodium dodecyl sulfate-polyacrylamide gel electrophoresis (SDS-PAGE).
To assess the degree of lipoprotein oxidation, the concentration of oxidized species in lipoproteins was determined by the thiobarbituric acid reactive substance (TBARS) assay method using malondialdehyde as a standard (17). To compare the extent of glycation between groups, advanced glycation end products (AGEs) in lipoproteins were determined by reading fluorometric intensities at 370 nm (excitation) and 440 nm (emission), as previously described (18), using a spectrofluorometer LS55 (Perkin-Elmer, Shelton, CT, USA) with the WinLab software package (version 4.0).
Electrophoretic analysis
Compositions of apolipoprotein-B were compared via SDS-PAGE with identical protein loading quantities (3 µg of total protein per lane) from individual LDL. Relative band size was compared via band scanning with Chemi-Doc® XRS+ (Bio-Rad Laboratories, Inc., Hercules, CA, USA) using Image Lab software (Version 5.2) after visualization with Coomassie Blue staining.
CETP assay
rHDL-containing apoA-I and cholesteryl oleate were synthesized in accordance with the method described by Cho (19) and Cho et al (20) using trace amounts of [3H]-cholesteryl oleate (TRK886, 3.5 µCi/mg of apoA-I; GE Healthcare Life Sciences, Logan, UT, USA). The rHDL was immobilized using CNBr-activated Sepharose 4B resin (Amersham Biosciences, Buckinghamshire, UK) for easy separation after the reaction, in accordance with the manufacturer's instructions. CE transfer reaction was performed in 300-µl reaction mixtures containing human serum (20 µl) or HDL3 (20 µl, 2 mg/ml) as a CETP source, [3H]-rHDL-agarose (20 µl, 0.25 mg/ml) as a CE-donor, and human LDL (20 µl, 0.25 mg/ml) as a CE-acceptor. After incubation at 37°C, the reaction was halted via brief centrifugation (10,000 × g) for 3 min at 4°C. Supernatant containing the CE-acceptor (150 µl) was then subjected to scintillation counting, and the percentage of transfer of [3H]-CE from [3H]-rHDL to LDL was calculated.
Paraoxonase assay
Paraoxonase 1 (PON1) activity was then determined by measuring the initial velocity of p-nitrophenol production at 37°C, as determined by measuring the absorbance at 405 nm (Bio-Rad microplate reader, model 680; Bio-Rad Laboratories, Inc.), as previously described (21) with slight modification (22). Prior to the measurement, HDL was extensively dialyzed against phos phate-buffered saline (PBS) to remove EDTA.
Cell culture
THP-1, a human monocytic cell line, was obtained from the American Type Culture Collection (no. TIB-202™; ATCC, Manassas, VA, USA) and maintained in RPMI-1640 medium (Hyclone, Logan, UT, USA) supplemented with 10% fetal bovine serum (FBS) until needed. Cells that had undergone no more than 20 passages were incubated in medium containing phorbol 12-myristate 13-acetate (PMA; 150 nM) in 24-well plates for 48 h at 37°C in a humidified incubator (5% CO2, 95% air) in order to induce differentiation into macrophages. Differentiated and adherent macrophages were then rinsed with warm PBS, followed by incubation with 450 µl of fresh RPMI-1640 medium containing 0.1% FBS and 50 µg of each LDL (1 mg of protein/ml in PBS) for 48 h at 37°C in a humidified incubator. After incubation, the cells were washed with PBS three times and then fixed in 4% paraformaldehyde for 10 min. Next, the fixed cells were stained with Oil red O staining solution (0.67%) and washed with distilled water. THP-1 macrophage-derived foam cells were then observed and photographed using a Nikon Eclipse TE2000 microscope (Nikon, Tokyo, Japan) at ×400 magnification as described in our previous study (23).
LDL oxidation
Oxidized LDL (oxLDL) was produced by incubation of the LDL fraction with CuSO4 (final concentration, 10 µM) for 4 h at 37°C. oxLDL was then filtered through a 0.22-µm filter (Millex; Millipore, Bedford, MA, USA) and analyzed by TBARS assay to determine the extent of oxidation as previously described (17).
Anti-atherosclerotic assay
Differentiated and adherent macrophages were then rinsed with warm PBS and incubated with 400 µl of fresh RPMI-1640 medium containing 0.1% FBS, 50 µg of oxLDL (1 mg of protein/ml in PBS), and 30 µg each of HDL2 (1 mg of protein/ml in PBS) or HDL3 (2 mg of protein/ml in PBS) for 48 h at 37°C in a humidified incubator. After incubation, the cells were stained with Oil red O solution (0.67%) to visualize the amount of lipid species in the cells. THP-1 macrophage-derived foam cells were then observed and photographed using a Nikon Eclipse TE2000 microscope (Nikon) at ×400 magnification. Quantification of the Oil red O-stained area was carried out via computer-assisted morphometry using Image-Pro Plus software (version 4.5.1.22; Media Cybernetics, Bethesda, MD, USA).
Electron microscopy
Transmission electron microscopy (TEM) was performed with a Hitachi electron microscope (model H-7600; Hitachi High-Technologies Corporation, Ibaraki, Japan) operated at 80 kV as in our previous study (24). VLDL, LDL and HDL were negatively stained with 1% sodium phosphotungastate (pH 7.4) with a final apolipoprotein concentration of 0.3 mg/ml in TBS.
Statistical analysis
All data are expressed as the mean ± SD from at least three independent experiments with duplicate samples. Data comparisons were assessed by Student's t-test using the SPSS program (version 14.0; SPSS, Inc., Chicago, IL, USA). In the human study, data in the same group were evaluated via one-way analysis of variance (ANOVA) using SPSS version 14.0, and differences between the means were assessed using Duncan's multiple range test. Statistical significance was defined as p<0.05.
Results
Changes in blood pressure and visceral fat
After 8 weeks of policosanol consumption, as shown in Table I, the MN group showed significant reduction in systolic blood pressure (~7 mmHg compared to week 0, p=0.022), whereas the YN group did not show change in blood pressure. At week 8, the YS group showed 5 mmHg lower systolic blood pressure than at week 0. All groups showed reduction in diastolic blood pressure, although there was no statistically significant change.
Table I.
Anthropometric analysis and serum profile at 8 weeks following supplementation of policosanol.
| Parameters | YN (n=7)
|
YS (n=7)
|
MN (n=11)
|
|||
|---|---|---|---|---|---|---|
| 0 week | 8 weeks | 0 week | 8 weeks | 0 week | 8 weeks | |
| Age (years) | 24.0±2.4 | 26.3±1.5 | 52.5±9.8 | |||
| BMI (kg/m2) | 23.7±3.1 | 22.2±1.6 | 23.5±1.9 | 23.8±2.0 | 24.7±2.4 | 24.5±2.4 |
| Body fat | ||||||
| Body fat (%) | 16.4±3.2 | 15.6±2.0 | 22.4±3.8 | 21.4±4.3 | 22.4±2.9 | 21.4±3.2 |
| Fat mass (kg) | 15.0±7.9 | 10.7±2.4 | 15.0±3.6 | 14.5±4.0 | 16.9±4.0 | 16.0±3.8 |
| Visceral fat mass (kg) | 1.3±0.5 | 1.3±0.3 | 2.0±0.7 | 1.5±0.8a | 2.4±0.7 | 2.2±0.7 |
| BP | ||||||
| Systolic (mmHg) | 134±13 | 131±10 | 133±14 | 128±12a | 134±10 | 127±5b |
| Diastolic (mmHg) | 75±10 | 72±9 | 75±8 | 69±4 | 83±11 | 78±9 |
| Facial skin content | ||||||
| Melanin (AU) | 169±40 | 161±29 | 175±29 | 163±33 | 185±52 | 181±27 |
| Moisture (AU) | 61±12 | 67±10 | 56±11 | 78±15b | 62±12 | 73±8a |
| Serum | ||||||
| TC (mg/dl) | 176±33 | 174±24 | 161±26 | 156±29 | 216±41 | 206±44 |
| TG (mg/dl) | 61±22 | 57±20 | 78±30 | 72±23 | 177±140 | 144±85 |
| HDL-C (mg/dl) | 48±18 | 65±10a | 51±19 | 67±23 | 48±9 | 51±9 |
| HDL-C (%) | 28±13 | 38±7a | 31±9 | 42±7 | 23±8 | 26±7 |
| CETP activity (CE-transfer, %) | 38±9 | 32±5a | 38±5 | 29±5a | 42 ± 5 | 32±2c |
| Uric acid (mg/dl) | 6.7±1.4 | 6.5±2.4 | 9.2±0.8 | 9.3±1.2 | 8.6±0.8 | 7.3±1.2a |
| Glucose (mg/dl) | 85±7 | 78±6 | 78±5 | 69±9 | 88±12 | 83±10 |
YN, young non-smoker; YS, young smoker; MN, middle-aged non-smoker; BMI, body mass index; BP, blood pressure; AU, arbitrary units; TC, total cholesterol; TG, triglyceride; HDL-C, high-density lipoprotein-cholesterol; CETP, cholesteryl ester transfer protein.
p<0.05;
p<0.01;
p<0.001 vs. 0–8 weeks in each subjects.
At week 8, the total percentage of body fat was reduced in all groups, as shown in Table I. The YN group showed a 30% reduction in fat mass (kg). Although the YN and YS groups showed similar levels of fat mass at week 0, the YS group showed a 1.5-fold higher visceral fat mass than the YN group at week 0. However, after 8 weeks of policosanol consumption, visceral fat mass was reduced by 25% in the YS group. The MN group also showed 6 and 9% reduced total fat mass and visceral fat mass, respectively, at week 8 compared with week 0. Generally, policosanol consumption reduced blood pressure, body fat percentage, and visceral fat mass, especially in the YS and MN groups.
In facial skin, young subjects showed reduced melanin content, although there was no significant difference, whereas the MN group showed no change. However, moisture content was significantly elevated at week 8 (Table I) in the YS and MN groups (1.4- and 1.2-fold, respectively), higher than these values at week 0 (p=0.03 and p=0.013, respectively).
Changes in serum antioxidant ability
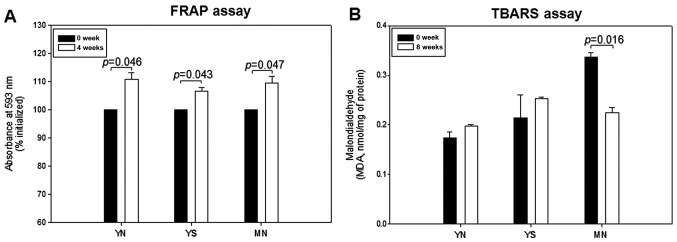
All groups showed a notable increase in ferric ion reduction ability of up to 10% at week 8 compared to week 0, as shown in Fig. 2A. At week 0, the MN group showed the highest serum MDA level (2-fold higher than the YN group). The YS group showed a higher serum MDA level than the YN group, suggesting that smoking can contribute to elevation of oxidized species in serum. The MN group showed a 35% lower serum MDA level at week 8 than at week 0, whereas the YN and YS groups did not show any marked reduction (Fig. 2B).
Figure 2.
Changes in antioxidant ability and extent of oxidized species in serum upon policosanol consumption. (A) Ferric ion reduction ability of serum (0.05 ml) as determined in the ferric reducing antioxidant power (FRAP) assay. (B) Determination of oxidized species in serum (0.1 ml) using the thiobarbituric acid reactive substances (TBARS) assay.
Among all groups, the YS group showed 1.4- and 1.1-fold higher serum uric acid levels than the YN and MN groups, respectively, as shown in Table I. After 8 weeks of consumption, the MN group showed a significant reduction in uric acid up to 16% compared to week 0 (p=0.004).
Changes in serum lipid profiles
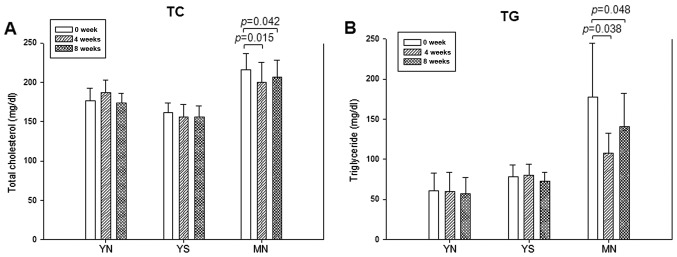
Although the YN and YS groups did not show notable reduction in TC at 4 and 8 weeks, the MN group showed 8 and 6% reductions of TC at 4 and 8 weeks, respectively, as shown in Fig. 3A. Although the result was not significant, the YN and YS groups showed a gradual reduction in serum TG after 8 weeks, whereas the MN group showed 40 and 21% reductions at 4 and 8 weeks, respectively, compared to week 0 (Fig. 3B).
Figure 3.
Serum lipid levels at 0, 4 and 8 weeks after policosanol consumption. (A) Serum cholesterol (TC) and (B) triglyceride (TG) concentrations.
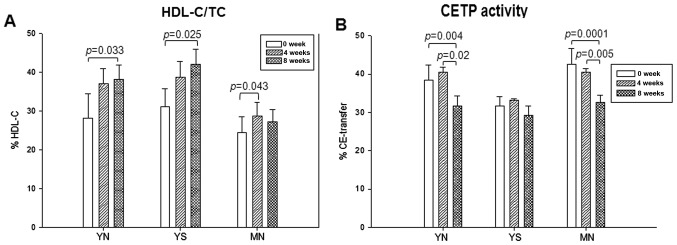
As shown in Table I, the serum HDL-C level increased especially in young subjects. The YN and YS groups showed 1.4- and 1.3-fold increases in serum HDL-C, respectively, whereas the MN group did not show any change after 8 weeks. However, as shown in Fig. 4A, the MN group showed a significant elevation in HDL-C content at week 4 (28%) compared to week 0 (24%). The YN and YS groups also showed gradual elevation of HDL-C (38 and 42%, respectively) by week 8 from 28 and 31% at week 0. This result suggests that elevation of HDL-C level by policosanol consumption was more efficient in young subjects compared to middle-aged ones. Although the MN group showed a slight increase in HDL-C level (mg/dl) by week 8 (Table I), all groups showed a distinct increase in HDL-C content in TC (mg/dl), as shown in Fig. 4A. The percentage of HDL-C consistently increased in the YN and YS groups at weeks 4 and 8, whereas the MN group showed significant elevation of HDL-C content at week 4 (Fig. 4A).
Figure 4.
(A) Percentage of high-density lipoprotein-cholesterol (HDL-C)/total cholesterol (TC). (B) Serum cholesteryl ester transfer protein (CETP) activity at 0, 4 and 8 weeks after policosanol consumption.
Serum CE-transfer activity was significantly reduced in the YN and MN groups at week 8 (20% in YN group and 25% in MN group) compared to week 0 (Table I and Fig. 4B). Although all groups showed no notable changes in CETP activity at week 4, the YN and MS groups showed distinct reduction in CETP activity at week 8 (Fig. 4B).
Changes in oxidation extent of LDL
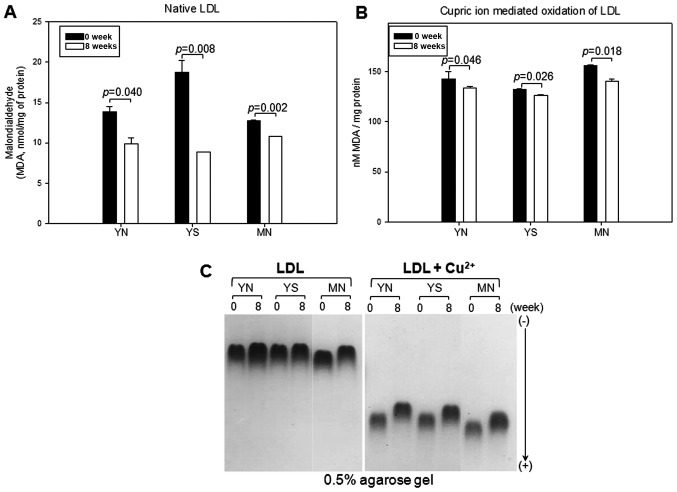
In the native state, all groups showed significant reduction in oxidized species content at week 8, as shown in Fig. 5A. The YN, YS and MN groups showed 29, 53 and 16% reductions in the MDA level, respectively, at week 8 compared to week 0 in the native state, without cupric ion treatment.
Figure 5.
Comparison of low-density lipoprotein (LDL) oxidation extent during policosanol consumption. (A) Determination of oxidized species using thiobarbituric acid reactive substances (TBARS) method in LDL (1 mg of protein) in native state at weeks 0 and 8. (B) Determination of oxidized species using TBARS method in LDL (1 mg of protein) in the presence of cupric ion at weeks 0 and 8. *p<0.05 vs. control. (C) Comparison of electromobility of LDL between weeks 0 and 8 with or without cupric ion in 0.5% agarose gel.
Cupric ion-mediated oxidation was significantly reduced in all groups, as shown in Fig. 5B. Oxidation of LDL was reduced by 6, 4 and 10% in the YN, YS and MN groups. This result suggests that sensitivity of LDL oxidation by cupric ion treatment was significantly reduced (p<0.05) by policosanol consumption for 8 weeks. Policosanol consumption therefore increased the resistance of LDL against oxidative stress mediated by cupric ion in serum.
Electromobility of LDL at week 8 was slower than at week 0, as demonstrated in Fig. 5C, suggesting less production of negatively charged molecules and less fragmentation of apoB in LDL. Oxidized LDL moved faster to the cathode position due to an increased negative charge and apoB fragmentation.
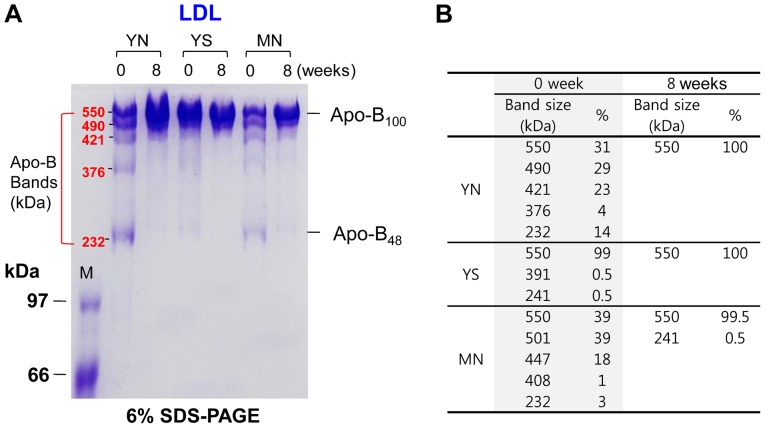
SDS-PAGE revealed that policosanol consumption caused less fragmentation of apoB at week 8 compared to week 0. The apoB48 band (264 kDa) at week 0 was thicker than at week 8 in all groups, although the apoB48 band almost disappeared. At week 8, the apoB100 band (550 kDa) was dominant in all groups, indicating that policosanol consumption effectively prevented fragmentation of apoB at week 0 (Fig. 6A and B).
Figure 6.
Comparison of electrophoretic pattern of apo-B in LDL at 0 and 8 weeks after policosanol consumption. (A) Electrophoretic profile of apo-B band population in LDL as visualized by (6% SDS-PAGE). (B) Comparison of apo-B band size in LDL from densitometric analysis as described in the Materials and methods.
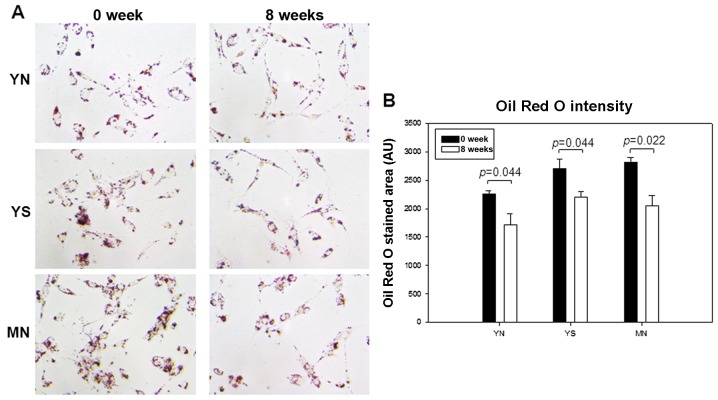
LDL phagocytosis assay revealed less uptake of LDL in all groups at week 8 than at week 0, as visualized by Oil red O staining (Fig. 7A). The YN and YS groups showed a 25 and 19% reduction in LDL uptake, respectively, whereas the MN group showed 27% reduction (Fig. 7B). These results were well correlated with the reduced MDA level (Fig. 5A) and fragmentation of apoB in LDL (Fig. 6).
Figure 7.
Comparison of low-density lipoprotein (LDL) uptake into macrophages. (A) Uptake of LDL from each group at weeks 0 and 8 after uptake into macrophages as visualized by Oil red O staining. (B) Quantification of Oil red O-stained area by computer-assisted morphometry.
Enhancement of HDL properties
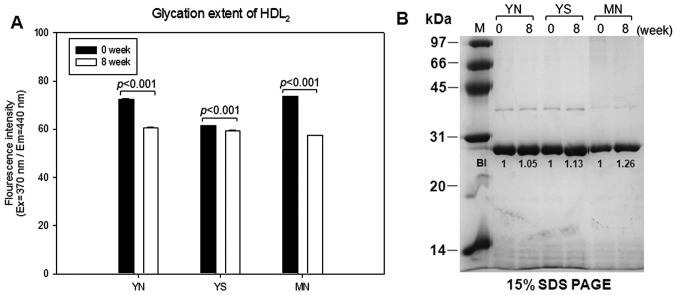
At week 8, glycation extent of HDL2 was reduced by 16, 3 and 22% in the YN, YS and MN groups, respectively, based on reduced fluorescence intensity of glycated end products, as shown in Fig. 8A. SDS-PAGE analysis showed that the apoA-I content of HDL2 increased at week 8 by 5, 13 and 26% in the YN, YS and MN groups, respectively, compared to week 0 (Fig. 8B).
Figure 8.
Glycation extent and expression level of apolipoprotein A-I (apoA-I) in high-density lipoprotein 2 (HDL2). (A) Fluorometric determination (ex=370 nm, em=440 nm) of glycation extent. (B) Electrophoretic patterns of apoA-I (5 µg/lane, 15% SDS-PAGE).
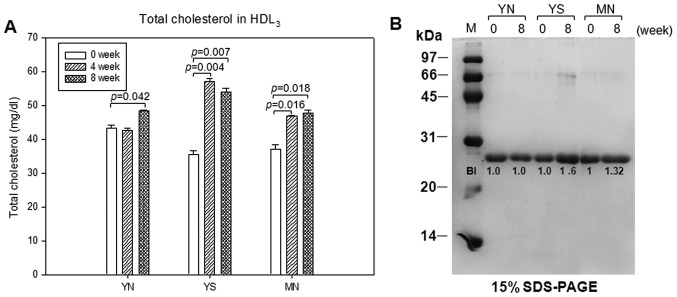
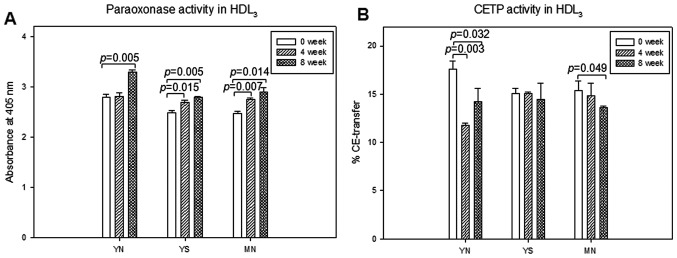
In HDL3, total cholesterol content was increased by 21 and 10% in the YS and MN groups, respectively, after policosanol consumption, as shown in Fig. 9A. SDS-PAGE analysis using the same amount of total protein showed that the expression level of apoA-I in the YS and MN groups increased by 66 and 32%, respectively, at week 8 compared to week 0 (Fig. 9B). In HDL3, paraoxonase activity was elevated at week 8 by 18, 12 and 17% in the YN, YS and MN groups, respectively, as shown in Fig. 10A. However, CETP activity of HDL3 was reduced at week 8 by 19, 4 and 12% in the YN, YS and MN groups, respectively, as shown in Fig. 10B.
Figure 9.
Changes in cholesterol quantity and expression level of apolipoprotein A-I (apoA-I) in high-density lipoprotein 3 (HDL3) at 0, 4 and 8 weeks after policosanol consumption. (A) Quantification of cholesterol using enzymatic method in HDL3, which was diluted with the same amount of protein (2 mg/ml). (B) Electrophoretic patterns of apoA-I (5 µg/lane, 15% SDS-PAGE).
Figure 10.
Changes in paraoxonase and cholesteryl ester transfer protein (CETP) activities in high-density lipoprotein 3 (HDL3) at 0, 4 and 8 weeks after policosanol consumption. Error bars indicate the SD from three independent experiments with duplicate samples. (A) Paraoxonase activity. Equally diluted HDL3 (20 µl, 2 mg/ml) was added to 230 µl of paraoxonethyl (cat. no. D-9286; Sigma-Aldrich)-containing solution [90 mM Tris-HCl/3.6 mM NaCl/2 mM CaCl2 (pH 8.5)]. (B) CETP activity. The same amount of protein in each individual HDL3 fraction (50 µg of total protein) was utilized as a source of CETP. Human low-density lipoprotein (LDL) (0.25 mg/ml of protein) and rHDL containing [3H]-cholesteryl oleate were used as a CE-acceptor and CE-donor, respectively.
Increases in HDL2 particle size and number
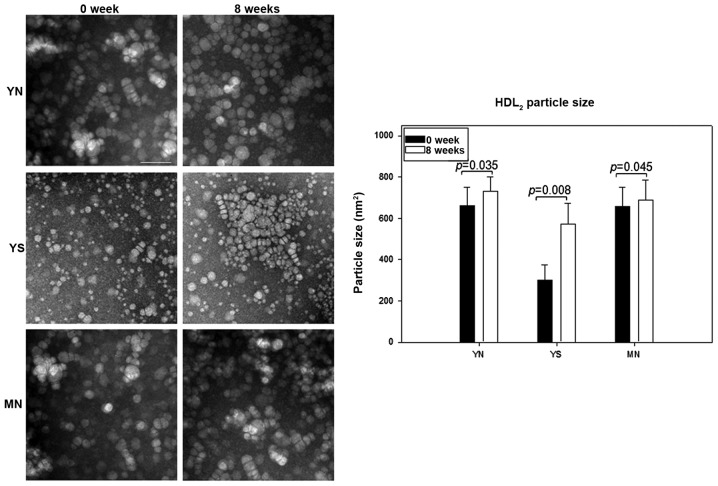
After 8 weeks of policosanol consumption along with the same concentration of HDL (0.3 mg/ml), all groups showed an increase in HDL2 particle size and number, as shown in Fig. 11. Particularly, the YS group showed a 2-fold increase in particle size from 286±74 nm2 at week 0 to 560±95 nm2 at week 8 along with a 1.6-fold increase in particle number. The YN group showed an 11% increase in particle size (from 650±81 to 730±74 nm2) and a 34% increase in particle number, whereas the MN group showed a 5% increase in particle size (from 650±74 to 690±86 nm2) and 41% increase in particle number (graph in Fig. 11).
Figure 11.
Representative image of negatively stained high-density lipoprotein 2 (HDL2) from each group (electron microscopy). All micrographs are shown at a magnification of ×40,000. The scale bar corresponds to 100 nm. Graphs show measured width and length from 20 particles of HDL.
Discussion
There have been many controversial studies concerning the chole sterol-lowering efficacy of policosanol. Italian, American, Cuban and Chinese groups have all reported the potent efficacy of policosanol in increasing HDL and lowering LDL along with reduced oxidation of LDL (7). American and German groups reported that policosanol is ineffective in the treatment of hypercholesterolemia (25). Interestingly, Berthold's group reported that policosanol is a promising phytochemical alternative for lipid reduction (2). However, the same group later reported no lipid-lowering effect of policosanol in hyperlipidemic patients (26). Although the reason for this discrepancy is unclear, the health status of subjects and patients is known to affect disease progression. Despite many clinical studies, there has been no study on improvement of lipoprotein properties such as composition and functionality beyond lipid level.
In the present study, blood pressure was notably decreased, especially in the YS and MN groups (Table I), which is in good agreement with a previous study (27). In that previous study, Castano et al reported that 5 mg of policosanol treatment for 12 weeks in older patients (66±5 years) with hypercholesterolemia reduced both systolic and diastolic blood pressure levels. In the present study, the YS group also showed a significant reduction in systolic blood pressure and visceral fat content upon policosanol consumption. Smokers are known to have higher blood pressure (28) and visceral fat content (29) than non-smokers, which can be ameliorated by policosanol.
Serum uric acid level is directly correlated with incidence of kidney and cardiovascular diseases as well as gout and hypertension (30). In the MN group, reduction in the uric acid level and blood pressure were well correlated with a lowered risk of metabolic syndrome, as evidenced by reduced serum TG content and visceral fat mass along with an increased HDL-C level. Since uric acid is a modulator of glucose and lipid metabolism, an increased uric acid level is associated with hypertriglyceridemia and hypertension (31) via increased rennin and decreased nitric oxide levels. Notably, policosanol consumption reduced serum uric acid, TG and body fat contents in the MN group. Our group reported that metabolic syndrome patients (22) and the elderly (32) showed an elevated uric acid level and CETP activity.
The major finding of this study is that impaired functionality of HDL in smokers can be enhanced by policosanol in terms of antioxidant, anti-glycation, and anti-atherosclerotic activities. Our group reported that the YS group showed higher serum TG levels, and lipoproteins from smokers are strikingly enriched with TG (12). The present observation of elevated TG content in lipoproteins from smokers at week 0 (Table I) is in good agreement with a prior study (12). Moreover, reduction in the serum TG level in the YS group was well correlated with enhanced functionality against LDL oxidation and glycation.
Another significant finding was that the moisture content of facial skin increased (Table I), which was well correlated with enhanced HDL functionality via antioxidant and anti-glycation activities (Figs. 2, 5 and 8). Microvascular function of facial skin is closely related with enhancement of HDL functionality (33). Psoriasis is a skin disorder characterized by dysfunctional HDL and is accompanied by systemic inflammation and low levels of HDL-C. Psoriasis also affects HDL composition and function. HDL from patients with psoriasis showed significant impairment of cholesterol efflux (34). In the present study, enhanced functionality of HDL may have led to improvement in skin function. Although further studies should be carried out to elucidate a detailed mechanism, this result indicates the association of enhanced HDL function with skin moisture.
Although there were no notable differences in serum lipid (cholesterol and triacylglycerol) and glucose levels among the groups, serum antioxidant ability was notably improved (Fig. 2), and functional and structural correlations of lipoproteins were significantly enhanced. Moreover, extent of LDL oxidation was markedly reduced (Fig. 5), fragmentation of apoB and appearance of apoB48 in LDL were diminished, and apoB100 level was elevated upon policosanol supplementation (Fig. 6). ApoB48 is a constituent of chylomicron remnants and TG-rich lipoproteins, and a high level of apoB48 is suspected to be a major risk factor for the development of cardiovascular disease (35). Similarly, Menendez et al reported that normolipidemic subjects (40±10 years) treated with 10 mg of policosanol for 8 weeks showed less production of oxidized LDL (7), although electromobility and the sub-fraction of apoB100 were unconfirmed. In the present study, we confirmed that the electromobility of LDL was enhanced by the antioxidant activity of policosanol.
CETP activity was notably decreased in both the LDL and HDL3 fractions (Fig. 10B) along with the serum TG level (Table I). It has been widely accepted that suppression of CETP activity contributes to enhancement of HDL functionality and anti-aging effects. Loss-of-function mutations in the CETP gene are negatively associated with incidence of coronary artery disease (10) and have been implicated in longevity (36).
Serum antioxidant ability (Fig. 2) was enhanced in the presence or absence of Cu2+, and LDL from all subjects was oxidized to a lesser extent along with slower electromobility (Fig. 5) and apoB fragmentation (Fig. 6). Extent of HDL glycation was inhibited (Fig. 8A) with higher apoA-I contents in HDL2 (Fig. 8B) and HDL3 (Fig. 9B), as the beneficial functions of HDL are exerted by apoA-I. Recently, Mani et al reported that a higher level of HDL-C:apoA-I or apoA-I alone is associated with slower progression of the percent atheroma volume (9). Similarly, our group reported that vitamin C consumption increases apoA-I content in HDL along with enhancement of serum antioxidant ability (37).
In HDL3, paraoxonase activity was enhanced and CETP activity was reduced (Fig. 10). In all groups, particle number and the size of HDL2 were significantly increased after 8 weeks (Fig. 11), indicating that biogenesis and maturation of HDL along with enrichment of cholesterol were accelerated by policosanol. Accordingly, the MN group at week 8 showed a 1.3-fold higher expression of apoA-I, suggesting that biogenesis of HDL was accelerated. It is possible that higher particle numbers of HDL and apoA-I enhanced the antioxidant activity of serum, as increased apoA-I content is more atheroprotective with beneficial metabolic and vascular effects (38). Similarly, quercetin, an isoflavonoid with potent antioxidant and anti-inflammatory activities, was shown to promote apoA-I gene expression in HepG2 cells (39). In a clinical study, quercetin decreased systolic blood pressure by 2.6 mmHg but had no effect on plasma TC, LDL-C and TG levels (40). Taken together, enhanced antioxidant ability and elevated apoA-I expression may be linked with improvement in hypertension. In an animal test, we reported that policosanol supplementation has lipid-lowering and HDL-C-elevating effects in zebrafish. However, a weaker hypolipidemic effect was observed in the present study. Although the MN and YS groups did not show dramatic reduction in serum TC or elevation of HDL-C content, the functionality of HDL was enhanced and protected LDL from oxidation via CETP inhibition. Enhanced HDL functionality and lower glycation can reduce arterial stiffness, as accumulation of advanced glycation end products exacerbates arterial stiffness (41) and increases blood pressure (42).
The most common abnormality of unhealthy HDL is alteration of lipid composition, including enrichment of TGs and depletion of cholesterol esters in the HDL core (43). However, other alterations include increased serum amyloid A (SAA) content, loss of apoA-I, accumulation of glycated apoA-I, enrichment of TG composition, and reduced levels of HDL-associated enzymes such as PON1. Generally, dysfunctional HDL has a smaller particle size and less apoA-I but enrichment of TGs.
Furthermore, as shown in the present study, a larger HDL particle size is important to the beneficial activity of HDL and suppression of metabolic syndrome (43). Metabolically healthy adults display a lower number of small dense LDL particles and a higher number of large HDL particles, irrespective of BMI and health status (44). In a previous study, subjects with exceptional longevity and lower incidence of cardiovascular disease showed a larger HDL particle size, lower CETP concentration, and CETP gene mutation (I405V) than control groups (36). Many clinical studies have suggested an atheroprotective role for larger HDL particles, as CETP inhibitors increase plasma HDL cholesterol levels (45). In the present study, the MN and YS groups showed significantly increased HDL particle size and reduced CETP activity, which is in good agreement with a previous study (9) on functionally enhanced HDL (43,44).
In conclusion, HDL functionality can be enhanced by policosanol consumption both in healthy young and middle-aged subjects, and policosanol improves the compositions of apolipoproteins and lipids. The major finding of this study is that impaired functionality of HDL in smokers and middle-aged subjects can be enhanced by lowering blood pressure via policosanol consumption for 8 weeks.
Acknowledgments
This study was supported by a grant from the Mid-Career Researcher Program (2014-11049455) and Medical Research Center Program (2015R1A5A2009124) through the National Research Foundation (NRF), funded by the Ministry of Science, ICT and Future Planning of Korea.
References
- 1.Carbajal D, Arruzazabala ML, Valdés S, Más R. Effect of policosanol on platelet aggregation and serum levels of arachidonic acid metabolites in healthy volunteers. Prostaglandins. Leukot Essent Fatty Acids. 1998;58:61–64. doi: 10.1016/S0952-3278(98)90130-2. [DOI] [PubMed] [Google Scholar]
- 2.Gouni-Berthold I, Berthold HK. Policosanol: clinical pharmacology and therapeutic significance of a new lipid-lowering agent. Am Heart J. 2002;143:356–365. doi: 10.1067/mhj.2002.119997. [DOI] [PubMed] [Google Scholar]
- 3.Oliaro-Bosso S, Calcio Gaudino E, Mantegna S, Giraudo E, Meda C, Viola F, Cravotto G. Regulation of HMGCoA reductase activity by policosanol and octacosadienol, a new synthetic analogue of octacosanol. Lipids. 2009;44:907–916. doi: 10.1007/s11745-009-3338-y. [DOI] [PubMed] [Google Scholar]
- 4.Greyling A, De Witt C, Oosthuizen W, Jerling JC. Effects of a policosanol supplement on serum lipid concentrations in hypercholesterolaemic and heterozygous familial hypercholesterolaemic subjects. Br J Nutr. 2006;95:968–975. doi: 10.1079/BJN20061715. [DOI] [PubMed] [Google Scholar]
- 5.Kassis AN, Jones PJ. Lack of cholesterol-lowering efficacy of Cuban sugar cane policosanols in hypercholesterolemic persons. Am J Clin Nutr. 2006;84:1003–1008. doi: 10.1093/ajcn/84.5.1003. [DOI] [PubMed] [Google Scholar]
- 6.Guo YL, Xu RX, Zhu CG, Wu NQ, Cui ZP, Li JJ. Poli cosanol attenuates statin-induced increases in serum proprotein convertase subtilisin/kexin type 9 when combined with atorvastatin. Evid Based Complement Alternat Med. 2014;2014:926087. doi: 10.1155/2014/926087. [DOI] [PMC free article] [PubMed] [Google Scholar]
- 7.Menéndez R, Más R, Amor AM, González RM, Fernández JC, Rodeiro I, Zayas M, Jiménez S. Effects of policosanol treatment on the susceptibility of low density lipoprotein (LDL) isolated from healthy volunteers to oxidative modification in vitro. Br J Clin Pharmacol. 2000;50:255–262. doi: 10.1046/j.1365-2125.2000.00250.x. [DOI] [PMC free article] [PubMed] [Google Scholar]
- 8.Kresanov P, Vasankari T, Ahotupa M, Kaikkonen J, Hutri-Kähönen N, Juonala M, Kähönen M, Lehtimäki T, Viikari J, Raitakari OT. Paraoxonase-1 and oxidized lipoprotein lipids. The cardiovascular risk in young finns study. Atherosclerosis. 2015;241:502–506. doi: 10.1016/j.atherosclerosis.2015.06.004. [DOI] [PubMed] [Google Scholar]
- 9.Mani P, Uno K, St John J, Tuzcu EM, Nissen SE, Nicholls SJ. Relation of high-density lipoprotein cholesterol: apolipoprotein a-I ratio to progression of coronary atherosclerosis in statin-treated patients. Am J Cardiol. 2014;114:681–685. doi: 10.1016/j.amjcard.2014.06.001. [DOI] [PubMed] [Google Scholar]
- 10.Chantepie S, Bochem AE, Chapman MJ, Hovingh GK, Kontush A. High-density lipoprotein (HDL) particle subpopulations in heterozygous cholesteryl ester transfer protein (CETP) deficiency: maintenance of antioxidative activity. PLoS One. 2012;7:e49336. doi: 10.1371/journal.pone.0049336. [DOI] [PMC free article] [PubMed] [Google Scholar]
- 11.Lim SM, Yoo JA, Lee EY, Cho KH. Enhancement of high-density lipoprotein cholesterol functions by encapsulation of policosanol exerts anti-senescence and tissue regeneration effects via improvement of anti-glycation, anti-apoptosis, and cholesteryl ester transfer inhibition. Rejuvenation Res. 2016;19:59–70. doi: 10.1089/rej.2015.1712. [DOI] [PubMed] [Google Scholar]
- 12.Lee EY, Yoo JA, Lim SM, Cho KH. Anti-aging and tissue regeneration ability of policosanol along with lipid-lowering effect in hyperlipidemic zebrafish via enhancement of high-density lipoprotein functionality. Rejuvenation Res. 2016;19:149–158. doi: 10.1089/rej.2015.1745. [DOI] [PMC free article] [PubMed] [Google Scholar]
- 13.Benzie IF, Strain JJ. The ferric reducing ability of plasma (FRAP) as a measure of 'antioxidant power': the FRAP assay. Anal Biochem. 1996;239:70–76. doi: 10.1006/abio.1996.0292. [DOI] [PubMed] [Google Scholar]
- 14.Park KH, Kim JR, Lee JS, Lee H, Cho KH. Ethanol or water extract of purple sweet potato exhibits anti-atherosclerotic activity and inhibitory activity against protein glycation. J Med Food. 2010;13:91–98. doi: 10.1089/jmf.2009.1077. [DOI] [PubMed] [Google Scholar]
- 15.Havel RJ, Eder HA, Bragdon JH. The distribution and chemical composition of ultracentrifugally separated lipoproteins in human serum. J Clin Invest. 1955;34:1345–1353. doi: 10.1172/JCI103182. [DOI] [PMC free article] [PubMed] [Google Scholar]
- 16.Markwell MA, Haas SM, Bieber LL, Tolbert NE. A modification of the Lowry procedure to simplify protein determination in membrane and lipoprotein samples. Anal Biochem. 1978;87:206–210. doi: 10.1016/0003-2697(78)90586-9. [DOI] [PubMed] [Google Scholar]
- 17.Blois MS. Antioxidant determinations by the use of a stable free radical. Nature. 1958;181:1199–1200. doi: 10.1038/1811199a0. [DOI] [Google Scholar]
- 18.McPherson JD, Shilton BH, Walton DJ. Role of fructose in glycation and cross-linking of proteins. Biochemistry. 1988;27:1901–1907. doi: 10.1021/bi00406a016. [DOI] [PubMed] [Google Scholar]
- 19.Cho KH. Synthesis of reconstituted high-density lipoprotein (rHDL) containing apoA-I and apoC-III: the functional role of apoC-III in rHDL. Mol Cells. 2009;27:291–297. doi: 10.1007/s10059-009-0037-8. [DOI] [PubMed] [Google Scholar]
- 20.Cho KH, Shin DG, Baek SH, Kim JR. Myocardial infarction patients showed altered lipoprotein properties and functions when compared with stable angina pectoris patients. Exp Mol Med. 2009;41:67–76. doi: 10.3858/emm.2009.41.2.009. [DOI] [PMC free article] [PubMed] [Google Scholar]
- 21.Eckerson HW, Wyte CM, La Du BN. The human serum paraoxonase/arylesterase polymorphism. Am J Hum Genet. 1983;35:1126–1138. [PMC free article] [PubMed] [Google Scholar]
- 22.Park KH, Shin DG, Kim JR, Hong JH, Cho KH. The functional and compositional properties of lipoproteins are altered in patients with metabolic syndrome with increased cholesteryl ester transfer protein activity. Int J Mol Med. 2010;25:129–136. [PubMed] [Google Scholar]
- 23.Park KH, Kim JY, Choi I, Kim JR, Cho KH. ω-6 (18:2) and ω-3 (18:3) fatty acids in reconstituted high-density lipoproteins show different functionality of anti-atherosclerotic properties and embryo toxicity. J Nutr Biochem. 2015;26:1613–1621. doi: 10.1016/j.jnutbio.2015.08.008. [DOI] [PubMed] [Google Scholar]
- 24.Cho KH, Park SH, Park JE, Kim YO, Choi I, Kim JJ, Kim JR. The function, composition, and particle size of high-density lipoprotein were severely impaired in an oliguric phase of hemorrhagic fever with renal syndrome. Clin Biochem. 2008;41:56–64. doi: 10.1016/j.clinbiochem.2007.10.007. [DOI] [PubMed] [Google Scholar]
- 25.Dulin MF, Hatcher LF, Sasser HC, Barringer TA. Policosanol is ineffective in the treatment of hypercholesterolemia: a randomized controlled trial. Am J Clin Nutr. 2006;84:1543–1548. doi: 10.1093/ajcn/84.6.1543. [DOI] [PubMed] [Google Scholar]
- 26.Berthold HK, Unverdorben S, Degenhardt R, Bulitta M, Gouni-Berthold I. Effect of policosanol on lipid levels among patients with hypercholesterolemia or combined hyperlipidemia: a randomized controlled trial. JAMA. 2006;295:2262–2269. doi: 10.1001/jama.295.19.2262. [DOI] [PubMed] [Google Scholar]
- 27.Castaño G, Más R, Fernández JC, Illnait J, Fernández L, Alvarez E. Effects of policosanol in older patients with type II hypercholesterolemia and high coronary risk. J Gerontol A Biol Sci Med Sci. 2001;56:M186–M192. doi: 10.1093/gerona/56.3.M186. [DOI] [PubMed] [Google Scholar]
- 28.Minami J, Ishimitsu T, Matsuoka H. Effects of smoking cessation on blood pressure and heart rate variability in habitual smokers. Hypertension. 1999;33:586–590. doi: 10.1161/01.HYP.33.1.586. [DOI] [PubMed] [Google Scholar]
- 29.Kim JH, Shim KW, Yoon YS, Lee SY, Kim SS, Oh SW. Cigarette smoking increases abdominal and visceral obesity but not overall fatness: an observational study. PLoS One. 2012;7:e45815. doi: 10.1371/journal.pone.0045815. [DOI] [PMC free article] [PubMed] [Google Scholar]
- 30.Feig DI. Serum uric acid and the risk of hypertension and chronic kidney disease. Curr Opin Rheumatol. 2014;26:176–185. doi: 10.1097/BOR.0000000000000033. [DOI] [PubMed] [Google Scholar]
- 31.Lima WG, Martins-Santos ME, Chaves VE. Uric acid as a modulator of glucose and lipid metabolism. Biochimie. 2015;116:17–23. doi: 10.1016/j.biochi.2015.06.025. [DOI] [PubMed] [Google Scholar]
- 32.Park KH, Shin DG, Kim JR, Cho KH. Senescence-related truncation and multimerization of apolipoprotein A-I in high-density lipoprotein with an elevated level of advanced glycated end products and cholesteryl ester transfer activity. J Gerontol A Biol Sci Med Sci. 2015;65:600–610. doi: 10.1093/gerona/glq034. [DOI] [PubMed] [Google Scholar]
- 33.Michel CC, Nanjee MN, Olszewski WL, Miller NE. LDL and HDL transfer rates across peripheral microvascular endothelium agree with those predicted for passive ultrafiltration in humans. J Lipid Res. 2015;56:122–128. doi: 10.1194/jlr.M055053. [DOI] [PMC free article] [PubMed] [Google Scholar]
- 34.Marsche G, Holzer M, Wolf P. Antipsoriatic treatment extends beyond the skin: recovering of high-density lipoprotein function. Exp Dermatol. 2014;23:701–704. doi: 10.1111/exd.12483. [DOI] [PMC free article] [PubMed] [Google Scholar]
- 35.Fujioka Y, Ishikawa Y. Remnant lipoproteins as strong key particles to atherogenesis. J Atheroscler Thromb. 2009;16:145–154. doi: 10.5551/jat.E598. [DOI] [PubMed] [Google Scholar]
- 36.Barzilai N, Atzmon G, Schechter C, Schaefer EJ, Cupples AL, Lipton R, Cheng S, Shuldiner AR. Unique lipoprotein phenotype and genotype associated with exceptional longevity. JAMA. 2003;290:2030–2040. doi: 10.1001/jama.290.15.2030. [DOI] [PubMed] [Google Scholar]
- 37.Kim SM, Lim SM, Yoo JA, Woo MJ, Cho KH. Consumption of high-dose vitamin C (1250 mg per day) enhances functional and structural properties of serum lipoprotein to improve anti-oxidant, anti-atherosclerotic, and anti-aging effects via regulation of anti-inflammatory microRNA. Food Funct. 2015;6:3604–3612. doi: 10.1039/C5FO00738K. [DOI] [PubMed] [Google Scholar]
- 38.Gotto AM, Jr, Moon JE. Pharmacotherapies for lipid modification: beyond the statins. Nat Rev Cardiol. 2013;10:560–570. doi: 10.1038/nrcardio.2013.117. [DOI] [PubMed] [Google Scholar]
- 39.Haas MJ, Onstead-Haas LM, Szafran-Swietlik A, Kojanian H, Davis T, Armstrong P, Wong NC, Mooradian AD. Induction of hepatic apolipoprotein A-I gene expression by the isoflavones quercetin and isoquercetrin. Life Sci. 2014;110:8–14. doi: 10.1016/j.lfs.2014.06.014. [DOI] [PubMed] [Google Scholar]
- 40.Egert S, Bosy-Westphal A, Seiberl J, Kürbitz C, Settler U, Plachta-Danielzik S, Wagner AE, Frank J, Schrezenmeir J, Rimbach G, et al. Quercetin reduces systolic blood pressure and plasma oxidised low-density lipoprotein concentrations in overweight subjects with a high-cardiovascular disease risk phenotype: a double-blinded, placebo-controlled cross-over study. Br J Nutr. 2009;102:1065–1074. doi: 10.1017/S0007114509359127. [DOI] [PubMed] [Google Scholar]
- 41.Nazratun N, Mahmood AA, Kuppusamy UR, Ahmad TS, Tan SY. Diabetes mellitus exacerbates advanced glycation end product accumulation in the veins of end-stage renal failure patients. Vasc Med. 2006;11:245–250. doi: 10.1177/1358863x06072202. [DOI] [PubMed] [Google Scholar]
- 42.Semba RD, Sun K, Schwartz AV, Varadhan R, Harris TB, Satterfield S, Garcia M, Ferrucci L, Newman AB. Serum carboxymethyl-lysine, an advanced glycation end product, is associated with arterial stiffness in older adults. J Hypertens. 2015;33:797–803. doi: 10.1097/HJH.0000000000000460. [DOI] [PMC free article] [PubMed] [Google Scholar]
- 43.Phillips CM, Perry IJ. Lipoprotein particle subclass profiles among metabolically healthy and unhealthy obese and non-obese adults: does size matter? Atherosclerosis. 2015;242:399–406. doi: 10.1016/j.atherosclerosis.2015.07.040. [DOI] [PubMed] [Google Scholar]
- 44.Kontush A, Chapman MJ. Why is HDL functionally deficient in type 2 diabetes? Curr Diab Rep. 2008;8:51–59. doi: 10.1007/s11892-008-0010-5. [DOI] [PubMed] [Google Scholar]
- 45.Kastelein JJ, Besseling J, Shah S, Bergeron J, Langslet G, Hovingh GK, Al-Saady N, Koeijvoets M, Hunter J, Johnson-Levonas AO, et al. Anacetrapib as lipid-modifying therapy in patients with heterozygous familial hypercholesterolaemia (REALIZE): a randomised, double-blind, placebo-controlled, phase 3 study. Lancet. 2015;385:2153–2161. doi: 10.1016/S0140-6736(14)62115-2. [DOI] [PubMed] [Google Scholar]


