Abstract
The NMR chemical shifts of certain atomic nuclei in proteins (1Hα,13Cα, and 13Cβ) depend sensitively on whether or not the amino acid residue is part of a secondary structure (α-helix, β-sheet), and if so, whether it is helix or sheet. The physical origin of the different chemical shifts of atomic nuclei in α-helices versus β-sheets is a problem of long standing. We report that the chemical shift contributions arising from secondary structure (secondary structure shifts) depend strongly on the extent of exposure to solvent. This behavior is observed for 1Hα, 13Cα, and 13Cβ (sheet), but not for13Cβ (helix), whose secondary structure shifts are small. When random coil values are subtracted from the chemical shifts of all1Hα nuclei (Pro residues excluded) and the residual chemical shifts are summed to plot the mean values against solvent exposure, the results give a funnel-shaped curve that approaches a small value at full-solvent exposure. When chemical shifts are plotted instead against Elocal, the electrostatic contribution to conformational energy produced by local dipole–dipole interactions, a well characterized dependence of 1Hα chemical shifts on Elocal is found. The slope of this plot varies with both the type of amino acid and the extent of solvent exposure. These results indicate that secondary structure shifts are produced chiefly by the electric field of the protein, which is screened by water dipoles at residues in contact with solvent.
Keywords: protein solvation, secondary structure shifts
The chemical shift index method (1, 2) is commonly used to assign protein secondary structures. This method is based on the secondary structure shift, which is the difference between the observed chemical shift and the random coil value assigned to this amino acid type in the unfolded conformation. Assignment of secondary structure is a useful intermediate step in determining the 3D solution structure of a protein from NMR data. Secondary structure assignment is also useful in predicting the 3D structure of a protein from its amino acid sequence. A threading method based on chemical shift data has been developed (2) for testing whether an amino acid sequence can fold to form a given 3D structure. Understanding the origin of the distinctive secondary structure shifts of helices and sheets is a problem of considerable interest.
Protein chemical shifts, for a given atomic nucleus and amino acid type, display large variations, and the factors that control these variations are poorly understood. The reason why the chemical shift index method works so well for assigning secondary structures is that the secondary structure shift has opposite signs for α-helix and β-sheet (1–3). Several proposals have been made (4–10) regarding the physical origin of the different chemical shifts found in α-helices and β-sheets. For both the 1Hα and the 13Cα nuclei, protein chemical shifts are said to depend chiefly on φ,ψ torsion angles and on the random coil values (2). The protein electric field may contribute to chemical shifts (5), but its contribution is difficult to evaluate and screening of the electric field by solvent has not yet been taken into account (5). Current estimates of the factors influencing secondary structure shifts (2) treat solvent exposure as a minor factor. There are now sufficient chemical shift entries in the BioMagResBank database (11) to examine this issue directly by computing solvent exposure for these entries and analyzing the results.
Dependence of Chemical Shifts on Exposure to Solvent
Fig. 1A displays the dependence of 1Hα chemical shift on solvent exposure for different amino acid types. Data for 1,010 proteins, obtained from the BioMagResBank database (11) are shown. Secondary structure is assigned by the dssp algorithm (12) and the random coil shifts are from ref. 2. Similar results are found for 13Cα (Fig. 1B) and 13Cβ (sheet) (Fig. 1C). Two levels of solvent exposure are shown: buried (solvent exposure of <0.1) and partially exposed (solvent exposure of >0.4). Because the chemical shifts are obtained from studies of native protein structures, very few chemical shifts are reported for fully exposed residues. The exposure to solvent is computed from the solvent-accessible surface area (ASA) (13), with full solvent accessibility being defined from the ASA values of a stochastic mixture of tripeptides (14). Although the stochastic mixture of tripeptides is fully solvent-exposed by the definition (14) used here, even peptide groups in tripeptides experience partial shielding from water by neighboring side chains and residue X has a solvent exposure of >1 in a peptide with glycine on either side of X, GXG.
Fig. 1.
Plots of average secondary structure shift against amino acid type for residues in α-helices and β-sheets: 1Hα nuclei (A), 13Cα nuclei (B), and 13Cβ nuclei (C). (A) Secondary structure shift [chemical shift minus the random coil value (2)] for 1Hα nuclei plotted against amino acid type. Data are from the BioMagResBank database (11) for residues in protein secondary structures: α-helices (Lower) (circles) and β-sheets (Upper) (squares). Filled symbols show data for buried residues (solvent exposure of <0.1) and open symbols show partially exposed residues (solvent exposure of >0.4). Secondary structures of the proteins listed in the BioMagResBank database (11) are assigned by the algorithm dssp (12). If a smaller set of chemical shift data are used that conforms to International Union of Pure and Applied Chemistry recommendations for standard chemical shifts, the results do not change significantly (data not shown). (B) Secondary structure shifts for 13Cα nuclei versus amino acid type: α-helices (Upper) (circles) and β-sheets (Lower) (squares). Filled symbols are buried residues, and open symbols are partially exposed residues (see legend to A). (C) Secondary structure shifts for 13Cβ nuclei versus amino acid type: α-helices (Lower) (circles) and β-sheets (Upper) (squares). Filled symbols are buried residues, and open symbols are partially exposed residues (see legend to A).
Fig. 1 shows that substantial solvent exposure causes the absolute values of secondary structure shifts to decrease significantly. Similar results are found for α-helix and β-sheet, for 1Hα (Fig. 1 A), 13Cα (Fig. 1B), and 13Cβ (sheet) (Fig. 1C), and for all 18 aa considered. Gly and Pro are omitted because they have very small propensities for forming α-helices and β-sheets. Only small secondary structure shifts are found for 13Cβ (helix) (Fig. 1C), and there is no clear dependence on solvent exposure. The reason why the 13Cβ chemical shift differences are small for helical residues is not known, but a relevant factor is that Cβ is further from the helix backbone than 13Cα and 1Hα.
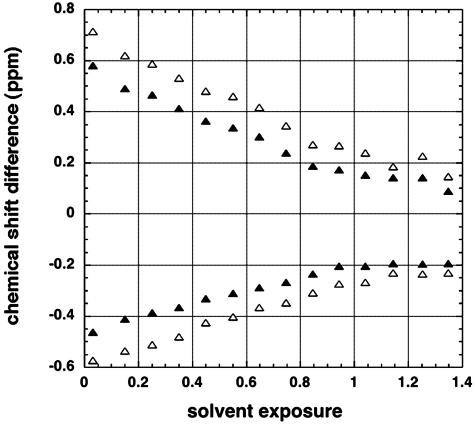
To plot mean values of residual chemical shift versus solvent exposure, data for 19 aa (Pro excluded) were summed and all residues, both within and outside secondary structure, are included in Fig. 2. The chemical shift difference refers to the observed value minus the random coil value. Subtraction of random coil values yielded roughly equal numbers of residues with positive and negative chemical shift differences. The positive and negative values were processed separately. Chemical shift results (11) for 103,084 1Hα nuclei were analyzed. The data were binned by using a bin size of 0.1 in solvent exposure. The mean (absolute) values of chemical shift difference decreased regularly with increasing solvent exposure. They approached small values for solvent exposure of >1.4, where the funnel-shaped plot ends because there were <20 residues per bin. As explained above, the standard definition of solvent exposure (14) allows values of >1.0 to be observed for some sequences. The rms deviation values are plotted in Fig. 2, and they also show a funnel-shaped curve. The range of values of chemical shift, and the variables producing this range, are explored further below.
Fig. 2.
Chemical shift difference (observed value minus random coil value) is plotted against solvent exposure for 1Hα nuclei. Residues are included both within and outside the secondary structure, and all amino acids (except proline) are included. The data are binned with a bin size of 0.1 solvent exposure and mean values (▴) are shown, as well as the root mean square deviations (▵). Data for 1,010 proteins (11) and 103,084 residues are averaged. The rms deviation values are multiplied by –1 when the chemical shift difference is negative.
Correlation of Chemical Shifts with Elocal
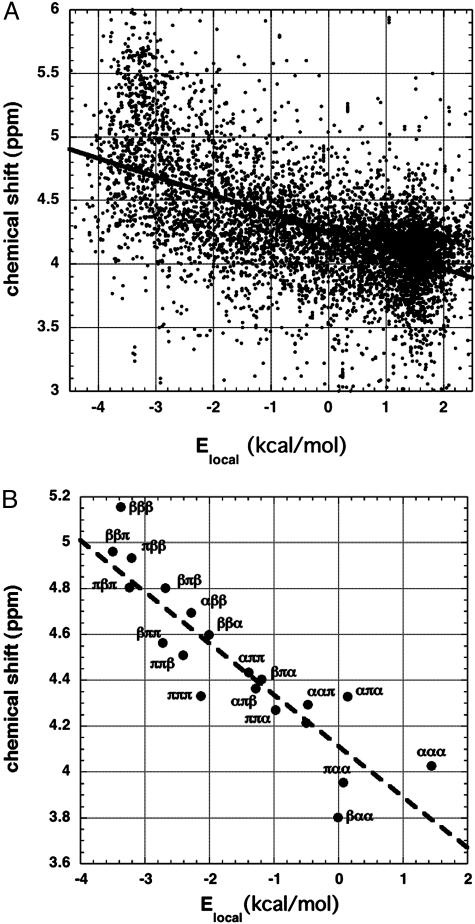
Fig. 3A displays 7,548 values of 1Hα chemical shifts for alanine residues (11), plotted against local electrostatic energy (Elocal) (15), which serves as a convenient single variable describing backbone conformation and also gives information about the strength of local peptide dipole–dipole interactions. The quantity Elocal is the electrostatic contribution to conformational energy computed for a triplet of three adjoining residues (counted by Cα atoms), which are flanked by four peptide groups (15). Elocal is computed from the backbone geometry as described (16), by using a dielectric constant of 1 and specified values of the partial charges on the peptide NH and C O groups. As illustrated in Fig. 3B, the triplets βββ (Elocal = –3.37 kcal/mol) and ααα (Elocal = 1.44 kcal/mol) occur near opposite ends of the Elocal scale, whereas the polyproline II triplet πππ has Elocal = –2.13 kcal/mol.
Fig. 3.
The plot of individual chemical shift values against Elocal for all alanine residues (A) and for the central residues of selected triplet sets composed of three main core backbone conformations (B). (A) 1Hα chemical shift versus Elocal (ref. 15; see text) for 7,548 alanine residues in protein structures. Data are from the BioMagResBank database (11). (B) Mean values of chemical shift and Elocal are shown for each alanine triplet type by using only residues in core regions of the three main backbone conformations, α, β, and π (polyproline II). The rms deviation values, which are large, vary from 0.24 ppm for ααπ to 0.53 ppm for βπβ. The definitions (27) of core α, β, and π are based on φ,ψ values taken from the Ramachandran maps of the amino acid types (27); β is to the left and π is to the right of φ =–100°. There are 273 alanine residues in the βββ triplet and 2,776 residues in the ααα triplet. The line is taken from A.
Fig. 3A indicates that protein chemical shifts are correlated with Elocal, which depends on the φ,ψ values of the three residues in a triplet. Similar results are found for all 18 aa studied, and for 13Cα nuclei (data not shown). When 1Hα chemical shifts are plotted against φ or ψ separately, the range of shifts seen at a given value of φ or ψ is as large as in Fig. 3A (data not shown). Because there is a large range of values of chemical shift at each value of Elocal and the correlation between chemical shift and Elocal accounts for only part of this range, we made the following test of the correlation between Elocal and chemical shift. Sets of three consecutive residues (triplets) were analyzed that contain mixed sequences of the three main backbone core conformations (α, β, and π) found in protein structures. The core conformations are defined by φ,ψ values and are based on observed occupancies of regions of the Ramachandran map (see the Fig. 3B legend for definitions). The average chemical shift of the central residue in each triplet type (βαβ, πβα, etc.) is plotted against the average value of Elocal for that triplet type in Fig. 3B. The specific triplet results cluster around the line determined for all residue types (from Fig. 3A), which indicates that the dependence of average chemical shift on Elocal is well characterized.
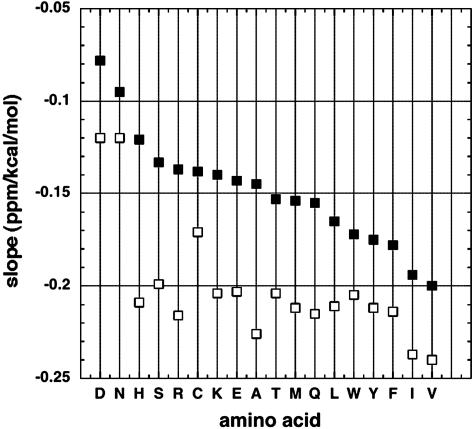
Because the secondary structure shifts depend strongly on ASA (Figs. 1 and 2), we investigated whether the slopes of the plots of chemical shift versus Elocal (Fig. 3A) also depend on ASA. Fig. 4 compares values of the slope (S) for different amino acid types, both for buried residues (solvent exposure of <0.1) and for partially exposed residues (solvent exposure of >0.4). The results in Fig. 4 show that S depends strongly on both amino acid type and extent of solvent exposure. Negative values of S are larger for buried residues than for partially exposed residues, and the variation of S with amino acid type is stronger for partially exposed than for buried residues. For at least 13 aa types (H–F, omitting C, in Fig. 4), the buried-residue values of S are nearly constant.
Fig. 4.
Plots like Fig. 3A are made for the different amino acid types and the slope of each plot is displayed against amino acid type for two classes of plot: (i) all residues are used (▪) and (ii) only buried residues (solvent exposure of <0.1) are used (□).
Nature of the Relation Between Chemical Shift and Solvent Exposure
Two explanations may be invoked for the relation between chemical shift and solvent exposure. The secondary structure shifts may be produced by the protein electric field, which is screened by water dipoles at residues in contact with solvent. Or the secondary structure shifts might be caused by close non-bonded contacts, for which increased solvent exposure would cause the magnetic shielding to decrease. However, an increase in solvent exposure causes an increase in 1Hα shielding for β-sheet residues (Figs. 1 A and 2). Consequently, the protein electric field is the probable main cause of the secondary structure shifts, for example, the electric field may polarize the peptide C O bond in chains of H bonds found in helices and sheets, as suggested recently (9). Note, however, that in this study (9) contact with solvent and the polarizing action of water dipoles is not taken into account.
If the electric field is the cause of secondary structure shifts, then the various values of S for different amino acid types in Fig. 4 should reflect the differing abilities of these amino acids to shield neighboring peptide groups from solvent, because screening of the electric field by water dipoles at a given site depends on the extent to which the peptide group at that site is in contact with solvent. When the peptide geometry (including side-chain rotamers) is defined, the extent to which a given peptide group is shielded from interacting with water is given by its electrostatic solvation free energy (ESF) value (16–19). The ESF value of an amino acid residue is expressed as a negative free energy that gives the strength of interaction between water and the peptide group of this residue. Partial charges on polar side chains are omitted to focus on the polar peptide C O and NH groups. An ESF value of 0 indicates that the peptide group is completely buried (19), out of contact with water. However, when the first solvation shells of the peptide NH and C
 O groups are empty so that ASA = 0, and contact with water is limited to the second and more distant solvation shells, a peptide may nevertheless have a small but finite ESF value (F.A., unpublished data).
The electrostatic algorithm delphi (20) has been used to compute the ESF values of various peptide conformations (16–19), and the results have been compared (17) with results found with an algorithm based on a Langevin dipole treatment (21). The parameters of delphi (partial charges and atomic radii) are left invariant in these calculations and the ESF value of a residue is determined by the peptide geometry of the peptide and the access of water to the peptide group.
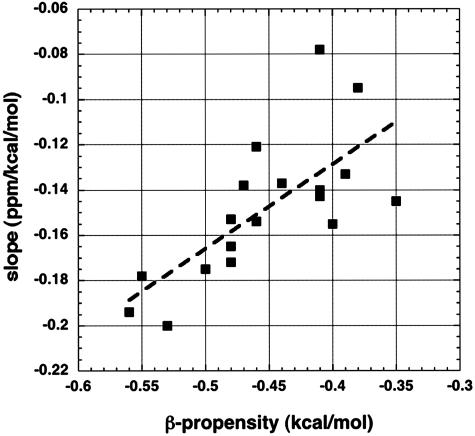
To test the proposal that differences in the slope S among amino acids (Fig. 4) depend on the water-shielding properties of the amino acid side chain, values of S for partially exposed residues are plotted in Fig. 5 against the thermodynamic β-propensity of the amino acid. A fairly good correlation (correlation coefficient of 0.72) is found. The reason for testing whether a correlation is found is that β-propensities are well correlated with ESF values (19) in a study of mutants of a zinc finger protein. This system has been used to provide values for thermodynamic β-propensities (22). Amino acids with strongly shielding side chains, according to ESF values, include the β-branched and aromatic amino acids (FHITVWY) (16, 19), which have high β-propensities (22). The experimental ESF values of amides are not related in any simple way to their polar ASA values (18), however, and there is only a moderate correlation between ESF and solvent exposure for the residues whose 1Hα chemical shifts (Fig. 2) are studied here (data not shown).
Fig. 5.
The slope found in all-residue plots (see Figs. 3A and 4) is displayed against the thermodynamic β-propensity (22) of the amino acid type. The thermodynamic β-propensities were measured (22) from the unfolding free energies of mutants for a site within a partially solvent-exposed β-hairpin of a zinc finger protein. The thermodynamic β-propensities correlate well (22) with statistical frequencies in β-sheets. The slopes shown are displayed against amino acid type in Fig. 4.
Relation of These Results to Predictions and Uses of Protein Chemical Shifts
Random coil values of chemical shifts are used to help in assigning resonances in spectra of denatured proteins and to test for the presence of residual structure (23, 24). The name “random coil” implies that no single backbone conformation is preferred and the argument has been made (25) that the β-strand conformation is not found as a regular, repeating conformation in unfolded peptides, although it is favored by peptide dipole–dipole interactions (15), because it would be detected by the 1Hα secondary shift characteristic of β-structure. Our results demonstrate that 1Hα secondary structure shifts become small for solvent-exposed residues such as those present in short peptides. Thus, solvent exposure must be a major factor determining the values of random coil shifts found in short peptides, and secondary structure shifts might pass undetected because they are small. The surprisingly wide range of values found for secondary structure shifts in proteins has been a puzzle in using the chemical shift index method (1, 2). Our results pinpoint two factors (solvent exposure and Elocal) that contribute to this wide range.
The Buckingham equation (26) predicts that the local electric field is the key variable determining the electrostatic contribution to 1Hα secondary structure shifts. Our results make it clear that solvent screening of the electric field must be included to predict chemical shifts for proteins. Research needs to be performed to test possible computational models for obtaining the local electric field, which is obtained by numerical differentiation of the electrostatic potential.
Acknowledgments
We thank S. Boxer, S. Golic Grdadolnik, D. Hadzi, J. Hermans, I. Kuntz, P. Pristovsek, and D. Wemmer for discussion. This work was supported by a grant from the Ministry of Education, Science and Sport of Slovenia and Lek Pharmaceutical Company, d.d.
Author contributions: F.A., D.K., and R.L.B. designed research; F.A., D.K., and R.L.B. performed research; F.A. contributed new reagents/analytic tools; F.A., D.K., and R.L.B. analyzed data; and R.L.B. wrote the paper.
Abbreviations: ASA, solvent-accessible surface area; ESF, electrostatic solvation free energy.
References
- 1.Wishart, D. S., Sykes, B. D. & Richards, F. M. (1992) Biochemistry 31, 1647–1651. [DOI] [PubMed] [Google Scholar]
- 2.Wishart, D. S. & Case, D. A. (2001) Methods Enzymol. 338, 3–34. [DOI] [PubMed] [Google Scholar]
- 3.Spera, S. & Bax, A. (1991) J. Am. Chem. Soc. 113, 5490–5492. [Google Scholar]
- 4.Ösapay, K. & Case, D. A. (1991) J. Am. Chem. Soc. 113, 9436–9444. [Google Scholar]
- 5.Dios, A. C. D., Pearson, J. G. & Oldfield, E. (1993) Science 260, 1491–1496. [DOI] [PubMed] [Google Scholar]
- 6.Williamson, M. P. & Asakura, T. (1993) J. Magn. Reson. 101, 63–71. [Google Scholar]
- 7.Ösapay, K. & Case, D. A. (1994) J. Biomol. NMR 4, 215–230. [DOI] [PubMed] [Google Scholar]
- 8.Asakura, T., Taoka, K., Demura, M. & Williamson, M. P. (1995) J. Biomol. NMR 6, 227–236. [DOI] [PubMed] [Google Scholar]
- 9.Thomas, A., Milon, A. & Brasseur, R. (2004) Proteins 56, 102–109. [DOI] [PubMed] [Google Scholar]
- 10.Sitkoff, D. & Case, D. A. (1997) J. Am. Chem. Soc. 119, 12262–12273. [Google Scholar]
- 11.Seavey, B. R., Farr, E. A., Westler, W. M. & Markley, J. L. (1991) J. Biomol. NMR 1, 217–236. [DOI] [PubMed] [Google Scholar]
- 12.Kabsch, W. & Sander, C. (1983) Biopolymers 22, 2577–2637. [DOI] [PubMed] [Google Scholar]
- 13.Lee, B.-K. & Richards, F. M. (1971) J. Mol. Biol. 55, 379–400. [DOI] [PubMed] [Google Scholar]
- 14.Shrake, A. & Rupley, J. A. (1973) J. Mol. Biol. 79, 351–371. [DOI] [PubMed] [Google Scholar]
- 15.Avbelj, F. & Moult, J. (1995) Biochemistry 34, 755–764. [DOI] [PubMed] [Google Scholar]
- 16.Avbelj, F. & Baldwin, R. L. (2004) Proc. Natl. Acad. Sci. USA 101, 10967–10973. [DOI] [PMC free article] [PubMed] [Google Scholar]
- 17.Avbelj, F. (2000) J. Mol. Biol. 300, 1335–1359. [DOI] [PubMed] [Google Scholar]
- 18.Avbelj, F., Luo, P. & Baldwin, R. L. (2000) Proc. Natl. Acad. Sci. USA 97, 10786–10791. [DOI] [PMC free article] [PubMed] [Google Scholar]
- 19.Avbelj, F. & Baldwin, R. L. (2002) Proc. Natl. Acad. Sci. USA 99, 1309–1313. [DOI] [PMC free article] [PubMed] [Google Scholar]
- 20.Sitkoff, D., Sharp, K. A & Honig, B. (1994) J. Phys. Chem. 98, 1978–1988. [Google Scholar]
- 21.Florian, J. & Warshel, A. (1997) J. Phys. Chem. B 101, 5583–5595. [Google Scholar]
- 22.Kim, C. A. & Berg, J. M. (1993) Nature 362, 267–270. [DOI] [PubMed] [Google Scholar]
- 23.Dyson, H. J. & Wright, P. E. (2002) Adv. Protein Chem. 62, 311–340. [DOI] [PubMed] [Google Scholar]
- 24.Schwarzinger, S., Kroon, G. J. A., Foss, T. R., Chung, J., Wright, P. E. & Dyson, H. J. (2001) J. Am. Chem. Soc. 123, 2970–2978. [DOI] [PubMed] [Google Scholar]
- 25.Bai, Y., Chung, J., Dyson, H. J. & Wright, P. E. (2001) Protein Sci. 10, 1056–1066. [DOI] [PMC free article] [PubMed] [Google Scholar]
- 26.Buckingham, A. D. (1960) Can. J. Chem. 38, 300–307. [Google Scholar]
- 27.Morris, A. L., MacArthur, M. W., Hutchinson, E. G. & Thornton, J. M. (1992) Proteins 12, 345–364. [DOI] [PubMed] [Google Scholar]


