Abstract
Although mammals of different species have different sleep patterns, brief sleep–wake transitions commonly are observed across species and appear to occur randomly throughout the sleeping period. The dynamical patterns and functions of these brief awakenings from sleep are not well understood, and they often are viewed as disruptions (random or pathologic) of the sleep process. In this article, we hypothesize that brief awakenings from sleep may reflect aspects of the endogenous sleep control mechanism and thus may exhibit certain robust dynamical patterns across species. We analyze sleep recordings from mice, rats, cats, and humans, and we compare the distributions of sleep and wake episode durations. For all four species, we find that durations of brief wake episodes during the sleep period exhibit a scale-free power-law behavior with an exponent α that remains the same for all species (α ≈ 2.2). In contrast, sleep episode durations for all four species follow exponential distributions with characteristic time scales, which change across species in relation to body mass and metabolic rate. Our findings suggest common dynamical features of brief awakenings and sleep durations across species and may provide insights into the dynamics of the neural circuits controlling sleep.
Keywords: power law, sleep regulation, sleep fragmentation
Sleep and wake are governed by complex interactions between neurons in many brain regions, including the hypothalamus and brainstem. Collectively, these neurons act as a sleep–wake “latch” that may help produce stable sleep and wakefulness (1, 2). Several mathematical and conceptual models have been proposed to account for the stability and control of sleep and wakefulness over time scales of hours and days (1–3). However, in addition to the regular sleep–wake pattern, humans and animals often exhibit brief awakenings from sleep. These brief awakenings seem to occur throughout the entire sleep period and are traditionally viewed as random disruptions of sleep associated with body motion or pathologic conditions such as sleep apnea. Because of that explanation, brief awakenings during sleep rarely are addressed in most current models of sleep regulation (4, 5).
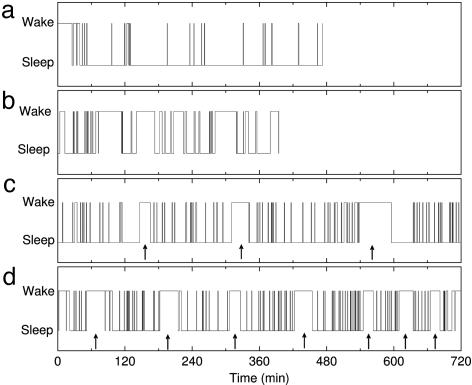
However, recent studies suggest that arousals and brief awakenings may have a more essential role in the process of sleep regulation, posing further questions to the origin and function of brief awakenings (5). A closer look at the temporal structure of the brief sleep–wake transitions reveals a complex picture (Fig. 1). In contrast to the circadian and ultradian cycles, which dominate the regulation of sleep and wakefulness at time scales of hours, brief awakenings from sleep exhibit distinct features: (i) they appear to be random, not periodic, and (ii) the duration of sleep and wake episodes during the sleep period ranges from seconds to several tens of minutes. In this article, we investigate whether a robust structure underlies the complex dynamics of the brief sleep–wake transitions across species.
Fig. 1.
Examples of sleep–wake behavior in different mammals. (a) The human data are recorded during nocturnal sleep. (b) Cat recordings are acquired during the day starting at 9 a.m. (c and d) Rat (c) and mouse (d) recordings are obtained during the daytime period from 7 a.m. to 7 p.m., their normal period of inactivity and sleep. Arrows indicate the consolidated awakenings for the rats and mice. Note the large number of brief awakenings from sleep in all four species.
Some of us recently have reported that for humans the duration t of the wake episodes during sleep follows a scale-free power-law distribution P(t) ∼ t–α with a scaling exponent α, whereas the duration t of the sleep episodes follows an exponential distribution P(t) ∼ exp(–t/τ) with a characteristic time scale τ (6). Here, we ask whether the same type of distributions describe durations of wake and sleep episodes in other mammals and how parameters of these distributions change across species.
Methods
We analyze durations of sleep and wake episodes in mice, rats, cats, and humans during the inactive/sleep periods of each species. The sleep and wake states are scored based on electroencephalography (EEG), electromyography (EMG), and electrooculography (EOG) recordings. We follow traditional experimental conditions and scoring criteria as described in refs 7–10. We map our data onto a two-state format and consider all sleep stages as a single sleep state. Our database consists of the following polysomnographic recordings: (i) Five 24-hour recordings from five adult male C57BL6/J mice (age 3 months), with 12-hour periods of light starting at 7 a.m.; (ii) twelve 24-hour recordings from six adult male Sprague–Dawley rats (age 2–3 months; one to three recordings per animal) with 12-hour periods of light starting at 7 a.m.; (iii) nine 8-hour recordings from nine adult male cats (age 9–16 months) starting at 9 a.m. with 12-hour periods of light starting at 7 a.m.; and (iv) 52 nocturnal sleep recordings from 52 human subjects (age 25 ± 5 years; from the SIESTA project in ref. 11). For mice and rats, we analyze the data between 7 a.m. and 7 p.m., corresponding to the inactive period.
Results
The sleep patterns of cats and rodents differ substantially from those of humans. An adult cat spends two-thirds of its time sleeping, mainly in short periods scattered throughout 24 hours. Mice and rats are nocturnal and exhibit a significant rhythm of consolidated wakenings with periods of 2–4 hours (Fig. 1).
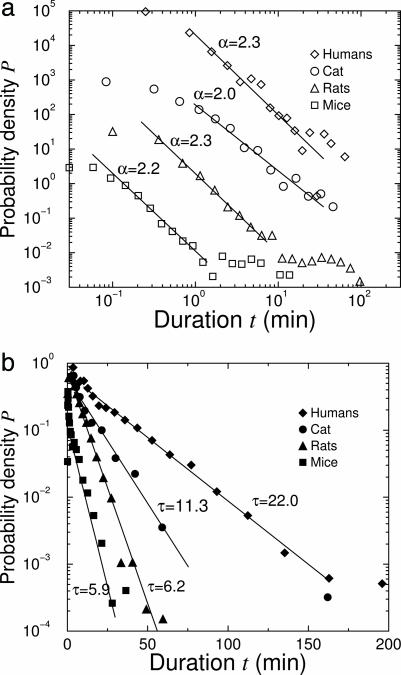
Despite these different sleep–wake patterns, we find that all four species share similar features, i.e., the distributions of the wake and sleep episode durations for mice, rats, and cats are very similar to those of humans. Specifically, we find that wake episode durations follow a power-law distribution with an exponent α = 2.2 ± 0.3 (group average ± SD) for mice, α = 2.3 ± 0.2 for rats, and α = 2.0 ± 0.3 for cats (Fig. 2a). Further, our analysis shows that these exponent values are almost identical to the exponent value of α = 2.3 ± 0.3 for the human subjects in our database. To verify that the distribution of durations of the wake state is better fit by a power law than by any other functional form, we use the Levenberg–Marquardt method. Specifically, we find that both the exponential and the stretched exponential forms lead to worse fits. In sharp contrast, we find that sleep episode durations follow exponential distributions with characteristic time scales τ = 5.9 ± 0.8 min (group average ± SD) for mice, τ = 6.2 ± 1.0 min for rats, and τ = 11.3 ± 2.0 min for cats (Fig. 2b). These values are significantly different from the time scale τ = 22.0 ± 3.0 min that we observe for human subjects.
Fig. 2.
Distributions of wake and sleep episode durations for mice, rats, cats, and humans. (a) Double-logarithmic plot for the distributions of the duration of wake episodes. Curves are vertically offset for clarity. All distributions form parallel straight lines, indicating that wake episode durations for all species closely follow a power-law behavior characterized by almost identical exponents α. (b) Semilogarithmic plot for distributions of sleep durations. Curves are vertically scaled so that they all start from P = 1. All distributions form straight lines with different slopes, indicating that all species follow an exponential distribution with a different value of characteristic time constants τ.
We further observe a hump-like tail for the distribution of wake episode durations of mice and rats at large time scales (t > 2 min for mice and t > 10 min for rats; see Fig. 2a). This structural feature may be caused by the pronounced rhythm of consolidated wakefulness associated with physical activity in mice and rats (Fig. 1 c and d).
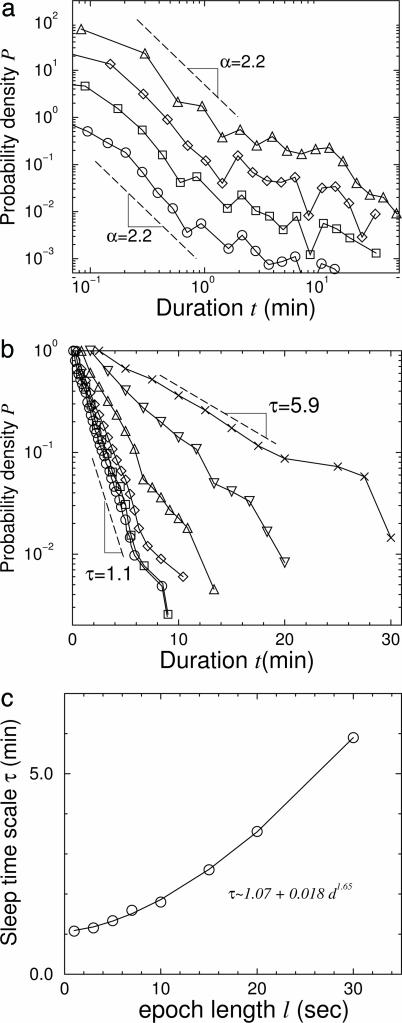
We note that estimates of the values of α and τ may change because of the difference between the length of epochs used in the sleep stage scoring for different species. We therefore perform additional procedures to validate our results based on identical epoch lengths. Sleep stages usually are scored by partitioning a sleep recording into nonoverlapping epochs of equal length. A single sleep stage is assigned for each epoch. If more than one sleep stage occurs within an epoch, the sleep stage that takes up the greatest portion of the epoch is scored as the stage for the whole epoch. Because of differences in the experimental designs, the length ℓ of the scoring epochs is often different for different species (in our database we have for humans: ℓ = 30 s; cats: ℓ = 10 s; rats: ℓ = 12 s; and mice: ℓ = 1 s). To assess the influence of varying epoch lengths on the outcome of our analysis, we score mouse data by using different epoch lengths ranging from ℓ = 1 s to ℓ = 30 s, and we plot the power-law exponent α and the exponential time scale τ as a function of ℓ. We find that the exponent α for the wake episode durations is independent of the ℓ. However, the time scale τ for the sleep episode durations varies with ℓ, i.e., τ = a + bℓc, where a, b, and c are parameters depending on the species (Fig. 3). This relation between τ and the epoch length ℓ allow us to estimate values of τ for different ℓ, enabling a comparison of τ for different species based on the same epoch length. We find the same functional form for the relationship between τ and ℓ for rat and cat data as well. Because our human data are scored by using epochs of ℓ = 30 s, following the well established Rechtschaffen and Kales' criteria (10), the values of τ for mice, rats, and cats shown in Fig. 2a are obtained after rescaling the x axis of the different species to account for an identical scoring epoch of ℓ = 30 s.
Fig. 3.
Dependence of the value of the characteristic time scale τ of sleep episodes and the power-law exponent α of wake episodes on the length of the scoring epoch. (a) Distributions of wake episode durations of mice obtained for different epoch lengths ℓ. Curves from top to bottom correspond to ℓ = 10 s (▵), ℓ = 5 s(⋄), ℓ = 3 s(□), and ℓ = 1 s(○) and are vertically offset for clarity. Dashed lines indicate power-law curves with an exponent α = 2.2. The power-law exponent α of the distribution of wake durations remains unchanged when the data are rescored by using different epoch lengths ℓ, thus confirming the validity of our results in Fig. 2a, where data from different species are scored by using different ℓ. (b) Distributions of sleep episode durations of mice obtained for different epoch lengths ℓ. Curves from top to bottom correspond to ℓ = 30 s(×), ℓ = 20 s(▿), ℓ = 10 s(▵), ℓ = 5 s(⋄), ℓ = 3 s (□), and ℓ = 1 s(○) and are vertically scaled so that they all start from P = 1. We find that the exponential characteristic time τ in the distribution of sleep episode durations increases with the epoch length ℓ.(c) Dependence of τ on ℓ for mouse data. We perform the same analysis for rats and cats and find the same functional form. We use this functional form to estimate the time scale of τ corresponding to the same epoch length ℓ for different species. The curves shown in Fig. 2b are rescaled in the x axis to match values of τ based on ℓ = 30 s.
Discussion
The presence of power-law behavior at small time scales followed by a hump-like tail at large time scales in mice and rats (Fig. 2a) suggests that short and long awakenings in these species most likely are governed by two different dynamics: (i) long, periodic awakenings governed by the homeostatic sleep drive (3, 12), and (ii) the power-law behavior of short awakenings driven by short-term nonperiodic fluctuations in the interactions of sleep- and wake-promoting neurons (1, 2). Finding a power-law behavior for the distributions of wake durations suggests a scale-invariant dynamic that is typical for fractal-like phenomena observed in systems undergoing phase transitions or self-organized criticality, where fluctuations over a broad range of scales play an important role (13, 14).
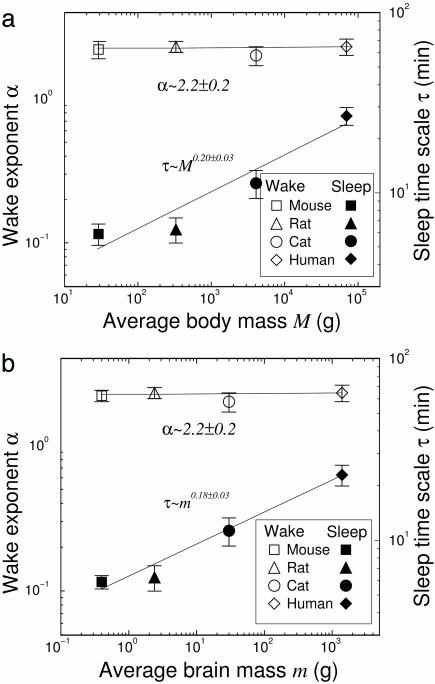
The exponential behavior for the distribution of sleep episode durations suggests a dynamical process with a characteristic time scale τ, which varies for different species. Because τ represents the inherent time scale of the neural network controlling the sleep–wake transitions, and the scale of this network may vary across species, we next investigate how τ correlates with the body or brain mass of the species. We find that τ increases with both brain and body mass for all four species studied (Fig. 4). This finding suggests that the time scale of the neural network regulating the sleep process is smaller in the smaller species. Perhaps smaller species switch from sleep to wake more quickly because they need to monitor their environment more frequently. Furthermore, previous studies have shown that (i) the total sleep time of a species correlates with its basal metabolic rate (15), and that (ii) the basal metabolic rate R follows a power-law behavior with the body mass M of the species R ∝ M0.75 (16, 17), giving the basal metabolic rate per unit body mass r = R/M ∝ M–0.25. Our empirical estimate for the sleep characteristic time τ suggests the possibility that τ ∝ M0.2±0.03 (Fig. 4a). Substituting M with r, we obtain τ ∝ r–0.8±0.1, or 1/τ ∝ r0.8±0.1, indicating that the rate (1/τ) of transitions from sleep to wake is positively correlated with the metabolic rate per unit body mass r. We note that more data sets and more species are needed to reliably determine the functional form of the relation between τ and the body or brain mass of the species.
Fig. 4.
Dependence of the power-law exponent α for wake durations and the exponential time scale τ for sleep durations on the size of species. We compare α and τ with average body mass (a) and average brain mass (b) of species. The exponent α remains the same across species, whereas the time scale τ increases with the size of the species. Average brain mass data are taken from ref. 18.
In contrast, we find that the exponent α characterizing the power-law behavior of the wake episode durations does not change with the body or brain mass of the species (Fig. 4). This finding indicates that brief awakenings from sleep are controlled by species-independent mechanisms in the sleep–wake neural networks. These mechanisms might be related to the species-independent structural characteristics of the neural networks, the nature of the fluctuations around the sleep–wake transitional threshold, or other neurophysiologic features independent of species size.
We note that our findings of that scale-invariant behavior for the wake episode durations and exponential behavior for the sleep episode durations resemble the dynamics of certain physical systems exhibiting self-organized criticality. Such systems are characterized by recurring avalanches (excitations from a “quiet” state) triggered by the accumulation of incoming energy (13, 14). The durations of avalanches follow a scale-invariant power-law distribution with an exponent independent of the specific system parameters, whereas the quiet (interavalanche) periods are exponentially distributed (19), with a characteristic time scale depending on the system size and the rate of energy inputs. In the context of sleep–wake transitions, internal and external inputs may excite wake-promoting neurons, leading to brief awakenings with power-law characteristics remaining the same across species. Recent empirical studies also have reported power-law behavior in the size and duration of neural excitations in cortical networks (20). In contrast, the sleep (quiet) episodes exhibit a characteristic time scale that depends on the species size or on the energy consumption of the neurons (metabolic rate per unit mass) in the network responsible for sleep–wake transitions.
Our observations reveal an unexpected richness in the dynamics of sleep and wake control; they suggest that brief awakenings from sleep are not simply random disruptions of the sleep process but rather are related to the underlying mechanisms of sleep control and exhibit robust scale-invariant features across different mammalian species. Further, our findings provide a dynamical concept for these mechanisms and can facilitate the development of neural circuit models that can predict and interpret data obtained in studies of the neuronal regulation of sleep and wakefulness.
Acknowledgments
We thank T. Mochizuki for providing mouse data (National Institutes of Health Grants MH62589 and HL02013) and the SIESTA project (funded by the European Commission DG XII, as Biomed-2 project BMH4-CT97-2040) for providing human sleep recordings. We thank L. Dauphin for the cat data and R. McCarley for advice on the manuscript [National Institute of Mental Health Grant 39683 and Veterans Affairs merit award (to R.E.S.)]. We also thank A. L. Goldberger for discussions. This work was supported by National Institutes of Health/National Center for Research Resource Grants P41 RR 13622, HL071972, and HL079046.
References
- 1.Saper, C. B., Chou, T. C. & Scammell, T. E. (2001) Trends Neurosci. 12, 726–731. [DOI] [PubMed] [Google Scholar]
- 2.Pace-Schott, E. F. & Hobson, J. A. (2002) Nat. Rev. Neurosci. 3, 591–605. [DOI] [PubMed] [Google Scholar]
- 3.Borbely, A. A. & Achermann, P. (1999) J. Biol. Rhythms 14, 557–568. [DOI] [PubMed] [Google Scholar]
- 4.Dijk, D.-J. & Kronauer, R. E. (1999) J. Biol. Rhythms 14, 569–583. [DOI] [PubMed] [Google Scholar]
- 5.Halász, P., Terzano, M., Parrino, L. & Bódizs, R. (2004) J. Sleep Res. 13, 1–23. [DOI] [PubMed] [Google Scholar]
- 6.Lo, C.-C., Nunes Amaral, L. A., Havlin, S., Ivanov, P. Ch., Penzel, T., Peter, J.-H. & Stanley, H. E. (2002) Europhys. Lett. 57, 625–631. [Google Scholar]
- 7.Lu, J., Greco, M. A., Shiromani, P. & Saper, C. B. (2000) J. Neurosci. 20, 3830–3842. [DOI] [PMC free article] [PubMed] [Google Scholar]
- 8.Mochizuki, T., Crocker, A., McCormack, S., Yanagisawa, M., Sakurai, T. & Scammell, T. E. (2004) J. Neurosci. 24, 6291–6300. [DOI] [PMC free article] [PubMed] [Google Scholar]
- 9.Porkka-Heiskanen, T., Strecker, R. E. & McCarley, R. W. (2000) Neuroscience 99, 507–517. [DOI] [PubMed] [Google Scholar]
- 10.Rechtschaffen, A. & Kales, A., eds. (1968) A Manual of Standardized Terminology, Techniques, and Scoring System for Sleep Stages of Human Subjects (Brain Information Service/Brain Research Institute, Univ. of California, Los Angeles).
- 11.Klösch, G., Kemp, B., Penzel, T., Schlögl, A., Rappelsberger, P., Trenker, E., Gruber, G., Zeitlhofer, J., Saletu, B., Herrmann, W. M., et. al. (2001) IEEE. Eng. Med. Biol. 20, 51–57. [DOI] [PubMed] [Google Scholar]
- 12.Panda, S., Hogenesch, J. B. & Kay, S. A. (2002) Nature 417, 329–335. [DOI] [PubMed] [Google Scholar]
- 13.Bak, P., Tang, C. & Wiesenfeld, K. (1988) Phys. Rev. Lett. 38, 364–374. [DOI] [PubMed] [Google Scholar]
- 14.Bunde, A. & Havlin, S., eds. (1994) Fractals in Science (Springer, Berlin).
- 15.Zepelin, H. (2000) in Principles and Practice of Sleep Medicine, eds. Kryger, M. H., Roth, T. & Dement, W. C. (Saunders, Philadelphia).
- 16.Brown, J. H. & West, G. B. (2000) Scaling in Biology (Oxford Univ. Press, New York).
- 17.Andresen, B., Shiner, J. S. & Uehlinger, D. E. (2002) Proc. Natl. Acad. Sci. USA 99, 5822–5824. [DOI] [PMC free article] [PubMed] [Google Scholar]
- 18.Stephan, H., Frahm, H. & Baron, G. (1981) Folia Primatol. 35, 1–29. [DOI] [PubMed] [Google Scholar]
- 19.Sánchez, A., Newman, D. E. & Carreras, B. A. (January 29, 2002) Phys. Rev. Lett. 88, 10.1103/PhysRevLett.88.068302. [DOI] [PubMed]
- 20.Beggs, J. M. & Plenz, D. (2003) J. Neurosci. 23, 11167–11177. [DOI] [PMC free article] [PubMed] [Google Scholar]


