Abstract
Intra-procedural contrast-enhanced CT (CECT) has been proposed to evaluate treatment efficacy of thermal ablation. We hypothesized that contrast material delivered concurrently with thermal ablation may become trapped in the ablation zone, and set out to determine whether such an effect would impact ablation visualization. CECT images were acquired during microwave ablation in normal porcine liver with: (A) normal blood perfusion and no iodinated contrast, (B) normal perfusion and iodinated contrast infusion or (C) no blood perfusion and residual iodinated contrast. Changes in CT attenuation were analyzed from before, during and after ablation to evaluate whether contrast was trapped inside of the ablation zone. Visualization was compared between groups using post-ablation contrast-to-noise ratio (CNR). Attenuation gradients were calculated at the ablation boundary and background to quantitate ablation conspicuity. In Group A, attenuation decreased during ablation due to thermal expansion of tissue water and water vaporization. The ablation zone was difficult to visualize (CNR = 1.57±0.73, boundary gradient = 0.7±0.4 HU/mm), leading to ablation diameter underestimation compared to gross pathology. Group B ablations saw attenuation increase, suggesting that iodine was trapped inside the ablation zone. However, because the normally perfused liver increased even more, Group B ablations were more visible than Group A (CNR = 2.04±0.84, boundary gradient = 6.3±1.1 HU/mm) and allowed accurate estimation of the ablation zone dimensions compared to gross pathology. Substantial water vaporization led to substantial attenuation changes in Group C, though the ablation zone boundary was not highly visible (boundary gradient = 3.9±1.1 HU/mm). Our results demonstrate that despite iodinated contrast being trapped in the ablation zone, ablation visibility was highest when contrast is delivered intra-procedurally. Therefore, CECT may be feasible for real-time thermal ablation monitoring.
1. INTRODUCTION
Thermal ablation is a treatment for patients with small hepatocellular carcinomas and other focal tumors that may be refractory to surgery (Tanaka et al 1996, Lu et al 2005, Liang et al 2009). An ablation procedure involves placing a thin applicator into the targeted tumor (Goldberg 2001, Haemmerich 2010, Brace 2010, Brace et al 2005) or applying focused energy to destroy the target tissue (Malcolm and Haar 1996, Kennedy et al 2004) under imaging guidance. Tumor cells are destroyed by cytotoxic temperature changes induced via energy delivery around the target zone.
Imaging feedback is typically used to monitor ablation zone growth during the procedure, and then post-procedure to evaluate treatment response. Ultrasound imaging can be utilized during the procedure, but is inhibited by signal dropout due to bubbles produced during high-temperature ablation and is generally limited to a single imaging plane (Leyendecker et al 2002, Solbiati et al 2004). Contrast-enhanced CT imaging (CECT) and magnetic resonance imaging (MRI) are commonly employed for post-ablation imaging, but the expense associated with MRI and a relative lack of MRI-compatible ablation devices precludes its use for intra-procedural monitoring in most ablation procedures today (Chopra and III 2001, Lu et al 2007, Wile et al 2007). CT, MRI and US thermometry techniques have also been investigated but are not widely available and, in addition to the drawbacks noted above, can have limited spatial and temporal resolution or temperature accuracy (Varghese et al 2002, Winter et al 2015, Schena et al 2013, Bruners et al 2012, Wile et al 2007, Senneville et al 2007). Therefore, contrast-enhanced CT remains the predominant post-ablation imaging technique.
While the radiation exposure associated with serial CT imaging has been of concern for intra-procedural scanning, recent studies have also suggested the feasibility of using dose reduction techniques to facilitate thermal ablation monitoring (Brace et al 2009). Iodinated contrast material can be injected intravenously to highlight regions with blood perfusion, rendering the unperfused ablation zone more identifiable (Ahmed et al 2011). However, it is unclear whether iodine delivered during ablation might be retained during tissue coagulation. It is plausible that early hyperthermia will increase local perfusion and potentially bring a greater amount of iodinated contrast material into the ablation (Patterson and Scudamore 1998, Shibata et al 2000, Wright et al 2005). When temperatures elevate beyond the threshold needed for coagulation, we hypothesized that material may be trapped and reduce imaging contrast with the enhancing adjacent tissue. The purpose of this study was to determine whether iodinated contrast material delivered concurrently with thermal ablation is trapped in the ablation zone, and evaluate whether such trapping might preclude the use of CECT to monitor thermal ablation growth in real-time.
2. Material and Method
2.1. In-vivo Ablation Procedure
Microwave ablations were created in the livers of four swine using a 2.45 GHz microwave generator (Certus 140 ; NeuWave Medical Inc., Madison, WI) and triaxial antenna (LK 15; NeuWave Medical Inc., Madison, WI). The antenna was placed transverse to the CT scanner imaging plane. Generator output was 100 W for 5 min. Three contrast material delivery protocols were evaluated sequentially in each animal: (A) no contrast material (control), (B) ablation with iodinated material delivered by blood perfusion, and (C) ablation in an unperfused, iodine-laden liver. In Group B, a 40 ml bolus of iodinated contrast (300 mg/ml iohexol; GE Healthcare, Waukesha, WI) was injected 1 min before ablation and then contrast was infused continuously at 0.3 ml/s to maintain a similar level of enhancement in the perfused liver during the procedure. In Group C, a 50 ml bolus was injected concurrently with the euthanasia solution, and then contrast was infused at 2 ml/s until cessation of heart rhythm to saturate the liver before perfusion ceased. One or two samples of each protocol were collected in each animal, for a total of five samples per group.
2.2. Image Processing
Pre- and post-ablation CT volumes were acquired before and after ablation by using a thin-slice protocol (0.625 mm thickness, 120 kVp, 250 mA; GE 750 HDCT). Intra-ablation CT volumes were acquired at 15 s intervals during each ablation by using a low-dose protocol (0.625 mm thickness, 80 kVp, 80 mA; GE 750 HDCT). The scanning range of all CT volumes extended to at least 3 cm beyond the tip of the antenna. Breath holds were used to reduce motion artifacts.
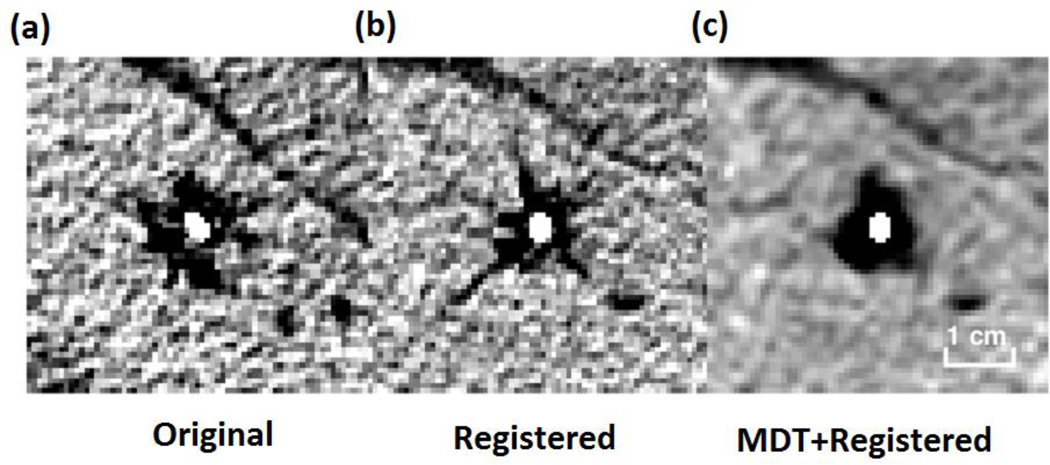
CT data pre-processing was performed in two steps: co-registration of time series, and metal artifact reduction. CT volumes were co-registered according to the location and the angle of the antenna using rigid transformation (June et al 2012). All CT volumes were registered to the first volume in the time series. Metal artifacts were reduced slice-by-slice by forward projecting each image, replacing the metal attenuation data in the sinogram using sparse interpolation, then back projecting the result (Veldkamp et al 2010, Garcia 2010, Boas and Fleischmann 2012) (Figure 1).
Figure 1.
The example result for registration and MDT: (a) Original CT image, (b) registered image, (c) MDT for registered image. All figures are equal scale.
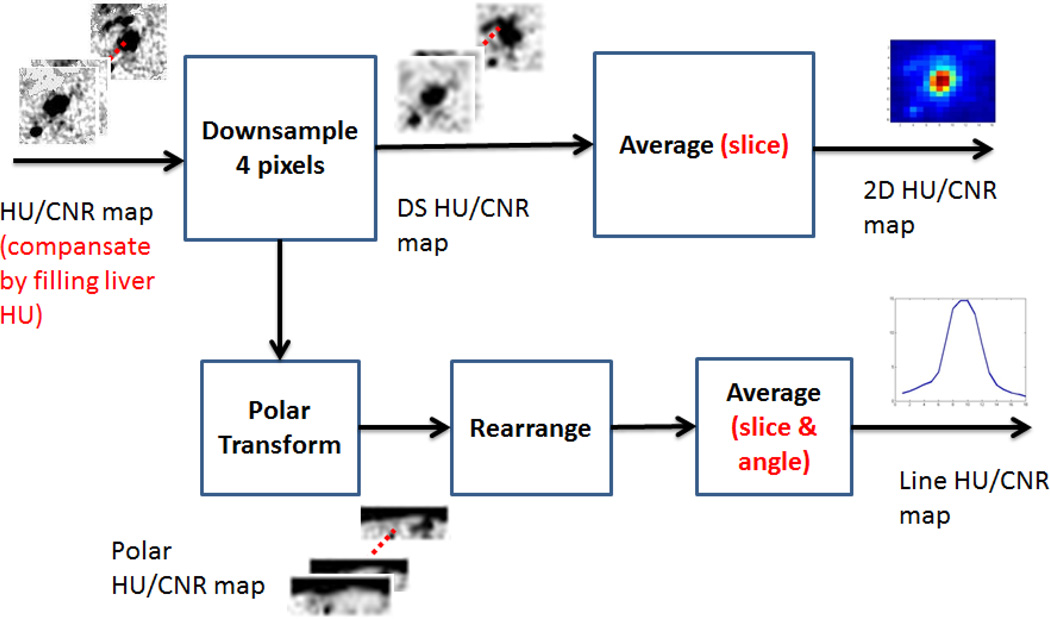
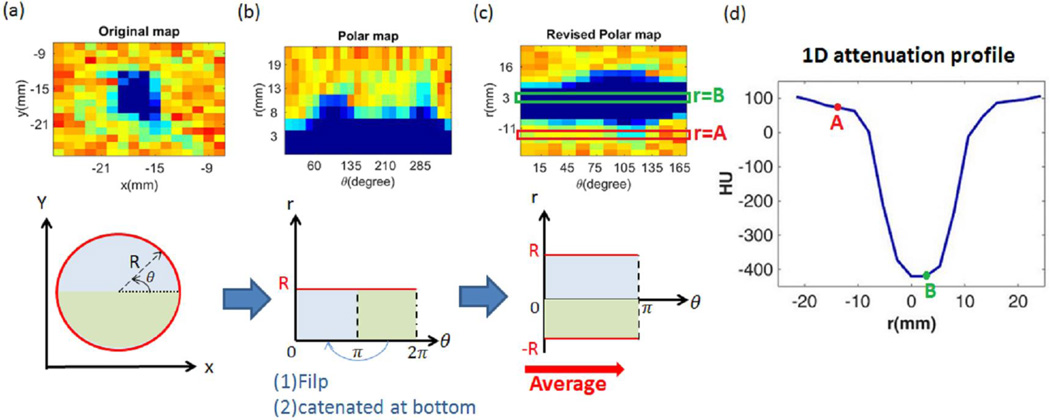
A volumetric region of interest (64×64×11 pixels ROI) was manually selected over the central ablation in each CECT volume. Any background air pixels were filled with the mean attenuation of liver to eliminate their statistical influence on post-processing. Each slice was then down-sampled by 4× using neighborhood averaging. Each downsampled, cropped volume was then projected into the axial plane using average intensity projection (AIP) to create a two-dimensional cross-section of the ablation zone in Hounsfield units (HU) noted as the “2D attenuation map” (Figure 2). To more generally evaluate attenuation changes over time, each down-sampled slice was converted into a one-dimensional dataset by using a polar transformation with averaging over the angular domain. The resulting profile was noted as the “1D attenuation profile” (Figure 3).
Figure 2.
Analysis flow chart to produce the average intensity projection (AIP, upper track) and 1D angle-averaged attenuation map (lower track) for each CT volume.
Figure 3.
Data projection into a polar coordinate system. The upper part of (a) to (c) display the example result at each stage. The original data (a) were first cast into polar coordinates (b). Attenuation was then reformed in “diameter to angle” map (c). All the pixels at each diametric position, like the regions at r =A and r =B in the map, were averaged over the angular domain to produce the 1-D attenuation profile (d).
2.3. Post-Ablation Analysis
Contrast material kinetics were analyzed through changes in the 2D and 1D attenuation maps. Pre-ablation ablation maps were subtracted from post-ablation maps for Group A, B and C. In addition, ablation zone visibility was quantified as the contrast-to-noise ratio (CNR):
| (1) |
where μabl is the pixel intensity in the downsampled, cropped slice in each group, μliver is the mean attenuation of the background liver, and σbackground is the image noise calculated as the standard deviation of attenuation in the background air.
Each ablation diameter was measured at gross pathology after sectioning the ablation zone along the antenna tract. Three distinct regions were selected for analysis: (1) central ablation zone: pixels less than 5mm from ablation center, (2) peripheral ablation zone: pixels between the central ablation zone and ablation boundary, and (3) background: pixels outside the estimated ablation zone. The mean attenuation and CNR of each region was computed for each sample. The mean and standard error was used to analyze the general effect from ablation and contrast delivery on each region. The unpaired two-sample T-test was used to examine statistical significance of attenuation change between pre- and post-ablation data.
2.4. Ablation Zone Sharpness Analysis
A post-ablation image with good ablation zone sharpness has two characteristics: (1) a high ablation zone shape similarity between radiological and pathological data, and (2) a high level of attenuation contrast across the ablation boundary (Nghiem et al 2002, Hong et al 2015). To compare the shape between radiological and pathological image, the radiological ablation zone was manually segmented slice by slice in each sample. The equivalent circular diameter of each segmentation, which is widely used in morphometric analysis (Boskamp et al 2004, Rajagopalan and Richard 2006), was calculated by the following formula,
| (2) |
where A is the area of the segmentation. The maximal equivalent diameter in each sample was subtracted from the corresponding pathological diameter to represent shape similarity.
The radial attenuation gradient across the post-ablation boundary was also calculated to indicate edge sharpness (Rangayyan and Elkadiki 1995, Feichtenhofer et al 2013). The radial gradient was calculated from the horizontal and vertical derivative in pixel attenuation values by the following formula:
| (3) |
where Dx and Dy was approximated by the central difference of statistics along with horizontal and vertical direction:
| (4) |
| (5) |
and r is the distance from (i,j) to image center. The result was rescaled to actual distance in millimeters so that the boundary gradient is in units of HU/mm. The mean boundary gradient was then compared to background liver by unpaired two-sample t-test, with higher values indicating greater boundary clarity.
2.5. Temporal analysis
To analyze the attenuation variation over time in each group, 1D cross section attenuation profiles were evaluated at each time point. Profiles on specific locations belonging to the central ablation zone (radial distance=3 mm, 5 mm), peripheral ablation zone (radial distance=8 mm, 11 mm; 13 mm and 16 mm for group C) and background (radial distance=13 mm and 16 mm for group A & B, 19 mm and 21 mm) were averaged across samples to elucidate attenuation variation during the entire procedure.
3. Results
3.1 Post-ablation Analysis
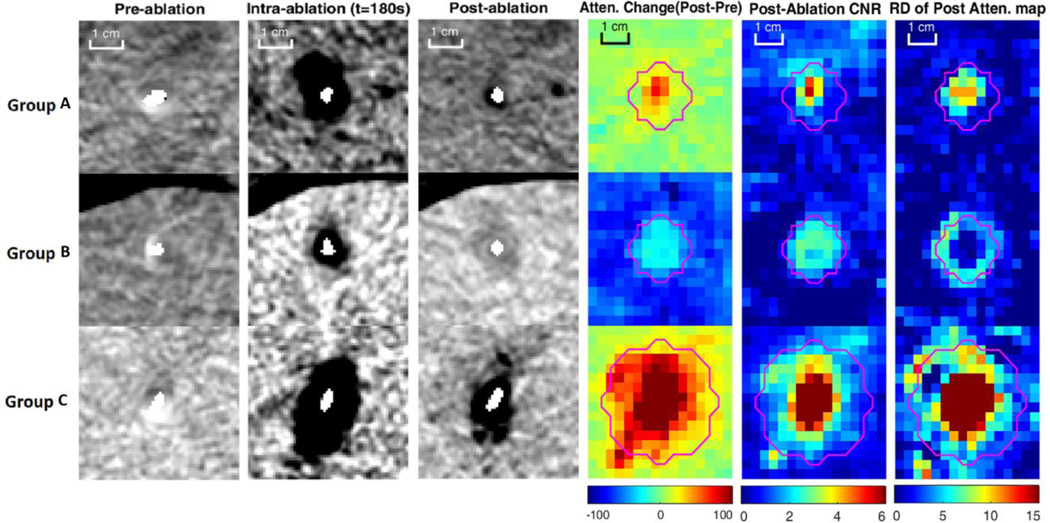
In Group A, attenuation in the central ablation zone decreased from 54.3±8.9 HU (pre-ablation, mean ± standard error of mean) to 3.3±27.2 HU (P = .100). Visual inspection of the CT images showed marked water vaporization in the central zone (Figure 4). A smaller change in attenuation was noted in the peripheral ablation zone (54.7±4.9 HU pre compared to 40.3±3.5 HU post; P = .045). The attenuation of background liver was relatively unchanged (Table 1). Due to the subtle changes at the ablation periphery, the ablation zone was not highly visible in Group A. The mean CNR over the entire ablation was 1.57±0.73, but this was heavily influenced by large attenuation changes in the central zone (3.73±2.17; Table 2).
Figure 4.
Example results of pre, intra and post ablation and the mean statistics for each group. Pink line is “observed ablation boundary”. The increasing attenuation inside the ablation zone of group B indicated the trapping of iodine material. The high post CNR region correlated well with the observed boundary, and the boundary was salient due to high spatial attenuation contrast to normal liver. Without blood perfusion in group C, the ablation zone was large with more gas region, making contribution to high post CNR and post-attenuation gradient magnitude inside ablation zone. However, no iodine material was trapped inside the region, causing similar attenuation decreased as group A.
TABLE 1.
Mean attenuation of central, peripheral, entire ablation zone and background for pre-ablation, post-ablation and difference (Post-Pre). Data provided as mean±standard error. Cen.=Central, Peri.=Peripheral, B.G=Background
| Group A | Group B | Group C | |||||||
|---|---|---|---|---|---|---|---|---|---|
| Pre | Post | Diff. | Pre | Post | Diff. | Pre | Post | Diff. | |
| Cen. | 54.3±8.9 | 3.3±27.2 | −51.0±26.0 | 53.7±4.7 | 78.4±7.9 | 24.7±8.7 | 143.5±14.3 | −200.8±80.9 | −344.2±82.0 |
| Peri. | 54.7±4.9 | 40.3±3.6 | −14.3±5.0 | 51.4±4.2 | 89.7±5.2 | 38.3±5.2 | 139.9±9.7 | 74.4±14.2 | −65.5±10.8 |
| Entire | 54.7±5.5 | 34.6±7.3 | −20.1±7.7 | 51.9±4.3 | 86.6±5.4 | 34.7±6.0 | 140.2±9.9 | 57.4±17.4 | −82.9±14.6 |
| B.G | 50.5±2.4 | 46.1±2.9 | −4.4±2.5 | 50.8±2.8 | 115.5±4.5 | 64.7±3.9 | 140.0±10.2 | 122.1±9.9 | −17.9±2.3 |
TABLE 2.
Mean CNR of central, peripheral, entire ablation zone and background for pre-ablation, post-ablation. Data provided as mean±standard error.
| Group A | Group B | Group C | ||||
|---|---|---|---|---|---|---|
| Region | Pre | Post | Pre | Post | Pre | Post |
| Central | 0.14±0.78 | 3.73±2.17 | 0.12±0.30 | 2.54±1.04 | −0.05±0.15 | 13.19±4.49 |
| Peripheral | 0.15±0.41 | 1.16±0.43 | 0.33±0.27 | 1.87±0.80 | 0.15±0.07 | 2.63±0.67 |
| Entire | 0.14±0.48 | 1.57±0.73 | 0.28±0.27 | 2.04±0.84 | 0.13±0.06 | 3.28±0.88 |
| Background | 0.44±0.10 | 0.78±0.33 | 0.41±0.18 | 0.21±0.27 | 0.22±0.15 | 0.92±0.36 |
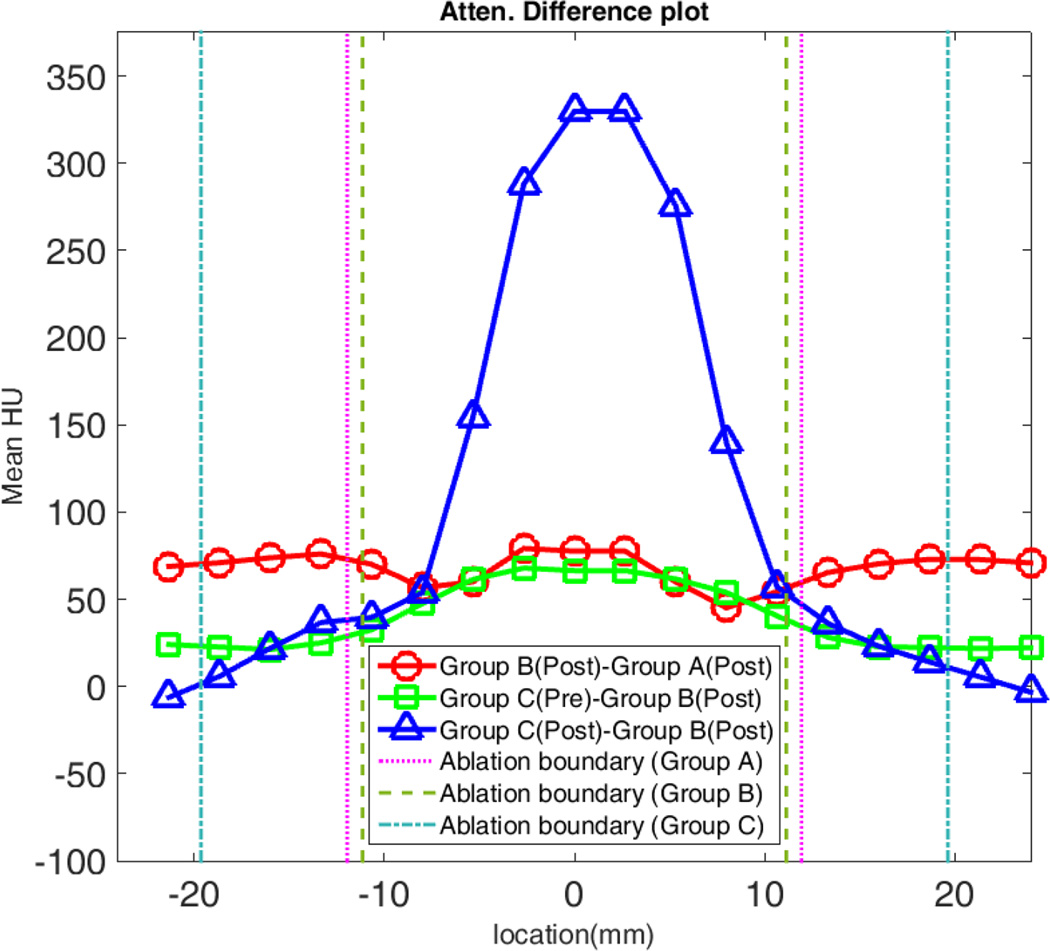
By contrast, attenuation increased from 51.9±4.3 HU pre to 86.6±5.4 HU (P < .001) post in Group B, suggesting that iodinated contrast was drawn into and trapped inside the ablation zone. The background liver attenuation increased even more (50.8±2.8 HU to 115.5±4.5 HU; P<0.0001). Ablations were much more visible in Group B compared to Group A, with an overall CNR of 2.04±0.84 and peripheral CNR of 1.87±0.80 (Table 2). Similarly, the ablation zone attenuation was 64.5±21.6 HU higher in Group B compared to Group A, again implying that contrast material was trapped during Group B ablations (Figure 5). The attenuation difference between these two groups was higher near the center than the periphery since the central attenuation decreased more after ablations in Group A (Table 1).
Figure 5.
Comparison of attenuation profile changes. Positive values for Group B – Group A indicate contrast was trapped inside of the ablation zone. However, the positive difference between Group C pre-ablation (enhanced normal liver) and Group B post-ablation demonstrates that the ablation zone is still hypodense compare to background liver.
Group C ablation zones were larger than in Groups A or B. Diameters measured at gross pathology in Groups A, B and C were 23.9±1.2 mm, 22.3±1.8 mm, and 39.3±1.7 mm, respectively (Table 3). Attenuation decreased in the contrast-laden Group C livers during ablation (140.2±9.9 HU pre compare to 50.4±17.4 HU post; P = .002). Anecdotally, substantially greater water vapor was also noted in Group C ablations (Figure 4). The greater vapor generation and water expansion also resulted in highest visibility among all groups. However, gas in the central zone provided more to visibility than water expansion in the periphery (overall CNR=3.28±0.88, central CNR=13.19±4.49, peripheral CNR=2.63±0.67).
TABLE 3.
Mean equivalent diameter and diameter difference of pathological and radiological ablation zone and P-value (in mm). Data provided as mean±standard error.
| Group | Pathological | Radiological | Difference | P-value |
|---|---|---|---|---|
| Group A | 23.9±1.2 | 18.6±0.5 | −5.3±1.3 | P<0.01* |
| Group B | 22.3±1.8 | 22.6±1.1 | 0.3±0.9 | P=0.89 |
| Group C | 39.3±1.7 | 32.9±2.1 | −6.4±2.8 | P=0.03* |
:Statistical significance
3.2 Ablation Zone Sharpness Analysis
In Group A, the post-ablation boundary gradient was small, suggesting that the ablation boundary was barely distinguishable from background liver (0.7±0.4 HU/mm; Table 4). Due to low contrast between the ablation boundary and background liver, the ablation zone was underestimated on CT (radiological diameter=18.6±0.5 mm, pathological diameter=23.9±1.2 mm, P < .01; Table 3).
TABLE 4.
Mean radial derivative on of ablation boundary (in HU\mm) and P-value. Data provided as mean±standard error of mean
| Group | R.D of Post- attenuation |
P-value(R.D) |
|---|---|---|
| Group A | 0.7±0.4 | P=0.56 |
| Group B | 6.3±1.1 | P=0.001* |
| Group C | 3.9±1.1 | P=0.46 |
:Statistical significance
In comparison with Group A, the post boundary radial derivative in Group B was large enough to distinguish the boundary from the background liver (6.3±1.1 HU/mm, P=0.001). The mean ablation diameter measured on CT was no different than the diameter measured at pathology (22.6±1.1 mm and 22.3±1.8 mm, respectively; P = .89), suggesting that even though contrast was being trapped in the ablation, the ablation zone could be precisely visualized.
In Group C, the post boundary radial derivative was higher than Group A, but the boundary was still ambiguous with a lower gradient than in Group B (3.9±1.1 HU/mm; P = .46). As a result, the Group C ablation diameters were underestimated compared to diameters measured at pathology (32.9±2.1 mm and 39.3±1.7 mm, respectively; P = .03).
3.3 Temporal Analysis
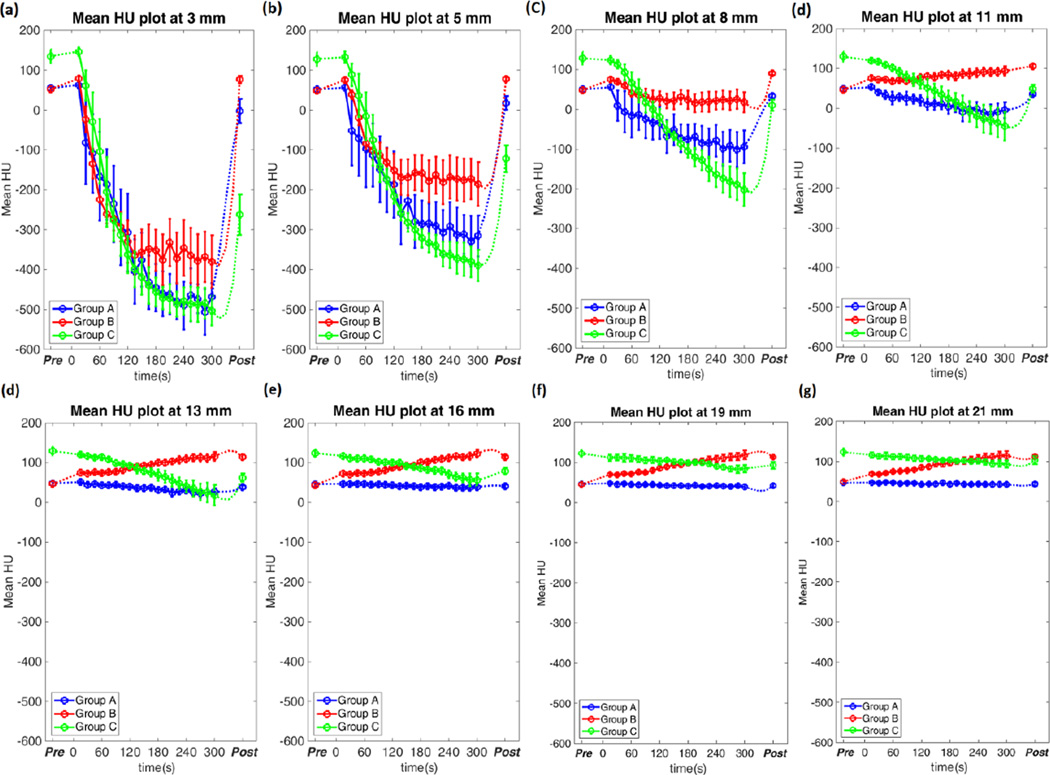
Group A ablation zone attenuation decreased monotonically over time. Attenuation dropped faster and to lower levels near the antenna compared to peripheral locations. Once microwave power was turned off and the ablation process completed, much of the lost attenuation recovered, presumably due to water vapor condensation and temperature declines (Figure 6 and Table 5). Attenuation scarcely changed outside of the ablation region.
Figure 6.
Temporal attenuation at different location in each groups. The data was shown as mean attenuation with error bars representing the standard error of mean. While the attenuation decreased over time inside ablation zone in Group A and C, the attenuation in Group B began to slow the decreasing trend at 60 seconds and keep at a certain level at 120 seconds. This suggested that the contrast agent was brought into the region at 60 seconds and trapped after 120 seconds.
TABLE 5.
Mean attenuation on specific locations at different stages during ablation procedure. Data provided as mean±standard error of mean. Beg.=Beginning, A.R=After Recovery
| Group A | ||||||||
| Stage | 3mm | 5mm | 8mm | 11mm | 13mm | 16mm | 19mm | 21mm |
| Pre | 54.9±6.9 | 51.5±5.1 | 49.8±4.7 | 48.9±4.3 | 48.0±3.6 | 46.0±3.5 | 45.3±4.3 | 46.5±4.3 |
| Beg, | 62.9±8.9 | 56.1±7.3 | 55.7±5.4 | 53.5±3.1 | 51.2±2.7 | 46.8±3.7 | 47.9±3.1 | 47.1±1.9 |
| End | −468.0±34.0 | −315.4±51.4 | −94.2±41.2 | −4.4±19.9 | 26.8±9.2 | 38.9±4.6 | 38.7±5.5 | 42.4±4.7 |
| A.R | −2.2±30.3 | 18.0±17.0 | 33.8±5.0 | 36.3±3.9 | 38.4±4.5 | 40.6±4.3 | 41.8±4.0 | 43.3±4.9 |
| Group B | ||||||||
| Stage | 3mm | 5mm | 8mm | 11mm | 13mm | 16mm | 19mm | 21mm |
| Pre | 52.4±5.4 | 48.2±4.0 | 48.4±2.9 | 46.7±3.2 | 46.2±4.1 | 40.1±6.6 | 44.5±6.3 | 49.9±3.5 |
| Beg, | 79.3±3.3 | 75.5±5.2 | 74.7±3.0 | 75.9±3.3 | 75.6±2.0 | 72.6±2.2 | 70.0±2.9 | 68.5±3.6 |
| End | −468.0±34.0 | −172.3±50.9 | 18.0±25.3 | 94.0±12.0 | 115.9±10.9 | 122.9±9.7 | 118.6±10.8 | 114.5±11.2 |
| A.R | 76.9±9.1 | 78.0±4.9 | 90.5±4.0 | 106.4±5.6 | 114.3±6.2 | 114.3±4.1 | 112.8±2.5 | 112.1±4.5 |
| Group C | ||||||||
| Stage | 3mm | 5mm | 8mm | 11mm | 13mm | 16mm | 19mm | 21mm |
| Pre | 135.0±17.2 | 127.9±17.1 | 128.5±15.7 | 130.3±12.2 | 129.8±11.2 | 124.2±9.3 | 122.2±8.7 | 123.4±9.4 |
| Beg, | 146.7±10.9 | 132.5±14.1 | 123.5±10.6 | 120.2±5.3 | 119.7±4.8 | 116.6±7.9 | 111.9±8.1 | 115.8±7.0 |
| End | −502.5±37.2 | −389.3±39.2 | −202.0±41.3 | −44.5±36.4 | 18.3±25.8 | 56.6±16.4 | 84.3±9.5 | 93.2±9.2 |
| A.R | −262.1±50.6 | −122.0±33.7 | 10.3±13.8 | 49.7±10.2 | 62.5±10.4 | 79.3±7.4 | 92.7±8.8 | 103.1±10.1 |
Attenuation in Group B also decreased in most regions, but the rate of change slowed after 60–120 s, eventually flattening out at −361±16 HU, −171±13 HU and 22±6 HU at 3mm, 5mm and 8mm from the antenna (Figure 6). Attenuation recovered once the ablation ceased, but the final attenuation was greater than the initial value due to trapped contrast material (Table 5). At locations outside ablation zone, the attenuation increased with a fixed rate due to continuous contrast infusion, but decreased after the infusion ceased as contrast was filtered from the blood (Table 5).
The attenuation of Group C ablations also decreased rapidly. The post-ablation attenuation was far beneath the pre-attenuation value due to greater water vapor expansion and a lack of perfusion to mitigate heat transfer. Like Groups A and B, attenuation also recovered once the microwave power was turned off and gas dissipated (Table 5).
4. Discussion
In this study, comparison of attenuation values inside and outside of ablations created with three difference protocols suggests that iodinated contrast material is trapped in the growing zone of thermal coagulation. However, the even greater increasing attenuation of normally perfused liver allows for sufficient attenuation contrast to appreciate the growing ablation and indicate the correct ablation boundary. The very hypodense zone of water vaporization in the central ablation zone also provides a mechanism to monitor ablation zone growth. Therefore, this study demonstrated the feasibility of using iodinated contrast material with temporal CT scanning in real time ablation monitoring.
In the temporal analysis, the rate of attenuation change inside of Group B ablations slowed about 60 seconds into the treatment, and became extremely low after 120 seconds. We hypothesize that this may be due to the presence of iodine in the ablation zone. Pixel intensity is related to a linear combination of attenuation coefficients and densities of the constituent materials (Alvarez and Seppi 1979). Prior to contrast injection, attenuation was primarily determined by the underlying water, tissue proteins, and lipids. Over the first 60 s of ablation, iodinated contrast was added to the tissue to increase attenuation. As a region coagulated, blood flow ceased and iodine was retained. As heating continued, water was vaporized and the effective attenuation decreased. Once the water vaporization process quenched, the attenuation remained increased compared to Group A due to the continued presence of iodine. Hence, iodine seemed to increase the floor level of attenuation for Group B. Once microwave power was turned off, water vapor condensed and contributed to the sudden increase in attenuation noted in each group, with greater attenuation in Group B due to the presence of iodine. In Group C, the attenuation continuously decreased during ablation, which was opposite to the trend of Group B. This may be due to greater gas generation in the unperfused liver. Blood perfusion introduces a “heat-sink” effect that mitigates heat and mass transfer so greater vaporization would be expected in tissue lacking blood flow (Goldberg et al 1998, Chang and Nguyen 2004). However, this hypothesis would need additional controlled experimentation for confirmation.
Some limitations in the study design exist. First, we used attenuation as an indirect indicator of iodine during ablation. The actual concentration of iodine in the ablated tissue was not measured directly. However, the resulting differences in attenuation provide strong evidence for trapped iodine and keep the analysis focused on the most clinically important metrics of ablation zone visualization. Our imaging-based technique also allowed us to analyze changes temporally, which would not be as feasible with a more direct chemical analysis. Secondly, we investigated the contrast agent behavior on normal porcine liver. Blood flow is known to be different in pathologic liver and tumor and therefore the changes in attenuation we observed may be different in human liver or tumor (Vaupel et al 1989). However, changing the tissue type is not likely to alter the primary conclusions of the study.
In conclusion, iodinated contrast delivery during thermal ablation was analyzed by CECT. The results showed that ablating with concurrent contrast delivery could cause some of the contrast material to be trapped in the ablation zone. However, the actual ablation zone was still highly visible on CT. Future studies will emphasize quantifying the amount of trapped iodine and analyzing the imaging technique in human patient populations.
Acknowledgments
The authors would like to acknowledge Ms. Lisa Sampson for her assistance with in-vivo experiments. Funding support was provided by National Institutes of Health (NIH) Grant NOs. R01CA149379
REFERENCES
- Ahmed M, Brace C, Jr, F L, Goldberg S. Principles of and advances in percutaneous ablation. Radiology. 2011;258:351–369. doi: 10.1148/radiol.10081634. [DOI] [PMC free article] [PubMed] [Google Scholar]
- Alvarez R, Seppi E. A Comparison of Noise and Dose in Conventional and Energy Selective Computed Tomography. IEEE Trans. Nucl. Sci. 1979;26:2853–2856. [Google Scholar]
- Boas FE, Fleischmann D. CT artifacts: causes and reduction techniques. Imaging Med. 2012;4:229–240. [Google Scholar]
- Boskamp T, Rinck D, Link F, Kümmerlen B, Stamm G, Mildenberger P. New vessel analysis tool for morphometric quantification and visualization of vessels in CT and MR imaging data sets. Radiographics. 2004;24:287–297. doi: 10.1148/rg.241035073. [DOI] [PubMed] [Google Scholar]
- Brace CL. Microwave tissue ablation: biophysics, technology, and applications. Crit. Rev. Biomed. Eng. 2010;38:65–78. doi: 10.1615/critrevbiomedeng.v38.i1.60. [DOI] [PMC free article] [PubMed] [Google Scholar]
- Brace CL, Laeseke PF, Van Der Weide DW, Lee FT. Microwave ablation with a triaxial antenna: Results in ex vivo Bovine Liver. IEEE Trans. Microw. Theory Tech. 2005;53:215–220. doi: 10.1109/TMTT.2004.839308. [DOI] [PMC free article] [PubMed] [Google Scholar]
- Brace CL, Mistretta Ca, Hinshaw JL, Lee FT. Periodic contrast-enhanced computed tomography for thermal ablation monitoring: a feasibility study. Conf. Proc. IEEE Eng. Med. Biol. Soc. 2009;2009:4299–4302. doi: 10.1109/IEMBS.2009.5333500. [DOI] [PMC free article] [PubMed] [Google Scholar]
- Bruners P, Pandeya GD, Levit E, Roesch E, Penzkofer T, Isfort P, Schmidt B, Greuter MJW, Oudkerk M, Schmitz-Rode T, Kuhl CK, Mahnken AH. CT-based temperature monitoring during hepatic RF ablation: Feasibility in an animal model. Int. J. Hyperth. 2012;28:55–61. doi: 10.3109/02656736.2011.619155. [DOI] [PubMed] [Google Scholar]
- Chang Ia, Nguyen UD. Thermal modeling of lesion growth with radiofrequency ablation devices. Biomed. Eng. Online. 2004;3:27. doi: 10.1186/1475-925X-3-27. [DOI] [PMC free article] [PubMed] [Google Scholar]
- Chopra S, III, G D. Tumor recurrence after radiofrequency thermal ablation of hepatic tumors: spectrum of findings on dual-phase contrast-enhanced CT. Am. J. 2001:381–387. doi: 10.2214/ajr.177.2.1770381. [DOI] [PubMed] [Google Scholar]
- Feichtenhofer C, Fassold H, Schallauer P. A perceptual image sharpness metric based on local edge gradient analysis. IEEE Signal Process. Lett. 2013;20:379–382. [Google Scholar]
- Garcia D. Robust smoothing of gridded data in one and higher dimensions with missing values. Comput. Stat. Data Anal. 2010;54:1167–1178. doi: 10.1016/j.csda.2009.09.020. [DOI] [PMC free article] [PubMed] [Google Scholar]
- Goldberg SN. Radiofrequency tumor ablation: Principles and techniques. Eur. J. Ultrasound. 2001;13:129–147. doi: 10.1016/s0929-8266(01)00126-4. [DOI] [PubMed] [Google Scholar]
- Goldberg SN, Hahn PF, Tanabe KK, Mueller PR, Schima W, Athanasoulis CA, Compton CC, Solbiati L, Gazelle GS. Percutaneous Radiofrequency Tissue Ablation: Does Perfusion-mediated Tissue Cooling Limit Coagulation Necrosis? J. Vasc. Interv. Radiol. 1998;9:101–111. doi: 10.1016/s1051-0443(98)70491-9. [DOI] [PubMed] [Google Scholar]
- Haemmerich D. Biophysics of radiofrequency ablation. Crit. Rev. Biomed. Eng. 2010;38:53–63. doi: 10.1615/critrevbiomedeng.v38.i1.50. [DOI] [PubMed] [Google Scholar]
- Hong CW, Chow L, Turkbey EB, Lencioni R, Libutti SK, Wood BJ. Imaging Features of Radiofrequency Ablation with Heat-Deployed Liposomal Doxorubicin in Hepatic Tumors. Cardiovasc. Intervent. Radiol. 2015 doi: 10.1007/s00270-015-1186-0. [DOI] [PMC free article] [PubMed] [Google Scholar]
- June NCT, Cui X, Li S, Kim H-I, Kwack K-S. Fast and Accurate Rigid Registration of 3D CT Images by Combining Feature and Intensity. J. Comput. Sci. Eng. 2012;6:1–11. [Google Scholar]
- Kennedy JE, Wu F, Ter Haar GR, Gleeson FV, Phillips RR, Middleton MR, Cranston D. High-intensity focused ultrasound for the treatment of liver tumours. Ultrasonics. 2004;42:931–935. doi: 10.1016/j.ultras.2004.01.089. [DOI] [PubMed] [Google Scholar]
- Leyendecker JR, Iii GDD, Halff Ga, Mccoy Va, Napier DH, Hubbard LG, Chintapalli KN, Chopra S, Washburn WK, Esterl RM, Cigarroa FG, Kohlmeier RE, Sharkey FE. Sonographically observed Echogenic Response During Intraoperative Radiofrequency Ablation of Cirrhotic Livers:Pathologic Correlation. AJR. Am. J. Roentgenol. 2002;178:1147–1151. doi: 10.2214/ajr.178.5.1781147. [DOI] [PubMed] [Google Scholar]
- Liang P, Wang Y, Yu X, Dong B. Malignant Liver Tumors: Treatment with Percutaneous Microwave Ablation—Complications among Cohort of 1136 Patients 1. Radiology. 2009;251:933–940. doi: 10.1148/radiol.2513081740. [DOI] [PubMed] [Google Scholar]
- Lu M, Yu X-L, Li A-H, Jiang T-A, Chen M-H, Zhao B-Z, Zhou X-D, Wang J-R. Comparison of contrast enhanced ultrasound and contrast enhanced CT or MRI in monitoring percutaneous thermal ablation procedure in patients with hepatocellular carcinoma: a multi-center study in China. Ultrasound Med. Biol. 2007;33:1736–1749. doi: 10.1016/j.ultrasmedbio.2007.05.004. [DOI] [PubMed] [Google Scholar]
- Lu M-D, Xu H-X, Xie X-Y, Yin X-Y, Chen J-W, Kuang M, Xu Z-F, Liu G-J, Zheng Y-L. Percutaneous microwave and radiofrequency ablation for hepatocellular carcinoma: a retrospective comparative study. J. Gastroenterol. 2005;40:1054–1060. doi: 10.1007/s00535-005-1671-3. [DOI] [PubMed] [Google Scholar]
- Malcolm aL, Haar GRTER. Ablation of Tissue Volumes Using High Intensity Focused Ultrasound. Ultrasound Med. Biol. 1996;22:659–669. doi: 10.1016/0301-5629(96)00020-8. [DOI] [PubMed] [Google Scholar]
- Nghiem HV, Francis IR, Fontana R, Hussain H, Platt JF, Higgins E, Bree RL. Computed tomography appearances of hypervascular hepatic tumors after percutaneous radiofrequency ablation therapy. Curr. Probl. Diagn. Radiol. 2002;31:105–111. doi: 10.1067/cdr.2002.125400. [DOI] [PubMed] [Google Scholar]
- Patterson E, Scudamore C. Radiofrequency ablation of porcine liver in vivo: effects of blood flow and treatment time on lesion size. Ann. 1998;227:559–565. doi: 10.1097/00000658-199804000-00018. [DOI] [PMC free article] [PubMed] [Google Scholar]
- Rajagopalan S, Richard AR. Image-based Metrology of Porous Tissue Engineering Scaffolds. Proc. SPIE Med. Imaging. 2006 [Google Scholar]
- Rangayyan RM, Elkadiki SG. Algorithm for the computation of region-based image edge profile acutance. J. Electron. Imaging. 1995;4:62–70. [Google Scholar]
- Schena E, Saccomandi P, Giurazza F, Caponero Ma, Mortato L, Di Matteo FM, Panzera F, Del Vescovo R, Beomonte Zobel B, Silvestri S. Experimental assessment of CT-based thermometry during laser ablation of porcine pancreas. Phys. Med. Biol. 2013;58:5705–5716. doi: 10.1088/0031-9155/58/16/5705. [DOI] [PubMed] [Google Scholar]
- Senneville BD, Mougenot C, Quesson B, Dragonu I, Grenier N, Moonen CTW. MR thermometry for monitoring tumor ablation. Eur. Radiol. 2007;17:2401–2410. doi: 10.1007/s00330-007-0646-6. [DOI] [PubMed] [Google Scholar]
- Shibata T, Niinobu T, Ogata N. Comparison of the effects of in-vivo thermal ablation of pig liver by microwave and radiofrequency coagulation. J. Hepatobiliary. Pancreat. Surg. 2000;7:592–598. doi: 10.1007/s005340070009. [DOI] [PubMed] [Google Scholar]
- Solbiati L, Tonolini M, Cova L. Monitoring RF ablation. Eur. Radiol. Suppl. 2004;14:34–42. doi: 10.1007/s10406-004-0089-y. [DOI] [PubMed] [Google Scholar]
- Tanaka T, Yamanaka N, Oriyama T, Furukawa K, Ichikawa N, Tanaka W, Okamoto E. The role of microwave coagulation therapy for hepatocellular carcinoma. J. Microw. Surg. 1996;14:63–67. [Google Scholar]
- Varghese T, Zagzebski JA, Chen Q, Techavipoo U, Frank G, Johnson C, Wright A, Lee FT. Ultrasound monitoring of temperature change during radiofrequency ablation: Preliminary in-vivo results. Ultrasound Med. Biol. 2002;28:321–329. doi: 10.1016/s0301-5629(01)00519-1. [DOI] [PubMed] [Google Scholar]
- Vaupel P, Kallinowski F, Okunieff P. Blood flow, oxygen and nutrient supply, and metabolic microenvironment of human tumors: a review. Cancer Res. 1989:6449–6465. [PubMed] [Google Scholar]
- Veldkamp WJH, Joemai RMS, van der Molen AJ, Geleijns J. Development and validation of segmentation and interpolation techniques in sinograms for metal artifact suppression in CT. Med. Phys. 2010;37:620. doi: 10.1118/1.3276777. [DOI] [PubMed] [Google Scholar]
- Wile G, Leyendecker J, Krehbiel K. CT and MR Imaging after Imaging-guided Thermal Ablation of Renal Neoplasms 1. Radiographics. 2007:325–340. doi: 10.1148/rg.272065083. [DOI] [PubMed] [Google Scholar]
- Winter L, Oberacker E, Paul K, Ji Y, Oezerdem C, Ghadjar P, Thieme A, Budach V, Wust P, Niendorf T. Magnetic resonance thermometry: Methodology, pitfalls and practical solutions. Int. J. Hyperth. 2015;6736:1–13. doi: 10.3109/02656736.2015.1108462. [DOI] [PubMed] [Google Scholar]
- Wright A, Sampson L, Warner T. Radiofrequency versus Microwave Ablation in a Hepatic Porcine Model 1. Radiology. 2005 doi: 10.1148/radiol.2361031249. [DOI] [PubMed] [Google Scholar]


