Abstract
Ageing is driven by a loss of transcriptional and protein homeostasis1–3 and is the key risk factor for multiple chronic diseases. Interventions that attenuate or reverse systemic dysfunction seen with age therefore have potential to reduce overall disease risk in the elderly. Pre-mRNA splicing is a fundamental link between gene expression and the proteome, and deregulation of the splicing machinery is linked to multiple age-related chronic diseases4,5. However, the role of splicing homeostasis in healthy ageing remains unclear. Here we demonstrate that pre-mRNA splicing homeostasis is a biomarker and predictor of life expectancy in Caenorhabditis elegans. Using transcriptomics and in-depth splicing analysis in young and old animals fed ad libitum or on dietary restriction (DR), we find defects in global pre-mRNA splicing with age that are reduced by DR via the branch point binding protein (BBP)/splicing factor 1 (SFA-1). We show that SFA-1 is specifically required for lifespan extension both by DR, and modulation of TORC1 pathway components AMPK, RAGA-1 and RSKS-1/S6 Kinase. Lastly, we demonstrate that overexpression of SFA-1 is sufficient to extend lifespan. Together, these data demonstrate a role for RNA splicing homeostasis in DR longevity and suggest modulation of specific spliceosome components can prolong healthy ageing.
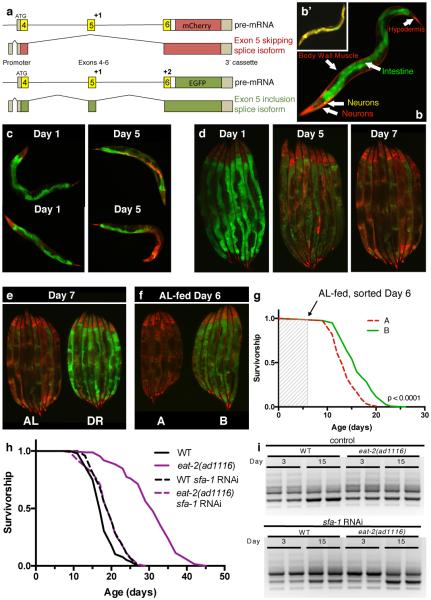
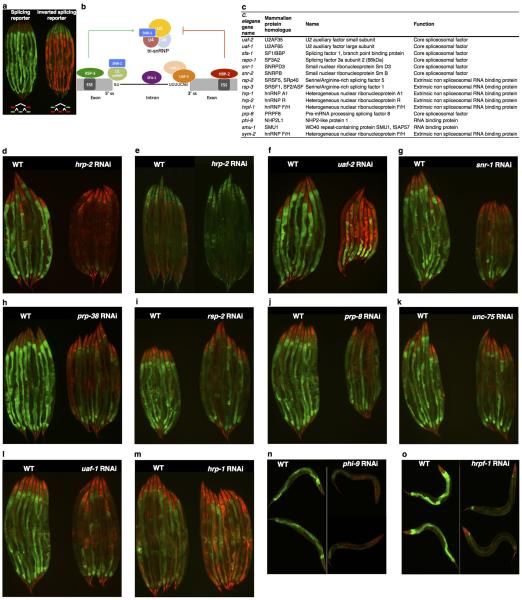
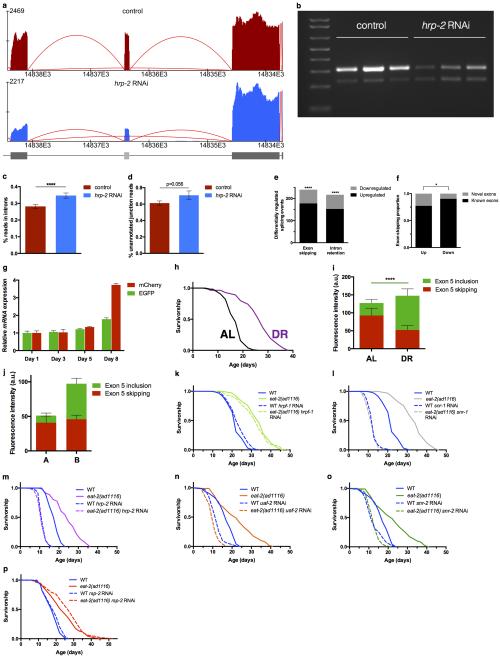
Expression of specific RNA splicing factors has recently been shown to correlate with longevity in C. elegans, mouse and humans6–11, yet links between RNA splicing and the promotion of healthy ageing via interventions such as dietary restriction are unclear. To examine the role of pre-mRNA splicing in DR using a multicellular system, we used an in vivo fluorescent alternative splicing reporter in the nematode C. elegans. This reporter strain expresses a pair of ret-1 exon 5 reporter minigenes with differential frame shifts, driven by the ubiquitous eft-3 promoter12. GFP indicates exon 5 has been included whereas expression of mCherry indicates exon 5 has been skipped (Fig. 1a) and live imaging reveals cell and tissue specific ret-1 alternate splicing12 (Fig. 1b, Extended Data Fig. 1a). We examined if the reporter responded to spliceosome disruption by inhibiting multiple, conserved13 spliceosome components by RNA interference (RNAi) (Extended Data Fig. 1b-o). RNAi of hrp-2, a core spliceosome component in C. elegans and mammals, completely deregulates ret-1 exon inclusion in day 1 adult worms (Extended Data Fig. 1d, e). RNA sequencing of hrp-2 RNAi treated animals showed altered splicing of the endogenous ret-1 gene (Extended Data Fig. 2a, b), as well as widespread splicing defects including intron retention, exon skipping, and differentially regulated alternative splicing (Extended Data Fig. 2c-f, Supplementary Table 1). Deregulation of the splicing reporter therefore correlates with loss of endogenous splicing fidelity in vivo in C. elegans.
Figure 1. The role of RNA splicing in DR longevity.
a, ret-1 splicing reporter schematic12. b, Tissue-specific ret-1 splicing in day 1 C. elegans. b’, Control reporter without frameshifts. c, Representative reporter splicing at days 1 and 5, and d, days 1, 5, and 7. e, Splicing reporter worms on AL or DR at day 7. f, Representative images of age-matched animals in group A (increased exon 5 skipping) and group B (increased exon 5 inclusion). g, Survival of groups A and B. Arrow denotes sorting day (1 of 2 replicates). h, Survival of WT and eat-2(ad1116) animals +/− sfa-1 RNAi (7 replicates). i, tos-1 isoforms in WT worms and eat-2(ad1116) +/− sfa-1 RNAi (day 3 vs. 15, n=2 biological replicates). Lifespans: n=100 worms/condition; p values: log-rank test.
We next used the splicing reporter to monitor alternative splicing in ageing animals. Splicing in C. elegans is under tight regulation, especially during development13,14. As a result, the splicing reporter undergoes stereotypical tissue-specific changes in alternative splicing throughout larval development that are homogeneous across the population12. However, by day 5, when C. elegans are still considered ‘youthful’15 and are phenotypically homogeneous under bright field microscopy, we observed heterogeneous patterns of exon usage both between individuals and between the same cell types within individuals (Fig. 1c, d). This is especially evident within cells of the intestine, which stochastically begin to skip exon 5 and therefore express mCherry. By day 7, all animals lose youthful splicing patterns with cells of the intestine showing differential exon skipping (Fig. 1d), despite the reporter minigene being robustly expressed in old animals (Extended Data Fig. 2g). Ageing therefore leads to a deregulation in alternative splicing and this occurs at different rates between individuals.
We analysed the effects of DR on ret-1 splicing using a solid plate dietary restriction (sDR) regime that robustly extends lifespan (65% lifespan increase, p<0.0001, Extended Data Fig. 2h)16. While animals fed ad libitum (AL) show deregulated ret-1 splicing with age, C. elegans on sDR maintain a youthful splicing pattern and maintain population homogeneity (Fig. 1e, Extended Data Fig. 2i). Despite being isogenic, wild type (WT) AL fed C. elegans show remarkable heterogeneity in rates of ageing between individuals. To determine if inter-individual splicing variation might underlie inter-individual differences in WT ageing, we sorted AL-fed age-synchronized (day 6) C. elegans into two groups, based solely on their splicing patterns: A, animals with increased exon 5 skipping reminiscent of old AL-fed worms, and B, animals with increased exon 5 inclusion characteristic of C. elegans fed DR (Fig 1f, Extended Data Fig. 2j). Notably, the subsequent median lifespan of C. elegans in group B was significantly greater than those in group A that had early onset deregulated alternative splicing (23% increased, p<0.0001, Fig. 1g). Therefore, splicing efficiency declines more rapidly in C. elegans fed AL than in those fed DR, and specific splicing events can be used as a predictor of subsequent life expectancy in young animals.
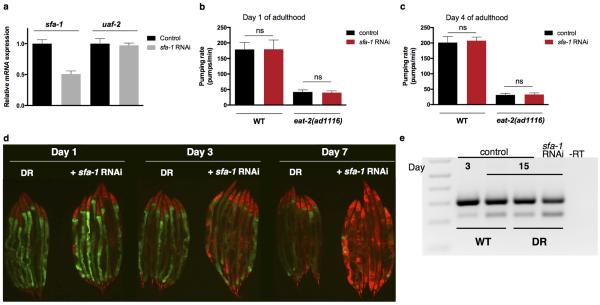
To determine whether splicing fidelity contributes to the effect of DR on ageing, we performed a targeted reverse genetic screen for spliceosome components that affect lifespan during WT or DR feeding using the eat-2(ad1116) mutant as a genetic model for DR17. We selected conserved splicing factors representing both core components of the spliceosome, as well as RNA binding proteins including SR and hnRNP protein family members (Extended Data Fig. 1c)13. We identified spliceosome components whose inhibition significantly reduced lifespan of both WT and DR animals and factors that did not affect longevity (Extended Data Fig. 2k-p, Extended Data Table 1). Strikingly however, RNAi of the branch point binding protein ‘splicing factor 1 (SFA-1)18 completely abolishes any extension of lifespan by DR (AL + sfa-1 RNAi vs. DR + sfa-1 RNAi: p=0.9783, log-rank, Fig. 1h) yet did not shorten WT lifespan. sfa-1 RNAi reduced sfa-1 expression by 50% but did not affect expression of uaf-2, which is co-transcribed in an operon with sfa-1 (Extended Data Fig. 3a). sfa-1 RNAi also has no effect on feeding/pumping rates in C. elegans (Extended Data Fig. 3b, c). We analysed the splicing pattern of a known target of SFA-1, ‘target of splicing (tos-1)’19,20, to assay changes in SFA-1 activity with age and DR. PCR analysis revealed an age-associated change in tos-1 isoform splicing that is prevented by DR in an SFA-1 dependent manner (Fig. 1i). In addition, sfa-1 RNAi blocked the effect of DR on age-related changes to ret-1 splicing as assayed both by the in vivo reporter and by PCR of endogenous ret-1 (Extended Data Fig. 3d, e). Together, these data demonstrate a role for SFA-1 and RNA processing in lifespan extension by DR.
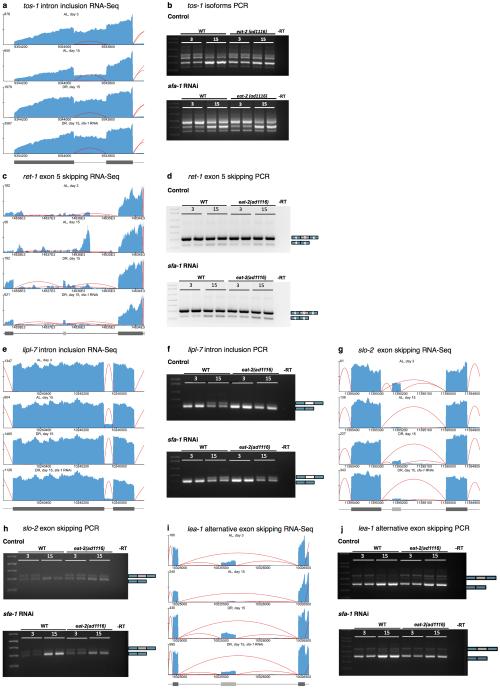
Next, we performed unbiased analyses of the effect of age, DR and SFA-1 on global RNA processing and gene expression, to investigate the mechanism by which SFA-1 promotes DR longevity. We performed 100 bp paired-end RNA-Seq on samples taken from young and old AL (N2) and DR (eat-2(ad1116)) worms +/− RNAi for sfa-1, in parallel to assaying their lifespan. Samples were collected at day 3 when no animals had died, at day 15 (AL & DR sfa-1 RNAi 75% survival, DR 100% survival), and day 27 (DR 75% survival) (Fig. 2a). This design allowed us to match groups with the same chronological age (coloured vertical lines) and physiological age (horizontal dashed line). Gene expression changes and splicing events identified by the RNA-Seq, including age-related changes to endogenous ret-1 and tos-1, were validated with semi- and qRT-PCR (Extended Data Figs. 4, 5, Supplementary Table 2-5).
Figure 2. DR promotes genome-wide splicing efficiency.
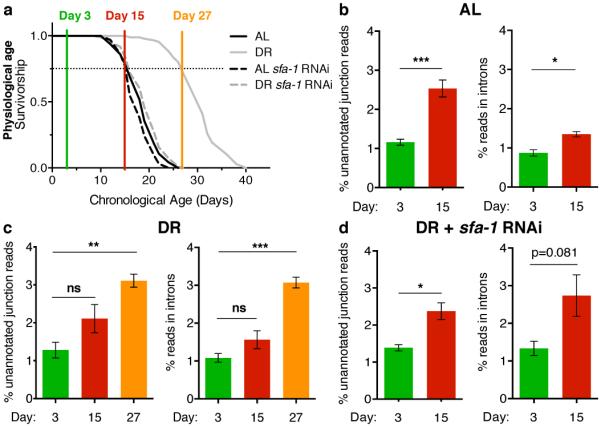
a, Survival of AL and DR (eat-2(ad1116)) populations +/− sfa-1 RNAi collected for RNA-Seq. b, By day 15, AL significantly increases unannotated junction reads (*** p=0.0006) and intron retention (* p=0.0106) compared to day 3. c, No significant increase in unannotated junction reads or intron retention between day 3 and 15 DR-fed animals (p>0.05 in each case). By day 27, DR-fed worms have significantly increased unannotated junction reads (** p=0.0036) and intron retention (*** p= 0.0004) compared to day 3. d, Unannotated junction reads and intron reads in DR with sfa-1 RNAi (day 15 vs. 3, ** p=0.0065, ns p>0.05). Mean ± SEM, % of total reads shown, p values panels b-d: unpaired, two-tailed t-test after probit transformation.
We assessed the effect of age on multiple parameters of pre-mRNA processing in AL and DR fed C. elegans. We did not detect universal changes in splicing factor expression with age (Supplementary Table 6). However, ageing induced hallmarks of global spliceosome disruption; day 15 old AL fed animals showed a significant increase in both intron retention and unannotated splice junctions indicative of increased splicing noise with age (Fig. 2b). DR reduced the increase in alternative splicing events detected with age (Extended Data Fig. 6a), while multidimensional scaling analysis of all differential splicing events over age suggest DR reduces splicing heterogeneity (Extended Data Fig. 6b). DR treated animals also expressed fewer novel splicing events compared to AL controls (Extended Data Fig. 6c, Supplementary Table 7). Moreover, DR protected against age-induced deregulation of pre-mRNA processing; day 15 DR animals did not show significant increases in either intron retention or unannotated splice junctions compared to day 3 (Fig. 2c). By day 27 however, when the physiological age of DR animals matched that of day 15 AL worms, both parameters of spliceosome dysfunction were significantly increased (Fig. 2c). Suggesting a role for SFA-1 in the effect of DR on global RNA processing, DR no longer suppressed age-related increases in unannotated splice junctions or total alternative splicing events in animals with sfa-1 RNAi (Fig. 2d, Extended Data Fig. 6d). These data suggest that DR protects against dysfunctional processing of specific pre-mRNAs seen with age, and that this protection requires SFA-1.
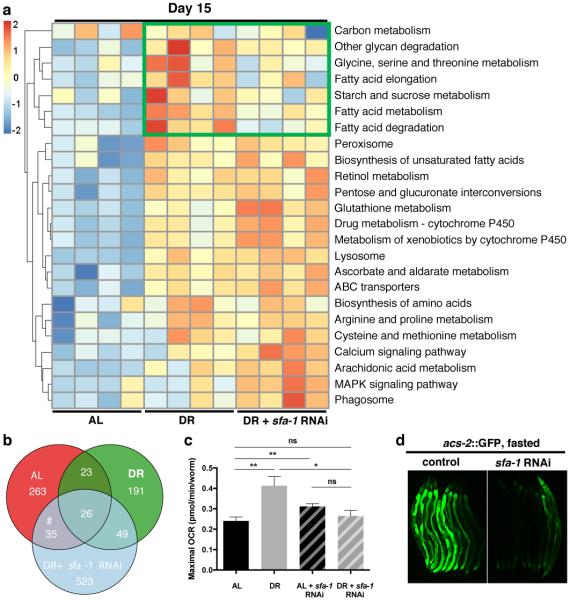
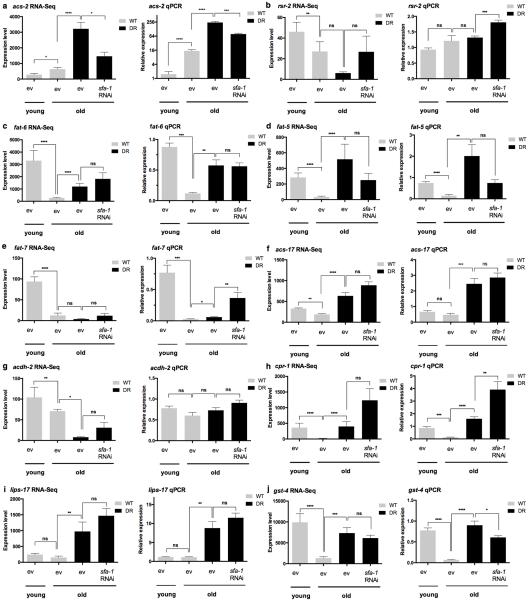
To define the effects of DR specifically modulated by SFA-1, we first analysed differential gene expression changes between AL and DR fed animals at day 15, with and without sfa-1 RNAi (Supplementary Tables 4, 5). We determined KEGG pathways significantly altered by DR in day 15 animals in an SFA-1 dependent manner. RNAi of sfa-1 did not block all DR related changes to gene expression, but instead specifically reversed up regulation of lipid/fatty acid metabolism genes induced by DR (Fig. 3a, boxed region, Extended Data Fig. 6e, f). Further, GO analysis of genes showing intron inclusion with age in both AL and DR+sfa-1 RNAi conditions, but not in DR alone, are functionally enriched for metabolic processes including lipid catabolism and carbohydrate transport (Fig. 3b, Supplementary Table 8). We next asked whether SFA-1 modulates the effects of DR on metabolism directly, by measuring oxygen consumption in live young (day 4) and old (day 15) AL and DR C. elegans with and without sfa-1 RNAi (Fig. 3c). AL animals showed decreased maximal respiratory capacity with age, and this decline is attenuated by DR in an SFA-1 dependent manner (Fig. 3c, Extended Data Fig. 6g, h). In addition, sfa-1 RNAi blocked fasting induced expression of acyl-CoA synthetase, which is critical for fatty acid oxidation during starvation (Fig. 3d and Extended Data Fig. 6i, j). To determine if the effect of SFA-1 on metabolic gene expression was unique to C. elegans, we performed RNA-Seq in HeLa cells with and without siRNA of the mammalian SFA-1 orthologue, splicing factor 1 (SF1). Supporting a conserved role for SF1 in metabolic regulation from worms to mammals, SF1 siRNA deregulated splicing and the most significantly enriched KEGG pathways in HeLa cells with SF1 inhibition are metabolic processes (Extended Data Fig. 7, Supplementary Table 9). Together these data suggest a role for SFA-1 in metabolic plasticity and mitochondrial function during DR.
Figure 3. SFA-1 regulates metabolic effects of DR.
a, Heatmap of KEGG analysis in WT AL, DR and DR+sfa-1 RNAi at day 15. b, Venn diagram representing intron inclusion events at day 15 in AL, DR and DR+sfa-1 RNAi (#GO analysis in Supplementary Table 8). c, Maximal respiratory capacity (day 15 normalized to day 4, ** p<0.01, * p<0.05, unpaired, mean ± SEM, two-tailed t-test, n=100 animals/condition). d, Transcriptional induction of acs-2P::GFP in control and sfa-1 knockdown worms after 23 hours of fasting (representative image of 2 experiments shown).
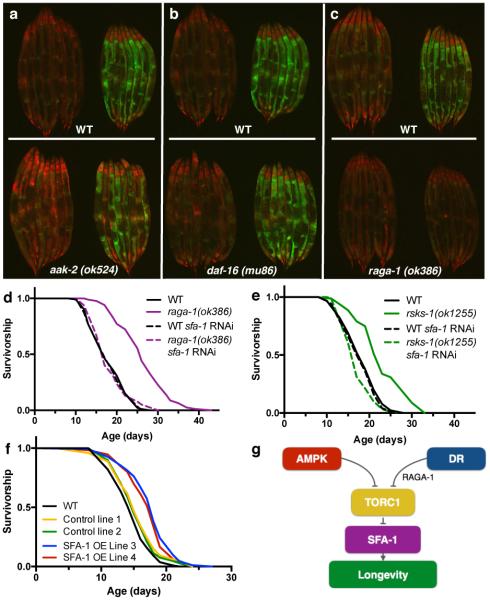
In order to identify putative mechanisms linking DR to splicing, we crossed the ret-1 minigene reporter into animals carrying null mutations in genes linked to DR longevity21: aak-2, a catalytic subunit of the energy sensor AMP-activated protein kinase (AMPK), daf-16, a forkhead transcription factor or raga-1, a Rag GTPase that links amino acid sensing to mechanistic target of rapamycin (mTOR) complex (mTORC) 1 activity. DR maintained homogenous ret-1 splicing patterns in day 8 old C. elegans lacking AAK-2 or DAF-16, similar to that seen in DR WT worms (Fig. 4a, b, Extended Data Fig. 8a, b). Notably, raga-1(ok386) mutation completely abolishes the effects of DR on ret-1 splicing with age (Fig. 4c, Extended Data Fig. 8c), without affecting ret-1 splicing in early adulthood (Extended Data Fig. 8d). In addition, raga-1(ok386) mutants show decreased phosphorylation of the mTORC1 target RSKS-1/S6 Kinase, and block the effects of age on SFA-1 activity as assayed by tos-1 splicing (Extended Data Fig. 8e, f). These data therefore suggest amino acid sensing by RAGA-1 is a critical link between DR and regulation of pre-mRNA splicing homeostasis.
Figure 4. SFA-1 promotes longevity.
AL and DR-fed splicing reporter at day 8 in a, aak-2(ok524), b, daf-16(mu86), and c, (raga-1(ok386) mutant backgrounds. Images are representative of at least 2 independent experiments. d, Effect of sfa-1 RNAi on raga-1(ok386) mutant lifespan (p=0.6733 vs. WT+sfa-1 RNAi). e, Lifespan analysis of sfa-1 RNAi in long-lived rsks-1(ok1255) (p=0.0944 vs. WT+sfa-1 RNAi). f, Overexpression of SFA-1 affects WT lifespan (p<0.0001). g, Model for role of SFA-1 in DR and mTORC1 pathway longevity. p values: log-rank test, n=100 worms/condition.
Direct suppression of mTORC1 increases lifespan, and mTORC1 is implicated as a mediator of the beneficial effects of DR. We therefore tested the role of SFA-1 in lifespan extension via suppression of multiple mTORC1 pathway components. Strikingly, sfa-1 RNAi fully suppresses lifespan extension via null mutation in both raga-1 (Fig. 4d) and rsks-1 (Fig. 4e). mTORC1 integrates insulin/ insulin-like growth factor 1 (IIS) signalling and AMPK mediated energy sensing22. sfa-1 RNAi fully suppresses lifespan extension via constitutive AAK-2 activation (Extended Data Fig. 8g), but does not fully suppress increased longevity of daf-2(e1370) mutants that have reduced IIS (Extended Data Fig. 8h). These data suggest the role of SFA-1 extends beyond RAGA-1 as a general regulator of TORC1 pathway components, including AMPK, RAGA-1 and RSKS-1/S6 Kinase.
The mechanisms linking TORC1 longevity and SFA-1 are unknown. Dynamic phosphorylation of splicing factors is essential to splicing regulation and spliceosomal activity23 and deregulation of TORC pathway components with age may therefore result in aberrant splicing. However, although an mTOR consensus motif was identified in the mammalian orthologue of SFA-1, SF124,25, inhibition of TORC1 via rapamycin or torin has no effect on total SF1 levels in mouse embryonic fibroblasts, nor did we see SF1 gel shifts indicative of altered phosphorylation, as observed for the canonical TORC1 target S6 Kinase (Extended Data Fig. 8i, j). Full characterization of spliceosome composition along with splicing factor protein levels, post-translational modifications with age and mTORC1 modulation represents a critical future direction.
SF1/BBP is required for early spliceosome assembly26, yet it is not required for splicing of all pre-mRNAs27 and has also been reported to function as a transcriptional suppressor28. How SFA-1 modulates DR and mTORC1 pathway longevity remains unclear. Several lines of evidence support a specific functional role for SFA-1 in promoting DR and mTORC1 longevity. First, inhibition of the nonsense mediated decay pathway, a key RNA homeostatic mechanism, does not block lifespan extension by raga-1 RNAi (Extended Data Fig. 9a) in C. elegans. Second, we identified a second splicing factor, REPO-1, that is required for DR longevity but unlike SFA-1 is completely dispensable for raga-1 lifespan (Extended Data Fig. 9b-d). Strikingly however, both SFA-1 and REPO-1 are required for lifespan extension via modulation of mitochondrial electron transport chain components (Extended Data Fig. 9e, f), raising the exciting prospect that differential composition of the spliceosome and specific splicing factors might mediate alternate longevity pathways. Lastly, moderate overexpression of sfa-1 in C. elegans modifies tos-1 splicing and is sufficient to increase lifespan by 15-33% (Fig. 4f, p<0.0001, Extended Data Fig. 9g-i). Together, these data suggest SFA-1 might be targeted to promote healthy ageing and highlight an emerging role for pre-mRNA splicing in lifespan extension via mTORC1 suppression and DR (Fig. 4g). Further, interventions that suppress mTORC1 and mimic DR might provide new therapeutic avenues for human RNA splicing related diseases.
Methods
Worm strains and culture
The following C. elegans strains were obtained from the Caenorhabditis Genetic Center, funded by the NIH Office of Research Infrastructure Programs (P40 OD010440): N2 Bristol wild type, DA1116 (eat-2(ad1116)II), RB754 (aak-2(ok524)X), MQ887 (isp-1(qm150)IV), VC222 (raga-1(ok386)II), and RB1206 (rsks-1(ok1255)III), (three latter strains made by groups part of the International C. elegans Knockout Consortium). The generation of CA AMPK and acs-2p::GFP transcriptional reporter strains was previously described30,31. CF1038 (daf-16(mu86)I) and CF1041 (daf-2(e1370)III) were obtained from the Kenyon lab via the Dillin lab. The SS104 (glp-4(bn2)) strain was a gift from K. Blackwell lab. The splicing reporter strain KH2235 (lin-15(n765)ybIs2167[eft-3p::ret-1E4E5(+1)E6-GGS6-mCherry+eft-3p::ret-1E4E5(+1)E6(+2)GGS6-GFP+lin-15(+)+pRG5271Neo]X) was a gift from Hidehito Kuroyanagi. Artificial frame shifts were introduced preventing mCherry or EGFP expression when exon 5 is included (mCherry) or skipped (EGFP) respectively. The nervous system, body wall muscles, and hypodermis predominantly express ΔE5-mCherry, while pharynx and intestine predominantly express E5-EGFP. The inverted splicing reporter WBM535 was made by injecting modified minigene reporter plasmids into N2 worms. The inverted fluorophore plasmids were made by deleting the (+2) frameshift in the EGFP minigene and inserting a (+2) frameshift into the mCherry minigene. Control strain without minigene expresses two plasmids with eft-3p::gfp and eft-3p::mCherry ubiquitously.
Worms were routinely grown and maintained on standard nematode growth media (NGM) seeded with E. coli (OP50-1). E. coli bacteria were cultured overnight in LB at 37°C, after which 100 µl of liquid culture was seeded on plates to grow for 2 days at room temperature. Use of 5-Fluoro-2’-deoxyuridine (FUDR, 100µl of 1mg/ml solution, spotted on top of the bacterial lawn, 24 hours before using the plates) to prevent excessive censoring, is noted in the legends of respective experiments.
Lifespans
All lifespans were conducted at 20°C unless otherwise noted in figure legend. Lifespans were performed as described in Burkewitz et al.31. Graphpad Prism 6 was used to plot survival curves and determine median lifespan. Lifespans were started with n=100 worms in each group. Survival curves were compared and p values calculated using the log-rank (Mantel-Cox) analysis method. Complete lifespan data are available in Supplementary Table 10.
RNA interference
All RNAi constructs came from the Ahringer RNAi library, except hrp-2 and hrpf-1 RNAi constructs, which originated from the Vidal RNAi library. RNAi experiments were carried out using E.coli HT115 bacteria on standard NGM plates containing 100µg/ml Carbenicillin. HT115 bacteria expressing RNAi constructs were grown overnight in LB supplemented with 100µg/ml Carbenicillin and 12.5µg/ml Tetracycline. NGM plus Carbenicillin plates were seeded 48 hours before use. Respective dsRNA expressing HT115 bacteria were induced by adding 100µl IPTG (100mM) one hour before introducing worms to the plate. RNAi was induced from egg hatch unless otherwise noted. ev or C denote control, empty vector HT115 RNAi bacteria. All verified sequences of RNAi clones are listed in Supplementary Data 1.
Solid plate-based dietary restriction assays
Solid sDR assays were performed as described by Ching et al.16. Plates were prepared in advance and stored at 4°C. 5-Fluoro-2’-deoxyuridine (FUDR) was added on top of the bacterial lawn (100µl of 1mg/ml solution in M9) 24 hours before worms were introduced to the plates for lifespans or directly into the NGM at 25µM concentration for imaging experiments. Ad libitum (AL) plates were prepared with a bacterial concentration of 1011 cfu/ml and dietary restriction plates with 108 cfu/ml bacterial concentration.
Imaging
Worms were anaesthetized in 0.1 mg/ml tetramisole/M9 on an NGM plate without bacteria until no movement was detectable, aligned to groups accordingly and subsequently imaged on a Zeiss Discovery V8 microscope with Axiocam camera. Exposure times were kept constant for all imaging experiments involving the splicing reporter. Worm population size was > 50 worms per experiment and images represent population phenotype. Representative images were processed with ImageJ. Pixel intensity was determined per worm for EGFP and mCherry and background fluorescence subtracted from the mean intensity to calculate Corrected Total Worm Fluorescence (CTWF) = Integrated Density – (Area of selected worm X Mean fluorescence of background readings). Results were graphed using Graphpad Prism 6. All imaging experiments were repeated.
Pumping rates
Wild type and eat-2(ad1116) worms were synchronized by timed egg lay onto empty vector (control) and sfa-1 dsRNA expressing HT115. Day 1 adult worms were transferred onto control and RNAi plates with FUDR. Pumping rates were assayed 7 hours after transfer and on day 4 of adulthood. Pumps of the terminal pharyngeal bulb were counted for 1-minute interval per worm crawling on the bacterial lawn. Pumping rates per minute for 10 worms per treatment were averaged. Pumping rates were assessed in two independent replicate experiments.
SFA-1 overexpression
SFA-1 is N-terminally tagged with 3X FLAG and cDNA was constructed using two gBlock gene fragments (IDT) and Gibson assembly protocol (NEB, according to manufacturer’s protocol). sfa-1 cDNA expression is driven by eft-3 promoter and the cDNA insertion was verified by sequencing. The plasmid was injected at 15ng/µl concentration into N2 worms using a myo-2p::tdTomato expressing plasmid as co-injection marker. Lines are denoted SFA-1 OE line 1 and SFA-1 OE line 2. Additional lines were made by co-injection of 10ng/µl sfa-1 cDNA plasmid and myo-3p::mCherry into N2 worms. These lines are named SFA-1 OE line 3 and SFA-1 OE line 4.
RNA isolation and cDNA synthesis
Total RNA was extracted using Qiazol reagent (QIAGEN), column purified by RNeasy mini or miRNeasy micro kit (QIAGEN) according to manufacturer’s instructions. cDNA was synthesized using SuperScript® VILO Master mix (Invitrogen).
Ageing/DR RNA Sequencing sample preparation
WT (N2) and eat-2(ad1116) (DR) worms were synchronized on HT115 empty vector (ev) or sfa-1 RNAi bacteria by egg lay. Worms were transferred to FUDR treated bacteria plates on Day 1 of adulthood. All worms were transferred at day 3 of adulthood to fresh plates with respective FUDR-treated RNAi bacteria. WT and DR worms on ev and sfa-1 RNAi bacteria were collected in M9 buffer and frozen in Qiazol (Qiagen) for RNA isolation. At day 15 of adulthood, remaining live worms were transferred to fresh plates to remove dead worms before collection in Qiazol and storage at -80°C until RNA extraction. On day 27, live DR worms were transferred to fresh plates and frozen in Qiazol. At least 500 worms were collected for each sample at the different time points. RNA extractions were performed with two replicate sets at a time using RNeasy Mini kit (Qiagen). RNA concentrations and quality were determined by Nanodrop and by Agilent Bioanalyzer 2100 (Agilent Technologies). Only RNA samples with RIN > 8.0 were used for library preparation. RNA samples were further processed at the Harvard Biopolymers Facility. cDNA was synthesized using SMART-Seq v4 Ultra Low Input RNA kit (Clontech Laboratories). cDNA quality and concentration was assessed on Agilent 2100 Bioanalyzer before proceeding to library preparation using Nextera XT DNA library protocol (Illumina). Library quality control was performed on 2200 High Sensitivity D1000 Tape Station (Agilent Technologies). Libraries were pooled to a concentration of 1nM and run on an Illumina HiSeq2500 with 100-cycle paired-end sequencing. Sequencing was done with 4 biological replicate populations for each time point.
hrp-2 knockdown RNA Sequencing
The temperature-sensitive sterile glp-4(bn2) mutant strain was used for RNA-Seq and the experiment was performed with three biological replicates. Worms were grown to gravid adults and bleached to collect staged eggs. Eggs were pipetted on to IPTG-induced NGM plus Carbenicillin plates prepared with either empty vector (ev) HT115 or hrp-2 dsRNA expressing bacteria. Worms were grown at 15°C for 24 hours, then shifted to 22.5°C to prevent normal proliferation of germ cells and progeny development. Day 1 adult worms were washed off ev and hrp-2 plates in M9 following snap freeze in Qiazol (Qiagen) for RNA extraction. RNA extraction was performed in parallel for two replicates with a third replicate added later to obtain similar RNA levels. RNA extractions were done according to manufacturer’s protocol using RNeasy mini kit (Qiagen). RNA quality was confirmed on Agilent 2100 Bioanalyzer and all samples had RIN>8.6. cDNA libraries were prepared from 1µg total RNA using TruSeq RNA Sample preparation v2 kit (Illumina). 100-cycle paired-end sequencing was performed on HiSeq 2500 (Illumina) by the Tufts University Core Facility.
SF1 knockdown in HeLa cells and RNA sequencing sample preparation
HeLa cells were grown in RPMI1640 supplemented with 10% fetal calf serum (FCS), glutamine and penicillin/streptomycin (HeLa EMBL cells: Provided by Eugene lab at University of Southern Denmark; Cells were authenticated by confirming 93% SNPs listed in COSMIC database; not tested for mycoplasma contamination). The cells were reverse transfected using RNAiMAX (ThermoFisher Scientific) and siRNAs targeting SF1 (L-012662-01-0020, Dharmacon) or non-targeting siRNAs (D-001810-10-20) as control. After 24 hours, cells were re-transfected using the forward transfection protocol and 48 hours later harvested for RNA and protein. Knockdown of SF1 was validated by Western blotting. Total RNA was isolated using Isol-RNA lysis reagent (5 PRIME). RNA purity, integrity and concentration were determined using an Agilent 2100 Bioanalyzer (Agilent Technologies, Inc, USA). Only RNA samples with a RIN value of 8.0 or higher and a ratio (28s/18s) of above 1.8 were used in sequencing library preparation. Three biological replicates for control and SF1 knockdown samples were processed for library constructions following the manufactory instructions (Illumina Tru Seq Stranded Total RNA sample preparation v2 Guide, Part #15031048 Rev.E October 2013 – “Low sample protocol”). In brief, 0.5 µg of total RNA from each tissue was depleted for cytoplasmic rRNA using the Ribo-Zero ribosomal reduction chemistry, chemically fragmented for 8 min at 94°C, and processed for 1st strand synthesis cDNA and then 2nd strand synthesis using dUTP instead of dTTP. After some purification steps, the cDNA was then end-repaired, purified, adenylated at the 3’-ends, and purified before adding the indexed adapter sequences using the TruSeq Stranded LT Kit Index set A. Each library preparation was then enriched by 10 cycles of PCR, purified and finally validated in regards to size and concentration. For sizing, libraries were analyzed on the Agilent 2100 Bioanalyzer using a DNA 1000 kit from Agilent Technologies. The Libraries were quantified by qPCR using the KaPa Library quantification Kits (KaPa Biosystems, Cat KK4824). Samples were pooled, and a final concentration of 16 pM denatured library was used for 100-cycle paired-end sequencing using an Illumina HiSeq1500 at the University of Southern Denmark’s Villum Center for Bioanalytical Sciences.
RNA Sequencing analysis
Raw reads were adapter trimmed with cutadapt32 using the additional parameters “--trim-n -m 15” and subsequently aligned to WBcel235 and hg38 genomes with STAR33 version 2.5.0c using the additional parameter “--alignIntronMax 50000” for the WBcel235 alignments and the additional parameters “--outSAMstrandField intronMotif --outFilterType BySJout” for all alignments. Gene counts were obtained with htseq-count34 and WBcel235 Ensembl annotation v7535 and hg38 Ensembl annotation v79. Gene expression analysis was performed using DESeq236 with cqn37 based normalization. After adjusting for multiple testing using Benjamini-Hochberg38, we defined differentially expressed genes as those with adjusted p-values below 0.1. GO term enrichment analysis of differentially expressed genes was carried out using goseq39 and KEGG pathway analysis with gage40, significant pathways and GO terms were defined as having Benjamini-Hochberg adjusted p-values below 0.1. Overall KEGG pathway activity was estimated by averaging the regularized log transformed expression estimates from each sample over each condition. Splicing analysis was performed with SAJR29 by first constructing de novo annotation from the Ensembl input and merged alignment files. Inclusion and exclusion reads were subsequently obtained for each splicing event and analysed using a GLM model under a quasibinomial distribution. Before model parameter estimation we restricted the analysis to only those splicing events for which we could map at least 5 inclusion reads and 5 exclusion reads across conditions. Significant splicing changes were defined as those with p-values below 0.05 after adjusting for multiple testing using Benjamini-Hochberg correction. PTC containing regions were defined as those containing a stop-codon in all possible reading frames at least 50 bp upstream of the next downstream splicing site.
GO term enrichment analysis on genes with increased intron retention was performed with goseq and limited to terms for which we had at least two genes with increased intron retention. KEGG pathway enrichment analysis was performed with clusterProfiler41 with a background set of all entrez ids mapped to a KEGG pathway.
Ageing/RAGA-1 mutant sample collection
WT (N2) and raga-1(ok386) worms were grown and collected following the same procedure as described above for ageing/DR sample collection.
Semi-quantitative RT-PCR of alternative splicing events
tos-1 was amplified using modified PCR conditions and full-length tos-1 cDNA primers according to Ma el al.20. Expand High Fidelity PCR System (Roche) or Apex Taq RED (Genesee Scientific) was used for amplification with an annealing temperature of 60°C and 35 cycles.
Alternative splicing events detected by our RNA-Seq analysis were validated using Apex Taq RED master mix. 1 Kb Plus DNA ladder (Invitrogen) was used as molecular weight reference. Following PCR, samples were resolved on a 2% agarose gel and stained with ethidium bromide. Gels were imaged on ChemiDoc MP (BioRad). All reactions were run with a minimum of 2 biological replicate samples. Primer sequences can be found in Supplementary Data 2.
Quantitative RT-PCR
Taqman real-time qPCR experiments were performed on a StepOne Plus instrument (Applied Biosystems) following the manufacturer’s instructions. Data were analysed with the comparative 2ΔΔCt method using Y45F10D.4 (Ce02467253_g1) as endogenous control. For each gene in each strain, average fold-change relative to the wild type was calculated and statistical significance evaluated with a one-way analysis of variance (ANOVA). The following Taqman assays from Life Technologies were used: sfa-1 (Ce02468921_m1), uaf-2 (custom made), rsr-2 (Ce02439948_g1), cpr-1 (Ce02482188_g1), acs-2 (Ce02486192_g1), acs-17 (Ce02495808_g1), fat-5 (Ce02488494_m1), fat-6 (Ce02465318_g1), fat-7 (Ce02477067_g1), acdh-2 (Ce02432818_g1), lips-17 (Ce02435133_g1) and gst-4 (Ce02458730_g1).
EGFP and mCherry expression analysis was performed using Fast SYBR Green Master Mix (Applied Biosystems) on a StepOne Plus instrument (Applied Biosystems) according to manufacturer’s instructions. A standard curve was prepared to analyse EGFP and mCherry primer efficiencies. Data were analysed with the comparative 2ΔΔCt method using Y45F10D.4 and pmp-3 mRNA levels as endogenous controls. Graphpad Prism 6 was used for all statistical analysis.
Oxygen consumption
N2 and eat-2(ad1116) worms were grown on ev or sfa-1 RNAi bacteria from egg hatch. Worms were transferred to plates with FUDR on day 1 of adulthood. Oxygen consumption was measured on day 4 and day 15 of adulthood using a Seahorse XF96 analyser (Seahorse Bioscience). Worms were removed from NGM plates, washed 3 times with M9 buffer and transferred to a 96 well plate (10 worms/well). Basal respiration was measured 10 times followed by the addition of FCCP (10μM) to measure maximal respiration, which was measured 6 times. Oxygen consumption rates were normalized to the number of worms per well. Two biological replicate experiments were run.
SF1 knockdown in MEF cells and immunoblotting
WT-MEFs were maintained in Dulbecco’s Modified Eagle’s Medium (DMEM; Corning/Cellgro, 10-017-CV) containing 10% fetal bovine serum (FBS) (Proven to be mycoplasma contamination negative; cell line identified by q-RT-PCR and western blot (Manning lab); WT-MEFs were provided by the laboratory of David Kwiatkowski (Brigham and Women’s Hospital, Harvard Medical School, Boston). WT-MEFs were serum starved for 16h, pre-treated with rapamycin (20 nM) or Torin (250 nM) for 30 min prior to insulin stimulation (1h and 16h, 500 nM). To control for the SF1 antibody specificity, WT-MEFs were transfected with non-targeting control siRNAs (siCt) or SF1 siRNA for 72h and grown in 10% FBS. Cells were lysed in ice-cold Triton lysis buffer (40mM HEPES, pH 7.4, 120mM NaCl, 1mM EDTA, 1% Triton X-100, 10mM sodium pyrophosphate, 10mM glycerol 2-phosphate, 50mM NaF, 0.5mM sodium orthovanadate, 1μM Microcystin-LR, 0.2mM PMSF and protease inhibitor cocktail). Lysates were clarified by centrifugation (20,000 × g for 15 min at 4°C) and protein concentrations were determined using the Bradford assay (Biorad). Normalized protein lysates were loaded onto 8% acrylamide resolving gels, separated by SDS-PAGE, transferred to nitrocellulose membranes and subjected to immunoblotting with the indicated antibodies. siRNA against mouse SF1 was from Sigma (Cat no: SASI_Mm02_00305738) and non-targeting control siRNA was from Dharmacon. Antibodies toward SF1 (Cat no: HPA018883-100UL) and β-actin were from Sigma. phospho (P)-S6K1 T389 (CST #9234), phospho (P)-S6 S240/S244 (CST #2215), S6K1 (CST #2708), S6 (CST #2217 were from Cell Signaling technologies. These experiments were repeated twice.
Phospho-S6K immunoblotting
For each sample, approximately 500 Day 1 adult C. elegans were collected in M9 buffer and snap frozen in liquid nitrogen. To make worm lysates, RIPA buffer with protease inhibitors (Sigma #8340) and phosphatase inhibitors (Roche #4906845001) were added and samples were lysed via sonication (Qsonica Q700). SDS-PAGE were performed using 10% Tris-Glycine gels (Thermo Fisher Scientific, #XP00100). Proteins were transferred to PVDF membranes (Thermo Fisher Scientific, #LC2005) and blocked with 5% BSA in TBST. Primary antibodies and dilutions are: phospho-Drosophila p70 S6 Kinase (Thr398) (Cell Signaling, #9209, 1:500), beta actin (Abcam, #8226, 1:1000). Bands were visualized and quantified using a Gel Doc system (Bio Rad) and Image Lab software (Version 4.1).
Extended Data
Extended Data Figure 1. Heterogeneous splicing patterns in response to knockdown of conserved splicing factors.
a, Inverted fluorophore splicing reporter b, Simplified diagram of C. elegans intron splicing showing representative splicing factors investigated herein c, C. elegans splicing factors and their mammalian homologues. Knockdown of hrp-2 in splicing reporter (d) and hrp-2 in inverted reporter (e), uaf-2 (f), snr-1 (g), prp-38 (h), rsp-2 (i), prp-8 (j), unc-75 (k) and uaf-1 (l) by RNAi at day 1 of adulthood. m, hrp-1 depletion at day 4 of adulthood. n and o, Representative images of worms with hrpf-1 and phi-9 knockdown in day 1 adults with reduced exon inclusion.
Extended Data Figure 2. Effects of splicing factor knockdown on splicing homeostasis and DR-mediated longevity.
a, RNA-Seq coverage tracks for endogenous ret-1 splicing in hrp-2 knockdown samples. b, Endogenous ret-1 splicing exon 5 skipping in WT and hrp-2 RNAi worms by RT-PCR (3 biological replicates). Intronic reads (c, p=0.0042), and unannotated junctions reads (d, p=0.056) as hallmarks of deregulated splicing with hrp-2 knockdown. p values: unpaired, two-tailed t-test after probit transformation. e, Differentially regulated alternative splicing events induced by hrp-2 depletion (**** exon inclusion: p<0.0001, intron retention p<0.0001, Pearson chi-squared test). f, Proportion plot of all exon skipping events with proportions of novel and known exons up- or downregulated in hrp-2 knockdown samples (p=0.0157, differences in proportions of novel exons in up- and downregulated events were tested with Pearson’s chi-squared test, deviations from an even proportion of up- and downregulated splicing events were tested with binomial test). g, EGFP and mCherry mRNA levels up to day 8 of adulthood by qRT-PCR (mean ± SD, technical replicates shown). h, sDR robustly extends C. elegans AL lifespan16 (p<0.0001). i, Fluorescence quantification of splice isoforms in day 7 old AL and sDR animals (**** p<0.0001, unpaired two-tailed t-test, mean ± SD, n=8). j, Age-matched, AL-fed worm populations separated at day 6 according to group A (increased exon 5 skipping) and group B (increased exon 5 inclusion) (mean ± SD, n=6, 1 of 3 biological replicates shown). k, Effect of hrpf-1 RNAi on WT and eat-2(ad1116) lifespan (WT vs. eat-2(ad1116) on hrpf-1 RNAi, p<0.0001). l, Comparison of survival rates of WT and eat-2(ad1116) with snr-1 RNAi (p=0.5147). Survival analysis of hrp-2 (m) and uaf-2 (n) downregulation by RNAi. o, Effect of snr-2 knockdown on WT and DR lifespan. p, WT and DR lifespan curves with rsp-2 knockdown. Lifespans done with FUDR as indicated in Extended Data Table 1 and Supplementary Table 10. p values survival analysis: log-rank (Mantel-Cox) test. Sequencing reads tracks generated by Splicing Java Coverage Viewer as part of SAJR29. Height of red lines represent RNA coverage of splice junctions, dark gray boxes represent exonic sequence, light gray box denotes alternative exon sequence.
Extended Data Figure 3. Effects of sfa-1 downregulation on splicing.
a, uaf-2 gene expression is not affected by reduced sfa-1 levels in WT worms at day 1 of adulthood (mean ±SD, technical replicates shown). Effect of reduced sfa-1 expression on pumping rates in WT and genetic DR model eat-2(ad1116) at day 1 (b) and 4 of adulthood (c) (mean ±SD, ns p > 0.05, unpaired, two-tailed t-test, n=10 worms per condition). d, Splicing reporter pattern with sfa-1 knockdown from egg hatch, day 1, 3 and 7 old adults. e, Endogenous ret-1 exon 5 splicing pattern with age and sfa-1 RNAi in WT and DR worms by RT-PCR (day 3 vs.15, independent replicate sample set).
Extended Data Figure 4. RT-PCR validation of alternative splicing events in ageing and with sfa-1 knockdown.
a, Sequencing reads coverage for tos-1 b, Age-associated isoform ratio change of a target of SFA-1, target of splicing (tos-1) in WT worms at day 3 and 15 of adulthood ± sfa-1 RNAi by RT-PCR (biological replicates 3 and 4 shown). c, Sequencing read coverage map for ret-1 shows increased exon 5 skipping with age and with sfa-1 RNAi. d, Endogenous ret-1 exon 5 splicing pattern with age and sfa-1 RNAi in WT and DR worms by RT-PCR (day 3 vs. 15, 2 biological replicates shown). e, Sequencing tracks for lipl-7 pre-mRNA. f, Monitoring of intron retention between exons 4 and 5 at day 15 vs. day 3 of adulthood in WT and DR worms, +/− sfa-1 RNAi. g, Sequencing reads tracks for slo-2 pre-mRNA. h, slo-2 alternative exon skipping in day 3 and day 15 old WT and DR worms, +/− sfa-1 RNAi. i, Sequencing reads tracks for lea-1 pre-mRNA j, Alternative exon skipping in lea-1 with age and sfa-1 knockdown in WT and DR animals. Sequencing reads tracks generated by Splicing Java Coverage Viewer as part of SAJR29; height of red lines represent RNA coverage of splice junctions, dark gray boxes represent exonic sequence, light gray boxes are alternative exon sequence.
Extended Data Figure 5. RNA-Seq expression data validation by quantitative RT-PCR.
Monitoring of gene expression levels by quantitative RT-PCR for RNA-Seq data validation of acs-2 (a), rsr-2 (b), fat-6 (c), fat-5 (d), fat-7 (e), acs-17 (f), acdh-2 (g), cpr-1 (h), lips-17 (i) and gst-4 (j) in 6 biological replicates for day 3 old WT worms and 5 biological replicates for all other samples at day 15 (**** p ≤ 0.0001, ***p ≤ 0.001, ** p ≤ 0.01, *p ≤ 0.05, ns > 0.05, error bars RNA-Seq Benjamini Hochberg, qRT-PCR: unpaired, two-tailed t-test)
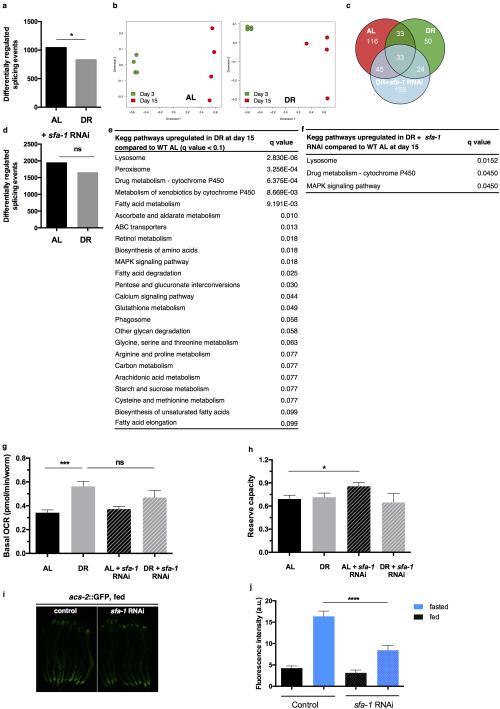
Extended Data Figure 6. Genome-wide effects of DR and SFA-1 depletion on pre-mRNA splicing and metabolism.
a, Differentially regulated splicing events (exons, introns, alternative 5’ and 3’ splice sites) in DR at day 15 compared to AL (p=0.0156, Wilcoxon signed rank test). b, Multidimensional scaling plot of significantly different splicing patterns using inclusion-ratio estimates between day 3 and day 15 old worms (changes in all significant pre-mRNA segments e.g. exons, introns, alternative splice sites considered). c, Venn diagram representing significantly up- or downregulated novel splicing events at day 15 in AL, DR and DR+sfa-1 RNAi (subset of unannotated splice junctions). d, Differentially regulated splicing events (exons, introns, alternative 5’ and 3’ splice sites) with sfa-1 knockdown (AL+ sfa-1 vs. DR+ sfa-1 p=0.7999, Wilcoxon signed rank test). e, KEGG pathways significantly upregulated in DR worm populations at day 15 compared to WT worm populations of the same chronological age with false discovery rate (FDR) of 10%. f, KEGG pathways significantly upregulated in DR worm populations with sfa-1 knockdown at day 15 compared to AL fed worm populations with FDR 10%. Basal respiration (g) and reserve capacity (h) in WT and DR animals (mean ± SEM, *** p ≤ 0.001, *p ≤ 0.05, unpaired two-tailed t-test. Results shown are oxygen consumption rates of day 15 old worms normalized to day 4 old populations, n=100 worms/condition). i, Transcriptional induction of acs-2p::GFP in fed control and sfa-1 knockdown worms (representative image of 2 repeat experiments shown, # worms: ev fed n=83, ev fasted n=77, sfa-1 RNAi fed n=76, 3 sfa-1 RNAi fasted n=84). j, Quantification of acs-2p::GFP after 23 hours of fasting sfa-1 knockdown (mean ± SEM of 2 replicate experiments, p < 0.0001, unpaired two-tailed t-test).
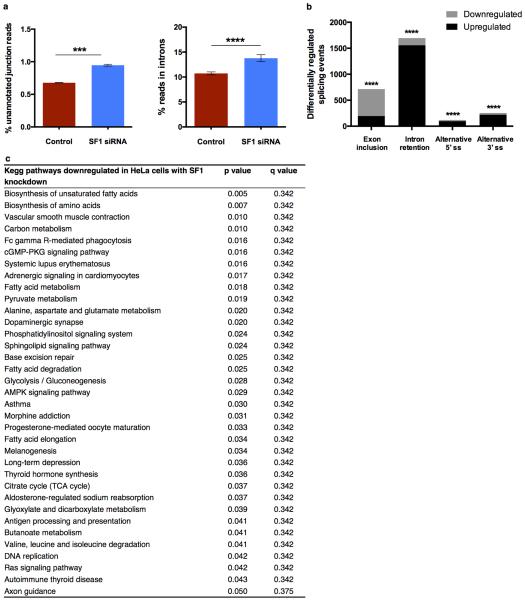
Extended Data Figure 7. Effects of SF1 knockdown in HeLa cells.
a, Effect of splicing factor 1 (SF1) in knockdown HeLa cells on unannotated junction reads (mean ± SEM, p=0.0006) and reads in introns (mean ± SEM, p=0.0242), unpaired, two-tailed t-test after probit transformation. b, Differentially regulated alternative splicing events (exon skipping, intron retention, alternative 5’ and 3’ splice sites) with SF1 knockdown with exons primarily downregulated whereas introns are significantly upregulated (**** p<0.0001, Pearson chi-squared test). c, KEGG pathway analysis of gene expression changes upon SF1 knockdown. Pathways with p ≤ 0.05 considered, p values derived by gage40.
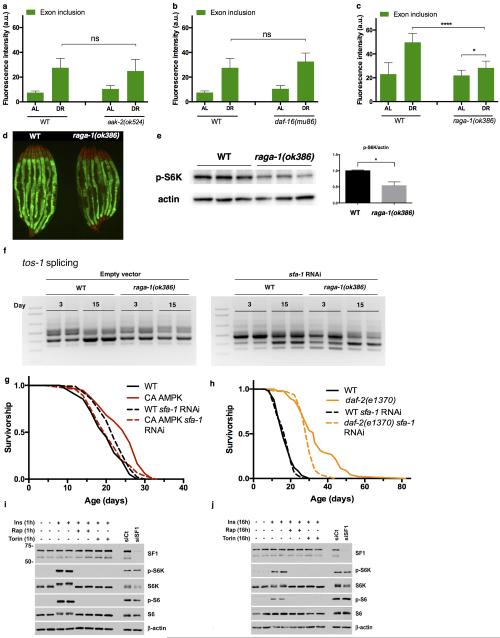
Extended Data Figure 8. SFA-1 and the mTORC1 Pathway.
Quantification of ret-1 minigene exon inclusion (GFP intensity) in aak-2(524) (a, AL vs. DR p=0.5488, ns, unpaired two-tailed t-test, mean ± SD, n=8), and b, in daf-16(mu86) (AL vs. DR p=0.1835, ns, unpaired t-test, mean ± SD, n=8) c, Quantification of GFP in raga-1(ok386) mutants at day 8 on AL and DR (p<0.0001, unpaired two-tailed t-test, mean ± SD) (1 of 3 replicate imaging experiments shown). d, Splicing reporter expression in day 1 old WT and raga-1(ok386) animals. e, Immunoblot of proteins from WT and raga-1(ok386) animals assaying S6K phosphorylation state. f, tos-1 isoform ratios in raga-1(ok386) mutants at day 3 and 15 of adulthood with sfa-1 RNAi (biological replicates shown). g, Survival analysis of sfa-1 RNAi in CA AMPK mutant (p=0.4844, WT + sfa-1 RNAi vs. CA AMPK + sfa-1 RNAi). h, Survival analysis of SFA-1 knockdown in insulin/IGF signalling-mediated longevity (daf-2(e1370), p<0.0001 compared to WT + sfa-1 RNAi). i, Immunoblots of proteins from WT MEFs. p-S6K T389 and p-S6 S240/S244 (markers of mTORC1 activation), total S6K, total S6, non-targeting control siRNAs (siCt), SF1 siRNA, and β-actin (loading control) are shown. j, Immunoblots of proteins from WT MEFs treated for 16h. Biological duplicates are shown except for the siRNA treated lanes. p values survival analysis by log-rank test.
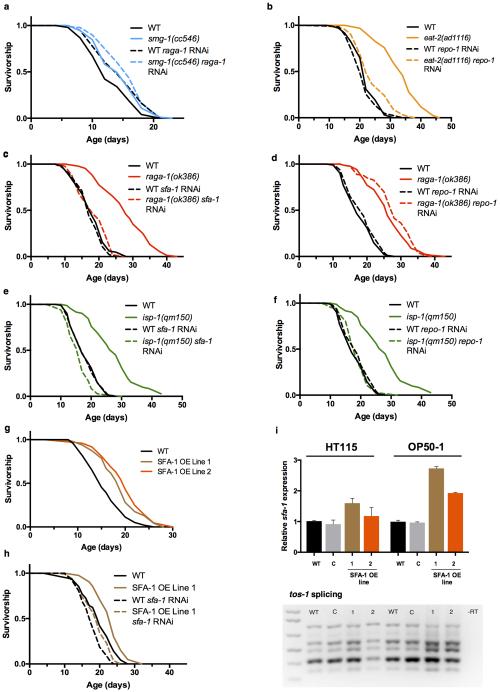
Extended Data Figure 9. Differential effects of sfa-1 and repo-1 knockdown in multiple longevity pathways.
a, Effect of raga-1 RNAi in nonsense mediated decay defective smg-1(cc546) mutant worms (p=0.041 RNAi treatments, lifespan at 24°C). b, Survival of WT and (eat-2(ad1116)) on repo-1 RNAi (p<0.0001, vs. WT+repo-1 RNAi). c, sfa-1 RNAi blocks RAGA-1 mediated longevity (p=0.2181, Gehan-Breslow-Wilcoxon test). d, repo-1 RNAi has no effect on raga-1(ok386) longevity (p<0.0001). e, Effect of sfa-1 RNAi on mitochondrial ETC mutant isp-1(qm150) mediated longevity (p=0.004). f, repo-1 RNAi shortens isp-1(qm150)-mediated longevity to WT levels (p=0.4951). g, Effect of SFA-1 overexpression on WT lifespan on OP50-1 bacteria (p<0.0001 both lines). h, Survival analysis of WT and SFA-1 overexpression lines on sfa-1 RNAi (p=0.0042). i, Top: Monitoring of sfa-1 levels by qRT-PCR (C: injection marker control line; 1, 2: SFA-1 overexpression lines, error bars mean ± SD of 2 biological replicates for strains grown on HT115 bacteria (left), error bars are mean ± SD of 2 technical replicates for strains grown on OP50-1 bacteria (right)) Bottom: tos-1 isoform ratios with SFA-1 overexpression in day 1 adults. p values survival analysis by log-rank test.
Extended Data Table 1.
Effects of splicing factor RNAi on lifespan in WT and DR (eat-2(ad1116)) C. elegans
| Treatment | Median lifespan N2 (days) |
Median lifespan eat-2(ad1116)
(days) |
p-value N2 RNAi vs. eat-2(ad1116)
RNAi |
% Lifespan extension eat-2(ad1116) |
FUDR |
|---|---|---|---|---|---|
| ev * | 22 | 34 | < 0.0001 | 55 | + |
| hrpf-1 | 22 | 34 | < 0.0001 | 55 | + |
| repo-1 | 20 | 22 | < 0.0001 | 10 | + |
| snr-1 | 13 | 13 | 0.5147 | 0 | + |
| sym-2 | 22 | 34 | < 0.0001 | 55 | + |
| ev | 17 | 31 | < 0.0001 | 82 | + |
| sfa-1 | 20 | 20 | 0.9783 | 0 | + |
| ev † | 19 | 25 | < 0.0001 | 32 | + |
| hrp-2 | 11 | 11 | 0.1617 | 0 | + |
| ev ‡ | 17 | 25 | < 0.0001 | 47 | |
| uaf-2 | 12 | 12 | 0.0299 | 0 | |
| hrp-1 | 18 | 23 | < 0.0001 | 28 | |
| phi-9 | 18 | 25 | < 0.0001 | 39 | |
| ev § | 17 | 22 | < 0.0001 | 29 | |
| snr-2 | 11 | 13 | 0.3546 | 18 | |
| er ¶ | 20 | 25 | < 0.0001 | 25 | |
| rsp-3 | 17 | 25 | < 0.0001 | 47 | |
| rsp-2 | 20 | 27 | < 0.0001 | 35 | |
| smu-1 | 17 | 25 | < 0.0001 | 47 | |
| ev | 21 | 24 | < 0.0001 | 14 | |
| uaf-1 | 11 | 9 | 0.6094 | -18 |
ev, empty vector control,
survival curves in Extended Data Figures 2k, l, 9b,
Extended Data Figure 2m,
Extended Data Figure 2n,
Extended Data Figure 2o,
Extended Data Figure 2p.
Supplementary Material
Acknowledgments
C.H. is supported by the Swiss National Science Foundation (P2ZHP3_151609) and the Fonds de la Recherche Luxembourg (AFR7883116). W.B.M. is funded by The Lawrence Ellison Medical Foundation (U54CA155626), The Glenn Foundation for Medical Research and the National Institutes of Health (NIH, 1R01AG044346). C.E. is supported by the Ligue Nationale contre le Cancer. G.H.B and T.K.D. were supported through a grant to B.S.A. from The Novo Nordisk Foundation (NNF13OC0007939). We are grateful to Hidehito Kuroyanagi for providing the splicing reporter strain and corresponding plasmids. We thank Keith Blackwell for providing the glp-4 mutant strain and RNAi constructs. We also thank the Caenorhabditis Genetics Center for providing worm strains. We also thank the Mair lab members for comments and discussion on the project and manuscript.
Footnotes
Supplementary Information is available for this manuscript.
Author contributions
C.H and W.B.M. designed the study, C.H. performed the majority of the experiments and analysed results, A.L. performed experiments and edited the manuscript. T.K.D analysed all the RNA-Seq data. C.E., C.G.S-G and S.D, performed lifespan repeats and C. elegans sample collections, I.M. helped with cloning and crosses. H.J.W performed the oxygen consumption experiments and lifespan repeats. G.H.B. and B.S.A designed and performed the HeLa cells experiments including the sequencing run. Y.Z., G.H. and B.D.M. designed and performed the MEFs and C. elegans immunoblotting experiments. C.H. and W.B.M wrote the manuscript implementing comments and edits from all authors.
Data availability
All RNA-Seq datasets generated and analysed during the current study are available in the ArrayExpress Archive with the accession number: E-MTAB-4866.
The authors declare no competing financial interest.
References
- 1.Kenyon C. The genetics of ageing. Nature. 2010;464:504–12. doi: 10.1038/nature08980. [DOI] [PubMed] [Google Scholar]
- 2.Taylor R, Dillin A. Aging as an Event of Proteostasis Collapse. Cold Spring Harb Perspectives Biology. 2011;3:a004440. doi: 10.1101/cshperspect.a004440. [DOI] [PMC free article] [PubMed] [Google Scholar]
- 3.Vermulst M, et al. Transcription errors induce proteotoxic stress and shorten cellular lifespan. Nature Communications. 2015;6 doi: 10.1038/ncomms9065. [DOI] [PMC free article] [PubMed] [Google Scholar]
- 4.Wang G-S, Cooper T. Splicing in disease: disruption of the splicing code and the decoding machinery. Nat Rev Genet. 2007;8:749–761. doi: 10.1038/nrg2164. [DOI] [PubMed] [Google Scholar]
- 5.Singh R, Cooper T. Pre-mRNA splicing in disease and therapeutics. Trends Mol Med. 2012;18:472–82. doi: 10.1016/j.molmed.2012.06.006. [DOI] [PMC free article] [PubMed] [Google Scholar]
- 6.Lee B, et al. Changes in the expression of splicing factor transcripts and variations in alternative splicing are associated with lifespan in mice and humans. Aging Cell. 2016 doi: 10.1111/acel.12499. doi:10.1111/acel.12499. [DOI] [PMC free article] [PubMed] [Google Scholar]
- 7.Seo M, Park S, Nam H, Lee S-J. RNA helicase SACY-1 is required for longevity caused by various genetic perturbations in Caenorhabditis elegans. Cold Sh Q B. 2016;15:00–00. doi: 10.1080/15384101.2016.1183845. [DOI] [PMC free article] [PubMed] [Google Scholar]
- 8.Rodríguez S, et al. Global genome splicing analysis reveals an increased number of alternatively spliced genes with aging. Aging Cell. 2015;15:267–78. doi: 10.1111/acel.12433. [DOI] [PMC free article] [PubMed] [Google Scholar]
- 9.Curran S, Ruvkun G. Lifespan Regulation by Evolutionarily Conserved Genes Essential for Viability. Plos Genet. 2007;3e56 doi: 10.1371/journal.pgen.0030056. [DOI] [PMC free article] [PubMed] [Google Scholar]
- 10.Gao X, et al. The survival motor neuron gene smn-1 interacts with the U2AF large subunit gene uaf-1 to regulate Caenorhabditis elegans lifespan and motor functions. RNA Biol. 2014;11:1148–1160. doi: 10.4161/rna.36100. [DOI] [PMC free article] [PubMed] [Google Scholar]
- 11.Zhang T, Hwang H-Y, Hao H, Talbot C, Wang J. Caenorhabditis elegans RNA-processing Protein TDP-1 Regulates Protein Homeostasis and Life Span. J Biol Chem. 2012;287:8371–8382. doi: 10.1074/jbc.M111.311977. [DOI] [PMC free article] [PubMed] [Google Scholar]
- 12.Kuroyanagi H, Watanabe Y, Suzuki Y, Hagiwara M. Position-dependent and neuron-specific splicing regulation by the CELF family RNA-binding protein UNC-75 in Caenorhabditis elegans. Nucleic Acids Res. 2013;41:4015–4025. doi: 10.1093/nar/gkt097. [DOI] [PMC free article] [PubMed] [Google Scholar]
- 13.Zahler A. Pre-mRNA splicing and its regulation in Caenorhabditis elegans. Wormbook Online Rev C Elegans Biology. 2012:1–21. doi: 10.1895/wormbook.1.31.2. doi:10.1895/wormbook.1.31.2. [DOI] [PMC free article] [PubMed] [Google Scholar]
- 14.Ramani A, et al. Genome-wide analysis of alternative splicing in Caenorhabditis elegans. Genome Res. 2011;21:342–348. doi: 10.1101/gr.114645.110. [DOI] [PMC free article] [PubMed] [Google Scholar]
- 15.Herndon L, et al. Stochastic and genetic factors influence tissue-specific decline in ageing C. elegans. Nature. 2002;419:808–814. doi: 10.1038/nature01135. [DOI] [PubMed] [Google Scholar]
- 16.Ching T-TT, Hsu A-L. L. Solid plate-based dietary restriction in Caenorhabditis elegans. Journal of visualized experiments?: JoVE. 2011 doi: 10.3791/2701. doi:10.3791/2701. [DOI] [PMC free article] [PubMed] [Google Scholar]
- 17.Lakowski B, Hekimi S. The genetics of caloric restriction in Caenorhabditis elegans. Proceedings of the National Academy of Sciences of the United States of America. 1998;95:13091–6. doi: 10.1073/pnas.95.22.13091. [DOI] [PMC free article] [PubMed] [Google Scholar]
- 18.Krämer A. Purification of splicing factor SF1, a heat-stable protein that functions in the assembly of a presplicing complex. Mol. Cell. Biol. 1992;12:4545–52. doi: 10.1128/mcb.12.10.4545. [DOI] [PMC free article] [PubMed] [Google Scholar]
- 19.Ma L, Horvitz H. Mutations in the Caenorhabditis elegans U2AF large subunit UAF-1 alter the choice of a 3’ splice site in vivo. Plos Genet. 2009;5:e1000708. doi: 10.1371/journal.pgen.1000708. [DOI] [PMC free article] [PubMed] [Google Scholar]
- 20.Ma L, Tan Z, Teng Y, Hoersch S, Horvitz H. In vivo effects on intron retention and exon skipping by the U2AF large subunit and SF1/BBP in the nematode Caenorhabditis elegans. Rna. 2011;17:2201–2211. doi: 10.1261/rna.027458.111. [DOI] [PMC free article] [PubMed] [Google Scholar]
- 21.Fontana L, Partridge L, Longo VD. Extending healthy life span--from yeast to humans. Science. 2010;328:321–6. doi: 10.1126/science.1172539. [DOI] [PMC free article] [PubMed] [Google Scholar]
- 22.Johnson S, Rabinovitch P, Kaeberlein M. mTOR is a key modulator of ageing and age-related disease. Nature. 2013;493:338–345. doi: 10.1038/nature11861. [DOI] [PMC free article] [PubMed] [Google Scholar]
- 23.Stamm S. Regulation of alternative splicing by reversible protein phosphorylation. The Journal of biological chemistry. 2008;283:1223–7. doi: 10.1074/jbc.R700034200. [DOI] [PubMed] [Google Scholar]
- 24.Yu Y, et al. Phosphoproteomic analysis identifies Grb10 as an mTORC1 substrate that negatively regulates insulin signaling. Science (New York, N.Y.) 2011;332:1322–6. doi: 10.1126/science.1199484. [DOI] [PMC free article] [PubMed] [Google Scholar]
- 25.Hsu P, et al. The mTOR-regulated phosphoproteome reveals a mechanism of mTORC1-mediated inhibition of growth factor signaling. Sci New York N Y. 2011;332:1317–22. doi: 10.1126/science.1199498. [DOI] [PMC free article] [PubMed] [Google Scholar]
- 26.Wang X, et al. Phosphorylation of splicing factor SF1 on Ser20 by cGMP-dependent protein kinase regulates spliceosome assembly. Embo J. 1999;18:4549–59. doi: 10.1093/emboj/18.16.4549. [DOI] [PMC free article] [PubMed] [Google Scholar]
- 27.Tanackovic G, Krämer A. Human splicing factor SF3a, but not SF1, is essential for pre-mRNA splicing in vivo. Molecular biology of the cell. 2005;16:1366–77. doi: 10.1091/mbc.E04-11-1034. [DOI] [PMC free article] [PubMed] [Google Scholar]
- 28.Zhang D, Paley AJ, Childs G. The transcriptional repressor ZFM1 interacts with and modulates the ability of EWS to activate transcription. The Journal of biological chemistry. 1998;273:18086–91. doi: 10.1074/jbc.273.29.18086. [DOI] [PubMed] [Google Scholar]
- 29.Mazin P, et al. Widespread splicing changes in human brain development and aging. Molecular Systems Biology. 2013;9:633–633. doi: 10.1038/msb.2012.67. [DOI] [PMC free article] [PubMed] [Google Scholar]
- 30.Mair W, et al. Lifespan extension induced by AMPK and calcineurin is mediated by CRTC-1 and CREB. Nature. 2011;470:404–408. doi: 10.1038/nature09706. [DOI] [PMC free article] [PubMed] [Google Scholar]
- 31.Burkewitz K, et al. Neuronal CRTC-1 Governs Systemic Mitochondrial Metabolism and Lifespan via a Catecholamine Signal. Cell. 2015;160:842–855. doi: 10.1016/j.cell.2015.02.004. [DOI] [PMC free article] [PubMed] [Google Scholar]
- 32.Martin M. Cutadapt removes adapter sequences from high-throughput sequencing reads. EMBnet.journal. 2011;17:10–12. [Google Scholar]
- 33.Dobin A, et al. STAR: ultrafast universal RNA-seq aligner. Bioinformatics (Oxford, England) 2013;29:15–21. doi: 10.1093/bioinformatics/bts635. [DOI] [PMC free article] [PubMed] [Google Scholar]
- 34.Anders S, Pyl PT, Huber W. HTSeq--a Python framework to work with high-throughput sequencing data. Bioinformatics (Oxford, England) 2015;31:166–9. doi: 10.1093/bioinformatics/btu638. [DOI] [PMC free article] [PubMed] [Google Scholar]
- 35.Cunningham F, et al. Ensembl 2015. Nucleic acids research. 2015;43:D662–9. doi: 10.1093/nar/gku1010. [DOI] [PMC free article] [PubMed] [Google Scholar]
- 36.Love MI, Huber W, Anders S. Moderated estimation of fold change and dispersion for RNA-seq data with DESeq2. Genome biology. 2014;15:550. doi: 10.1186/s13059-014-0550-8. [DOI] [PMC free article] [PubMed] [Google Scholar]
- 37.Hansen K, Irizarry R, WU Z. Removing technical variability in RNA-seq data using conditional quantile normalization. Biostatistics. 2012;13:204–216. doi: 10.1093/biostatistics/kxr054. [DOI] [PMC free article] [PubMed] [Google Scholar]
- 38.Benjamini Y, Hochberg Y. Controlling the false discovery rate: a practical and powerful approach to multiple testing. Journal of the Royal Statistical Society. Series B. 1995;57:289–300. doi:10.2307/2346101. [Google Scholar]
- 39.Young MD, Wakefield MJ, Smyth GK, Oshlack A. Gene ontology analysis for RNA-seq: accounting for selection bias. Genome biology. 2010;11:R14. doi: 10.1186/gb-2010-11-2-r14. [DOI] [PMC free article] [PubMed] [Google Scholar]
- 40.Luo W, Friedman MS, Shedden K, Hankenson KD, Woolf PJ. GAGE: generally applicable gene set enrichment for pathway analysis. BMC bioinformatics. 2009;10:161. doi: 10.1186/1471-2105-10-161. [DOI] [PMC free article] [PubMed] [Google Scholar]
- 41.Yu G, Wang LG, Han Y, He QY. clusterProfiler: an R package for comparing biological themes among gene clusters. Omics: a journal of integrative biology. 2012;16:284–287. doi: 10.1089/omi.2011.0118. doi:10.1089/omi.2011.0118. [DOI] [PMC free article] [PubMed] [Google Scholar]
Associated Data
This section collects any data citations, data availability statements, or supplementary materials included in this article.


