

Abstract
Purpose
To compare the lesion sizes of choroidal neovascularization (CNV) imaged with spectral-domain (SD) and swept-source (SS) optical coherence tomography angiography (OCTA) and measured using an automated detection algorithm.
Methods
Patients diagnosed with CNV were imaged by SD-OCTA and SS-OCTA systems using 3 × 3-mm and 6 × 6-mm scans. The complex optical microangiography (OMAGC) algorithm was used to generate the OCTA images. Optical coherence tomography A datasets for imaging CNV were derived by segmenting from the outer retina to 8 μm below Bruch's membrane. An artifact removal algorithm was used to generate angiograms free of retinal vessel projection artifacts. An automated detection algorithm was developed to quantify the size of the CNV. Automated measurements were compared with manual measurements. Measurements from SD-OCTA and SS-OCTA instruments were compared as well.
Results
Twenty-seven eyes from 23 subjects diagnosed with CNV were analyzed. No significant differences were detected between manual and automatic measurements: SD-OCTA 3 × 3-mm (P = 0.61, paired t-test) and 6 × 6-mm (P = 0.09, paired t-test) scans and the SS-OCTA 3 × 3-mm (P = 0.41, paired t-test) and 6 × 6-mm (P = 0.16, paired t-test) scans. Bland-Altman analyses were performed to confirm the agreement between automatic and manual measurements. Mean lesion sizes were significantly larger for the SS-OCTA images compared with the SD-OCTA images: 3 × 3-mm scans (P = 0.011, paired sample t-test) and the 6 × 6-mm scans (P = 0.021, paired t-test).
Conclusions
The automated algorithm measurements of CNV were in agreement with the hand-drawn measurements. On average, automated SS-OCTA measurements were larger than SD-OCTA measurements and consistent with the results from using hand-drawn measurements.
Keywords: optical coherence tomography, swept-source OCTA, spectral-domain OCTA, neovascular AMD, macular neovascularization, pigment epithelium detachment
Choroidal neovascularization (CNV) is a characteristic feature of late-stage age-related macular degeneration (AMD) and is characterized by the growth of abnormal blood vessels from the choroid through Bruch's membrane and under the retinal pigment epithelium (type 1) with possible extension into the subretinal space (type 2).1 Currently the clinical staging of neovascular AMD is based on fluorescein angiography (FA), indocyanine angiography (ICGA), and optical coherence tomography (OCT) structural imaging. Traditional OCT imaging can provide three-dimensional structural information about the retina and choroid that aids in the diagnosis and management of exudative neovascular AMD (nvAMD).1,2 However, structural OCT imaging is not able to directly visualize the functional blood vessels composing the CNV. Instead, CNV is visualized directly by using the dye-based angiographic techniques of FA and ICGA.
The recent development of OCT-based angiography (OCTA)3–6 allows for the direct visualization of the retinal and choroidal vasculature. Optical coherence tomography A is fast, safe, noninvasive, and inexpensive compared with FA and ICGA. Optical coherence tomography A imaging of CNV has attracted a great deal of interest.4,7–13 Most studies have used spectral-domain OCTA (SD-OCTA) systems operating at 840-nm wavelength, due to the availability of commercial systems. However, light at this wavelength is heavily scattered and absorbed by the retinal pigment epithelium (RPE) complex, which can affect the ability to visualize CNV in nvAMD.
Swept-source OCTA (SS-OCTA) utilizes a wavelength around 1000 to 1100 nm, which reduces scattering and absorption of the RPE complex, allowing for deeper penetration of light into the choroid.14–18 This longer wavelength is also safer for the eye, so greater laser power can be used to obtain images compared with commercially available SD-OCTA instruments, which should result in improved detection of weak signal scattered from the choroid. Furthermore, at a given laser power, SS-OCT has a reduced sensitivity roll-off along the imaging depth range compared with SD-OCT.19–22 These advantages, combined with the faster scanning rates and thus denser scanning patterns that can be achieved with similar acquisition times, would suggest that SS-OCTA should perform better than SD-OCTA in the detection of CNV. Novais et al.23 compared the detection of CNV using both SD-OCTA and SS-OCTA instruments in eyes with nvAMD, concluding that SS-OCT performed better than SD-OCT. However, that study used different segmentation schemes for each image, limiting the general applicability of the results.
While measurements of neovascular lesions are typically performed by manually outlining the CNV on angiograms, this strategy is often difficult and labor intensive. To avoid the biases of manual graders, the need for different segmentation strategies, and the time-consuming nature of manual grading, we propose the adoption of a standardized en face segmentation strategy to visualize OCTA images of CNV and the use of an automated segmentation algorithm to measure the size of the CNV from these OCT angiograms. The aim of the current study was to validate our automated algorithm against manual measurements performed by expert graders using both SD-OCTA and SS-OCTA images and to compare the automated measurements of CNV obtained using the two different instruments.
Methods
Patient Inclusion and Exclusion Criteria
One hundred fifteen eyes from 90 patients with exudative AMD were imaged and enrolled at the Bascom Palmer Eye Institute in a prospective OCT imaging study from October 2015 to April 2016. The Institutional Review Board of the University of Miami Miller School of Medicine approved the study, and an informed consent was obtained from all the patients. The study was performed in accordance with the tenets of the Declaration of Helsinki and compliant with the Health Insurance Portability and Accountability Act of 1996. Thirty-five eyes were excluded because the CNV was not fully contained within the 3 × 3-mm scan area. An additional 53 eyes were excluded because of signal quality problems with at least one of the four scans, which included scans with signal strength below 6 or excessive motion artifacts.
Twenty-seven eyes from 23 patients with neovascular AMD were identified as candidates for this study. Thirteen (56%) of the 23 patients were men. Mean patient age was 77.4 years and ranged from 51 to 88 years. At the time of imaging, 25 of 27 eyes had received prior intravitreal therapy with vascular endothelial growth factor (VEGF) inhibitors; one eye received an injection on the day of imaging due to new-onset exudation, and one eye had CNV without exudation and was being observed as previously described.20
Imaging Devices and Scanning Protocol
Spectral-domain OCTA and SS-OCTA devices were used in this study. Each patient recruited in the comparison study was imaged by both systems at the same visit. Both 3 × 3- and 6 × 6-mm scans were acquired from each eye by each system. All scans were centered on the fovea, and FastTrac motion correction software (Carl Zeiss Meditec, Inc., Dublin, CA, USA) was used while the images were acquired.
Spectral-domain OCTA was performed using a commercially available AngioPlex instrument (Cirrus 5000 HD-OCT system provided by Carl Zeiss Meditec, Inc.), operating at a central wavelength of 840 nm and an A-scan rate of 68,000 Hz. The system provided an axial resolution of ∼5 μm in tissue and an estimated lateral resolution of ∼15 μm at the retinal surface. For the 3 × 3-mm scans, 245 A-lines formed one B-scan, while B-scans were acquired at 245 different spatial locations and repeated four times at each location. This scanning protocol resulted in a uniform spacing of 12.2 μm between pixels in the final en face OCTA images. For the 6 × 6-mm scans, 350 A-lines for each B-scan and 350 spatial locations were sampled, resulting in a uniform spacing of 17.1 μm between pixels in the final en face OCTA images. In contrast to the 3 × 3-mm scan, the 6 × 6-mm scan uses two B-scan repetitions at each spatial location.
The SS-OCTA instrument (a prototype system provided by Carl Zeiss Meditec, Inc.) used a swept laser source with a central wavelength of 1050 nm (1000–1100 nm full bandwidth) and operated at 100,000 A-scans per second. The axial and lateral resolutions of the system were ∼5 μm in tissue and ∼14 μm at the retinal surface. Due to the faster scanning speed, a denser sampling strategy was adopted. For 3 × 3-mm scans, a 300 × 300-pixel array was used (10.0-μm spacing between pixels), while for 6 × 6-mm scans, a 420 × 420-pixel array was used (14.3 μm). The repetition strategy was the same as described for SD-OCTA scans: four repetitions for 3 × 3-mm scans and two repetitions for 6 × 6-mm scans.
Both the SD-OCT and SS-OCT datasets were processed using the complex optical microangiography (OMAGC) algorithm24–26 to generate the angiographic signals. A semiautomated segmentation algorithm was applied to identify relevant retinal layers,27 and manual corrections were carried out as necessary to ensure an accurate segmentation. In particular, we evaluated en face angiograms (Fig. 1) produced using a slab extending from the outer boundary of the outer plexiform layer to 8 μm beneath Bruch's membrane (BM). This slab is referred to as the outer retina to choriocapillaris (ORCC) slab, and it has been shown to be useful for visualizing important features of type I and type II CNV.20
Figure 1.
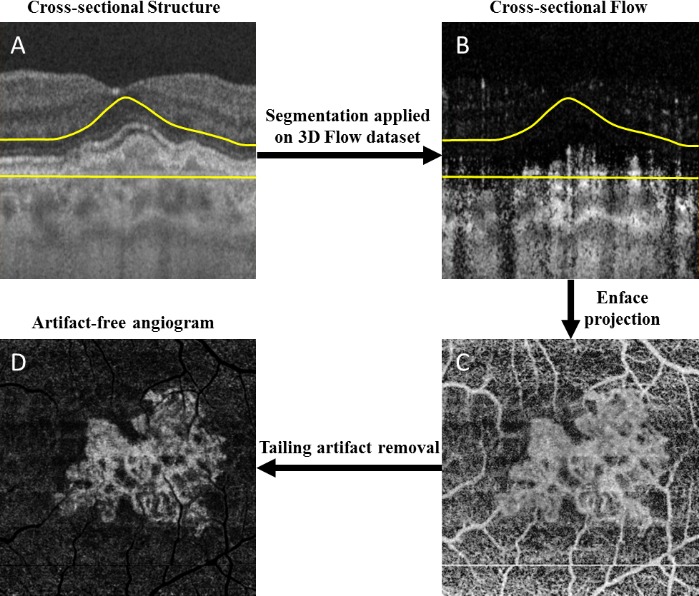
Outer retina to choriocapillaris (ORCC) optical coherence tomography angiography (OCTA) images with tailing artifact removal. (A) Representative cross-sectional OCT structural image with segmentation lines to define the ORCC slab; (B) corresponding OCTA flow image; (C) naïve en face ORCC angiogram; (D) en face ORCC angiogram following removal of retinal vessel projection artifacts. The yellow lines define the segmentation lines for the ORCC layer, which extends from the outer boundary of outer plexiform layer to 8 μm below Bruch's membrane.
Due to the hyperreflection from the RPE, the resulting ORCC en face image includes projection artifacts from the overlying retinal blood vessel.28 For better visualization and detection of the CNV, we developed an artifact removal algorithm29 to minimize the effect of the projection artifacts and improve the visualization of CNV (Fig. 1D). These images were used in the measurements of the lesion sizes as discussed below.
Automatic Detection of CNV Lesion Size
An automated algorithm was developed to segment CNV in the en face ORCC images. Figure 2 illustrates the main steps composing the algorithm. First, the contrast of the artifact-free ORCC angiogram (Fig. 2A) was enhanced through an adaptive thresholding method using the following equation:
 |
where Iin(x,y) and Iout(x,y) are the input and output images, respectively, with (x,y) indicating the pixel coordinates in the image. The parameters α > 0 and β are the gain and bias parameters, controlling contrast and brightness, respectively. In this study, α = 0.5 and β = 100 for both the systems based on the OCT system signal-to-noise ratio and signal strength, which results in a contrast-enhanced image (Fig. 2B). Next, the resulting image (Fig. 2B) was low-pass filtered to remove noise through a convolution operation:
 |
where G0 is a two-dimensional Gaussian low-pass filter
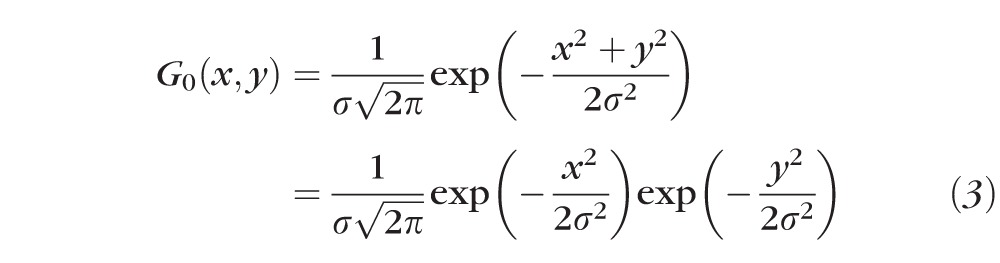 |
and σ = 5 was used in this study. Otsu's adaptive threshold method30 was subsequently applied to produce a binary image (Fig. 2C) from which the neovascular border/contour outline (Fig. 2D) was extracted by morphologic dilation followed by the Canny edge detection.31 The neovascular lesion size was calculated by summing the areas of the pixels within the region bounded by the contour line (Fig. 2E).
Figure 2.
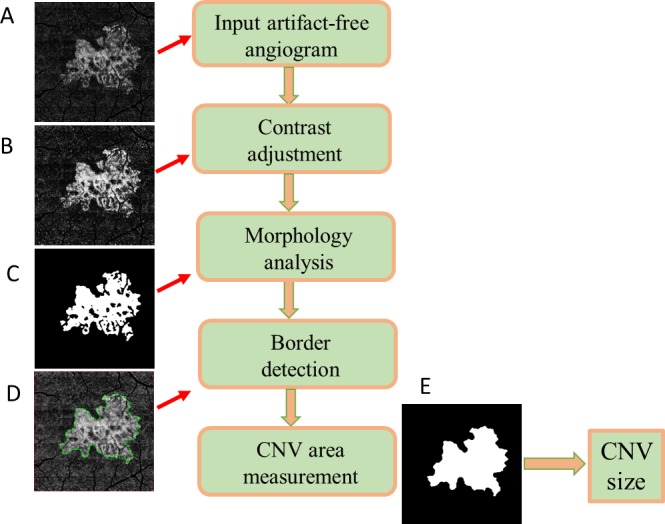
Flow chart of the automated algorithm to segment the choroidal neovascularization (CNV). (A) The artifact-free ORCC angiogram. (B) Image contrast of the ORCC angiogram is enhanced through an adaptive thresholding method. (C) Binary image is obtained through smoothing and Otsu's adaptive thresholding methods. (D) The contour of CNV boundary is detected through morphologic analysis. (E) The CNV lesion size is measured as the area bounded by the contour line. CNV, choroidal neovascularization.
Choroidal neovascularization lesion size was measured using this algorithm on en face ORCC angiograms from both SD-OCTA and SS-OCTA instruments. In addition, two graders (JROD and ZY), masked to instrument type that was used to acquire the image, manually outlined the CNV lesions from the same artifact-free ORCC angiograms and calculated the corresponding lesion sizes. Neither of the graders reviewed the images prior to grading. The two sets of measurements were analyzed and compared in order to validate our automated algorithm.
Statistical Analysis
Paired sample t-tests and Bland-Altman analyses32,33 were performed to detect differences in neovascular lesion size between manual and automatic measurements and between the instruments. Pearson product–moment models were used to investigate the correlation between automatic and manual measurements for all the groups (including 3 × 3- and 6 × 6-mm scans on SS-OCTA imaging; 3 × 3- and 6 × 6-mm scans on SD-OCTA imaging) as well as the correlation between SD-OCTA and SS-OCTA for both 3 × 3- and 6 × 6-mm scans based on automated area measurements. P values below 0.05 were considered statistically significant.
Results
Images from 27 eyes of 23 patients were available for this study, as described in our companion paper.34 For each of these eyes, both the 3 × 3- and 6 × 6-mm scans from the SD-OCTA and from the SS-OCTA device were analyzed.
Comparison Between Automatic and Manual Measurements
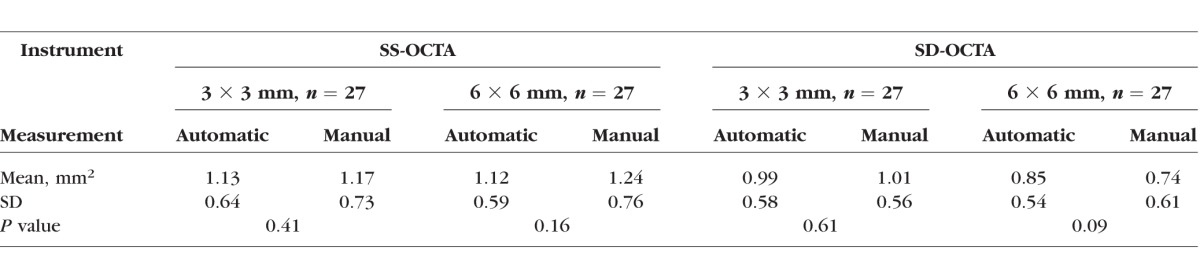
Table 1 summarizes the comparisons between the manual and automated measurements obtained from the two instruments. No significant differences were found between automatic and manual measurements for both instruments using the 3 × 3-mm scans (P = 0.41 and 0. 61 for SS-OCTA and SD-OCTA, respectively; paired sample t-test) and the 6 × 6-mm scans (P = 0.16 and 0.09 for SS-OCTA and SD-OCTA, respectively; paired sample t-test). These results show that the automated algorithm produces lesion size measurements comparable to the manual ones.
Table 1.
Comparison Between Automatic and Manual Measurements of Choroidal Neovascularization
Linear regression analyses show statistically significant relationships between automatic and manual measurements for all the groups (Fig. 3), with correlation coefficients of 0.898 on the 3 × 3-mm scans, 0.719 on the 6 × 6-mm scans using SS-OCTA imaging, 0.822 on the 3 × 3-mm scans, and 0.693 on the 6 × 6-mm scans using SD-OCTA imaging.
Figure 3.

Automated versus manual measurements of CNV for different scan areas and different instruments. (A) SS-OCTA measurements for 3 × 3-mm scans; (B) SS-OCTA measurements for 6 × 6-mm scans; (C) SD-OCTA measurements for 3 × 3-mm scans; (D) SD-OCTA measurements for 6 × 6-mm scans. SS-OCTA, swept-source optical coherence tomography angiography; SD-OCTA, spectral-domain optical coherence tomography angiography.
Bland-Altman analyses are shown in Figure 4, indicating strong agreement between automatic and manual measurements. However, we find greater variations of the measurements obtained from the 6 × 6-mm scans compared with the 3 × 3-mm scans.
Figure 4.

Bland-Altman analyses for automatic and manual measurements. (A) 3 × 3-mm scans by SS-OCTA. (B) 6 × 6-mm by SS-OCTA. (C) 3 × 3 mm by SD-OCTA. (D) 6 × 6 mm by SD-OCTA. The thick line represents the mean difference, and top and bottom dotted lines indicate the 95% limits of agreement (mean difference ± 1.96 standard deviation [SD] of the difference). The line of equality is shown as the thin dotted line across the zero-difference line. The shaded areas represent the confidence interval limits for mean and agreement limits. SS-OCTA, swept-source optical coherence tomography angiography; SD-OCTA, spectral-domain optical coherence tomography angiography.
Comparisons Between Two Devices
Figure 5 shows examples of the automated segmentation of lesion from 3 × 3- and 6 × 6-mm scans. For both the devices, the 3 × 3-mm angiograms delivered clearer visualization of the CNV with better contrast and image quality. Swept-source OCTA angiograms provided a better overall signal-to-noise ratio and greater vascular details compared with SD-OCTA.
Figure 5.

Automated measurements of choroidal neovascularization (CNV) based on artifact-free ORCC angiograms using both 3 × 3- and 6 × 6-mm scans obtained using SS-OCTA (top row) and SD-OCTA (bottom row) imaging. (A, C, E, G) ORCC angiograms. (B, D, F, H) ORCC angiograms showing the CNV segmentation. SS-OCTA, swept-source optical coherence tomography angiography; SD-OCTA, spectral-domain optical coherence tomography angiography; ORCC, outer retina to choriocapillaris.
Table 2 summarizes the automated measurements of neovascular lesions on the two devices. Significant differences between the instruments were found for both 3 × 3-mm scan (P = 0.011, paired sample t-test) and 6 × 6-mm scan (P = 0.021, paired sample t-test) images. The sizes of the CNV were consistently larger when measured on the SS-OCTA angiograms compared with the SD-OCTA angiograms.
Table 2.
Comparison of Neovascular Lesion Sizes Measured Automatically From the SS-OCTA and SD-OCTA Images
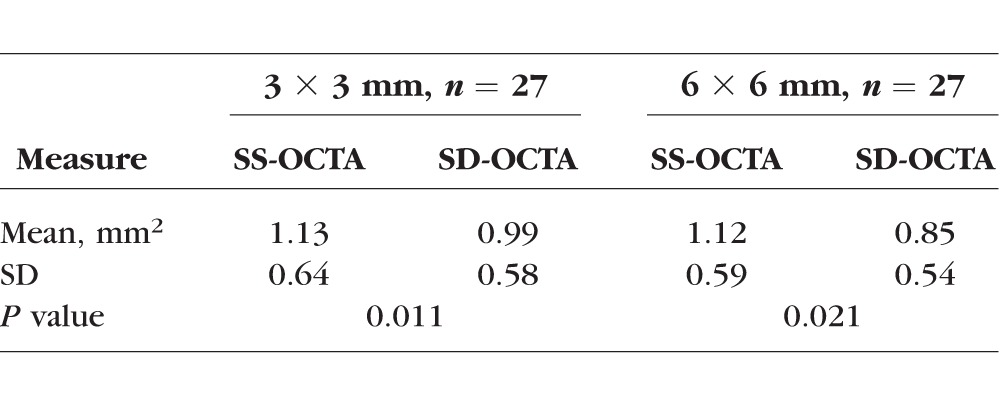
There was a statistically significant correlation between automated area measurements on SD-OCTA and SS-OCTA for both scans, with P < 0.001 and R2 = 0.810 for the 3 × 3 mm (Fig. 6A) and P = 0.013 and R2 = 0.223 for 6 × 6 mm (Fig. 6B), although the results were more variable for the 6 × 6-mm scans. Bland-Altman analyses are shown in Figures 6C and 6D. For 3 × 3-mm scans, the mean difference (bias) is 0.15 mm2, indicating that SS-OCTA gives consistently larger measurements for the CNV. The same is true for 6 × 6 mm, but with a larger mean difference (0.28 mm2) and standard deviation (SD) compared with the 3 × 3-mm scans.
Figure 6.

Linear regression and Bland-Altman analyses comparing SS-OCTA and SD-OCTA images on the 3 × 3- and 6 × 6-mm angiograms. (A) Comparison of lesion areas obtained with the different instruments for the 3 × 3-mm scans. (B) Comparison of lesion areas obtained with the different instruments for the 6 × 6-mm scans. (C) Bland-Altman analysis for the lesion areas obtained with the different instruments for the 3 × 3-mm scans. (D) Bland-Altman analysis for the lesion areas obtained with the different instruments for the 6 × 6-mm scans. For the Bland-Altman analyses, thick lines indicate the mean difference, and top and bottom dotted lines indicate the 95% limits of agreement (mean difference ± 1.96 standard deviation [SD] of the difference). The line of equality is shown as the thin dotted line across the zero-difference line. The shaded areas represent the confidence interval limits for mean and agreement limits. CNV, choroidal neovascularization; SS-OCTA, swept-source optical coherence tomography angiography; SD-OCTA, spectral-domain optical coherence tomography angiography.
Discussion
Optical coherence tomography angiography is a new imaging technology that shows great promise for visualizing vascular pathology in retinal and choroidal diseases.7–14,19–22 Spectral-domain OCTA and SS-OCTA are two different configurations capable of performing OCT angiography. However, few studies have investigated the difference between SD-OCTA and SS-OCTA for visualizing CNV in AMD. The study conducted by Novais et al.23 was the first to describe the differences between these two configurations for imaging CNV in AMD, and the authors demonstrated that SS-OCTA was better at visualizing neovascularization beneath the RPE. However, the comparison was confounded by the use of different slabs for different scans, as well as the presence of projection artifacts from the overlying retinal blood vessels. In this study, we adopted a standard ORCC slab to visualize the CNV combined with a projection artifact removal algorithm.29 Moreover, we introduced an automated segmentation algorithm to quantify the CNV and validated this algorithm against hand-drawn measurements performed by expert graders. Automated quantification could eliminate possible subjective bias in manual measurement of CNV, and, more importantly, can produce fast, easily obtained measurements that could be useful in a clinical setting for the longitudinal monitoring of lesion growth, a strategy that should prove important in the management of CNV in nvAMD patients.
In the current study, we validated our algorithm by analyzing the agreement between automated and manual measurements of CNV. We found no significant difference between the two methods in all cases, although the variability was larger in the 6 × 6-mm scans than in the 3 × 3-mm scans. Our results indicated that our automated algorithm performs well on both SD-OCTA and SS-OCTA systems, and it is useful for quantitative, longitudinal assessment of CNV.
We also compared the differences in automated measurements of lesion sizes across our instruments with different scan sizes. Significant differences were found between the two instruments on both scan patterns (P = 0.011 for 3 × 3 mm and P = 0.021 for 6 × 6 mm, paired sample t-test). There was a statistically significant correlation between SD-OCTA and SS-OCTA measurements for both types of scans. However, the SS-OCTA scans produced consistently larger lesion sizes. This result appears to indicate that SS-OCTA might be able to visualize and measure more of the CNV compared with SD-OCTA imaging. This is consistent with the expected theoretical advantages of the SS-OCT system. In particular, the use of a 1050-nm wavelength in the SS-OCTA instrument reduces the optical scattering and absorption from the RPE complex and allows for the safe use of greater laser power, resulting in increased signal from structures below the RPE, including type 1 CNV. Moreover, SS-OCT systems have the advantage of a smaller sensitivity roll-off compared with SD-OCT.35 These considerations should lead to better results when imaging CNV using SS-OCTA and would explain larger lesion area measurements, as we found both using manual segmentations and our automated algorithm.
The differences between the SS-OCTA and SD-OCTA manual and automated measurements of CNV for the 6 × 6- and 3 × 3-mm scans were statistically significant. This may be explained by the contrast-to-noise ratio (CNR) of the ORCC angiograms. From the point of view of image processing and pattern recognition, the CNR of the images would affect both the manual and automated measurements. For the images with higher CNR, for example, 3 × 3-mm scans, both the automated and manual measurements would provide reliable measurements of CNV; therefore, it is not a surprise that they deliver similar values (Table 1). For 6 × 6-mm scans, the ORCC angiograms have lower CNR values, which may challenge the automated algorithm's ability to quantitate the true size of the CNV. The larger measurement using the manual approach in lower CNR images may be due to grader's bias because experienced graders may guess at the places where the CNR is low.
There are a number of limitations in our study. The sample size is relatively small. Also, OCT signal strength was not explicitly considered in the development of the automated algorithm or in the assessment of the results. Therefore, it is not clear how the OCT signal strength might affect CNV measurements.
In conclusion, we have developed an automated algorithm to quantify the size of CNV in nvAMD. The automated results have been validated against manual measurements, and we carried out a comparison between SD-OCTA and SS-OCTA instruments. Our results show that SS-OCTA imaging delivers consistently better image quality, higher contrast on the ORCC angiograms, and larger measurements of CNV compared with SD-OCTA imaging. Robust and reliable automated measurements may help clinicians in their ability to assess the longitudinal changes in the size of CNV during therapy and help improve the retreatment paradigms.
Acknowledgments
Supported by grants from Carl Zeiss Meditec, Inc. (Dublin, CA), the National Eye Institute (R01EY024158), an unrestricted grant from Research to Prevent Blindness, Inc., New York, New York, and the National Eye Institute Center Core Grant (P30EY014801) to the Department of Ophthalmology, University of Miami Miller School of Medicine; CAPES Foundation, Ministry of Education of Brazil, Brasília–Brazil (LR), and from the German Research Foundation (DFG) no. SCHA 1869/1-1 (KBS). RKW received an innovative research award from Research to Prevent Blindness.
Disclosure: Q. Zhang, None; C.-L. Chen, None; Z. Chu, None; F. Zheng, None; A. Miller, None; L. Roisman, None; J. Rafael de Oliveira Dias, None; Z. Yehoshua, Acucela (F), Apellis (F); K.B. Schaal, None; W. Feuer, None; G. Gregori, Carl Zeiss Meditec, Inc. (F), P; S. Kubach, Carl Zeiss Meditec, Inc. (E); L. An, Carl Zeiss Meditec, Inc. (E); P.F. Stetson, Carl Zeiss Meditec, Inc. (E); M.K. Durbin, Carl Zeiss Meditec, Inc. (E); P.J. Rosenfeld, Carl Zeiss Meditec, Inc. (F), Acucela (C, F), Apellis (F), Genentech/Roche (C, F), GlaxoSmithKline (F), Neurotech (C, F), Ocata Therapeutics (C, F), Tyrogenex (C, F), Achillion Pharmaceuticals (C), Alcon (C), Cell Cure Neurosciences (C), Chengdu Kanghong Biotech (C), CoDa Therapeutics (C), Healios K.K. (C), F. Hoffmann-La Roche Ltd. (C), MacRegen, Inc. (C), NGM Biopharmaceuticals (C), Regeneron (C), Stealth BioTherapeutics (C), Vision Medicine (C); R.K. Wang, Tasso, Inc. (F), Insight Photonic Solutions (C), Westface Medical (C), Kowa (C), Carl Zeiss Meditec, Inc. (F), P
References
- 1. Gess AJ,, Fung AE,, Rodriguez JG. Imaging in neovascular age-related macular degeneration. Semin Ophthalmol. 2011; 26: 225–233. [DOI] [PubMed] [Google Scholar]
- 2. Rosenfeld PJ. Optical coherence tomography and the development of antiangiogenic therapies in neovascular age-related macular degeneration. Invest Ophthalmol Vis Sci. 2016; 57: OCT14–OCT26. [DOI] [PMC free article] [PubMed] [Google Scholar]
- 3. Wang RK,, Jacques SL,, Ma Z,, et al. Three dimensional optical angiography. Opt Express. 2007; 15: 4083–4097. [DOI] [PubMed] [Google Scholar]
- 4. de Carlo TE,, Bonini Filho MA,, Chin AT,, et al. Spectral-domain optical coherence tomography angiography of choroidal neovascularization. Ophthalmology. 2015; 122: 1228–1238. [DOI] [PubMed] [Google Scholar]
- 5. Zhang A,, Zhang Q,, Chen CL,, Wang RK. Methods and algorithms for optical coherence tomography-based angiography: a review and comparison. J Biomed Opt. 2015; 20: 100901. [DOI] [PMC free article] [PubMed] [Google Scholar]
- 6. Gao SS,, Jia YL,, Zhang M,, et al. Optical coherence tomography angiography. Invest Ophthalmol Vis Sci. 2016; 57: OCT27–OCT36. [DOI] [PMC free article] [PubMed] [Google Scholar]
- 7. Kuehlewein L,, Bansal M,, Lenis TL,, et al. Optical coherence tomography angiography of type 1 neovascularization in age-related macular degeneration. Am J Ophthalmol. 2015; 160: 739–748.e2. [DOI] [PubMed] [Google Scholar]
- 8. Kuehlewein L,, Dansingani KK,, de Carlo TE,, et al. Optical coherence tomography angiography of type 3 neovascularization secondary to age-related macular degeneration. Retina. 2015; 35: 2229–2235. [DOI] [PubMed] [Google Scholar]
- 9. Dansingani KK,, Freund KB. Optical coherence tomography angiography reveals mature, tangled vascular networks in eyes with neovascular age-related macular degeneration showing resistance to geographic atrophy. Ophthalmic Surg Lasers Imaging Retina. 2015; 46: 907–912. [DOI] [PubMed] [Google Scholar]
- 10. Muakkassa NW,, Chin AT,, de Carlo T,, et al. Characterizing the effect of anti-vascular endothelial growth factor therapy on treatment-naive choroidal neovascularization using optical coherence tomography angiography. Retina. 2015; 35: 2252–2259. [DOI] [PubMed] [Google Scholar]
- 11. El Ameen A,, Cohen SY,, Semoun O,, et al. Type 2 neovascularization secondary to age-related macular degeneration imaged by optical coherence tomography angiography. Retina. 2015; 35: 2212–2218. [DOI] [PubMed] [Google Scholar]
- 12. Coscas GJ,, Lupidi M,, Coscas F,, Cagini C,, Souied EH. Optical coherence tomography angiography versus traditional multimodal imaging in assessing the activity of exudative age-related macular degeneration: a new diagnostic challenge. Retina. 2015; 35: 2219–2228. [DOI] [PubMed] [Google Scholar]
- 13. Spaide RF. Optical coherence tomography angiography signs of vascular abnormalization with antiangiogenic therapy for choroidal neovascularization. Am J Ophthalmol. 2015; 160: 6–16. [DOI] [PubMed] [Google Scholar]
- 14. Barteselli G,, Bartsch DU,, Weinreb RN,, et al. Real-time full-depth visualization of posterior ocular structures: comparison between full-depth imaging spectral domain optical coherence tomography and swept-source optical coherence tomography. Retina. 2016; 36: 1153–1161. [DOI] [PMC free article] [PubMed] [Google Scholar]
- 15. Ting DS,, Cheung GC,, Lim LS,, Yeo IY. Comparison of swept source optical coherence tomography and spectral domain optical coherence tomography in polypoidal choroidal vasculopathy. Clin Exp Ophthalmol. 2015; 43: 815–819. [DOI] [PubMed] [Google Scholar]
- 16. Unterhuber A,, Povazay B,, Hermann B,, Sattmann H,, Chavez-Pirson A,, Drexler W. In vivo retinal optical coherence tomography at 1040 nm - enhanced penetration into the choroid. Opt Express. 2005; 13: 3252–3258. [DOI] [PubMed] [Google Scholar]
- 17. Povazay B,, Hermann B,, Unterhuber A,, et al. Three-dimensional optical coherence tomography at 1050 nm versus 800 nm in retinal pathologies: enhanced performance and choroidal penetration in cataract patients. J Biomed Opt. 2007; 12: 041211. [DOI] [PubMed] [Google Scholar]
- 18. Wang RK,, An L. Multifunctional imaging of human retina and choroid with 1050nm spectral domain optical coherence tomography at 92 kHz line scan rate. J Biomed Opt. 2011; 16: 050503. [DOI] [PMC free article] [PubMed] [Google Scholar]
- 19. Zhang Q,, Wang RK,, Chen CL,, et al. Swept source optical coherence tomography angiography of neovascular macular telangiectasia type 2. Retina. 2015; 35: 2285–2299. [DOI] [PMC free article] [PubMed] [Google Scholar]
- 20. Roisman L,, Zhang Q,, Wang RK,, et al. Optical coherence tomography angiography of asymptomatic neovascularization in intermediate age-related macular degeneration. Ophthalmology. 2016; 123: 1309–1319. [DOI] [PMC free article] [PubMed] [Google Scholar]
- 21. Moult E,, Choi W,, Waheed NK,, et al. Ultrahigh-speed swept-source OCT angiography in exudative AMD. Ophthalmic Surg Lasers Imaging Retina. 2014; 45: 496–505. [DOI] [PMC free article] [PubMed] [Google Scholar]
- 22. Choi W,, Mohler KJ,, Potsaid B,, et al. Choriocapillaris and choroidal microvasculature imaging with ultrahigh speed OCT angiography. PLoS One. 2013; 8: e81499. [DOI] [PMC free article] [PubMed] [Google Scholar]
- 23. Novais EA,, Adhi M,, Moult EM,, et al. Choroidal neovascularization analyzed on ultra-high speed swept source optical coherence tomography angiography compared to spectral domain optical coherence tomography angiography. Am J Ophthalmol. 2016; 64: 80–88. [DOI] [PMC free article] [PubMed] [Google Scholar]
- 24. Huang Y,, Zhang Q,, Thorell MR,, et al. Swept-source OCT angiography of the retinal vasculature using intensity differentiation-based optical microangiography algorithms. Ophthalmic Surg Lasers Imaging Retina. 2014; 45: 382–389. [DOI] [PMC free article] [PubMed] [Google Scholar]
- 25. An L,, Subhush HM,, Wilson DJ,, Wang RK. High-resolution wide-field imaging of retinal and choroidal blood perfusion with optical microangiography. J Biomed Opt. 2010; 15: 026011. [DOI] [PMC free article] [PubMed] [Google Scholar]
- 26. Wang RK,, An L,, Francis P,, Wilson DJ. Depth-resolved imaging of capillary networks in retina and choroid using ultrahigh sensitive optical microangiography. Opt Lett. 2010; 35: 1467–1469. [DOI] [PMC free article] [PubMed] [Google Scholar]
- 27. Yin X,, Chao JR,, Wang RK. User-guided segmentation for volumetric retinal optical coherence tomography images. J Biomed Opt. 2014; 19: 086020. [DOI] [PMC free article] [PubMed] [Google Scholar]
- 28. Spaide RF,, Fujimoto JG,, Waheed NK. Image artifacts in optical coherence tomography angiography. Retina. 2015; 35: 2163–2180. [DOI] [PMC free article] [PubMed] [Google Scholar]
- 29. Zhang AQ,, Zhang QQ,, Wang RK. Minimizing projection artifacts for accurate presentation of choroidal neovascularization in OCT micro-angiography. Biomed Opt Express. 2015; 6: 4130–4143. [DOI] [PMC free article] [PubMed] [Google Scholar]
- 30. Otsu N. A threshold selection method from gray-level histograms. IEEE Trans Syst Man Cybern Syst. 1979; 9: 62–66. [Google Scholar]
- 31. Canny J. A Computational approach to edge detection. IEEE Trans Pattern Anal Mach Intell. 1986; 8: 679–698. [PubMed] [Google Scholar]
- 32. Bland JM,, Altman DG. Measuring agreement in method comparison studies. Stat Methods Med Res. 1999; 8: 135–160. [DOI] [PubMed] [Google Scholar]
- 33. Giavarina D. Understanding Bland Altman analysis. Biochem Med (Zagreb). 2015; 25: 141–151. [DOI] [PMC free article] [PubMed] [Google Scholar]
- 34. Miller AR,, Roisman L,, Zhang Q,, et al. Comparison between spectral-domain and swept-source optical coherence tomography angiographic imaging of choroidal neovascularization. Invest Ophthalmol Vs Sci. 2017; 58: 1499–1505. [DOI] [PMC free article] [PubMed] [Google Scholar]
- 35. Choma MA,, Sarunic MV,, Yang CH,, Izatt JA. Sensitivity advantage of swept source and Fourier domain optical coherence tomography. Opt Express. 2003; 11: 2183–2189. [DOI] [PubMed] [Google Scholar]