

Abstract
Background
Non-targeted metabolomics based on mass spectrometry enables high-throughput profiling of the metabolites in a biological sample. The large amount of data generated from mass spectrometry requires intensive computational processing for annotation of mass spectra and identification of metabolites. Computational analysis tools that are fully integrated with multiple functions and are easily operated by users who lack extensive knowledge in programing are needed in this research field.
Results
We herein developed an R package, metaX, that is capable of end-to-end metabolomics data analysis through a set of interchangeable modules. Specifically, metaX provides several functions, such as peak picking and annotation, data quality assessment, missing value imputation, data normalization, univariate and multivariate statistics, power analysis and sample size estimation, receiver operating characteristic analysis, biomarker selection, pathway annotation, correlation network analysis, and metabolite identification. In addition, metaX offers a web-based interface (http://metax.genomics.cn) for data quality assessment and normalization method evaluation, and it generates an HTML-based report with a visualized interface. The metaX utilities were demonstrated with a published metabolomics dataset on a large scale. The software is available for operation as either a web-based graphical user interface (GUI) or in the form of command line functions. The package and the example reports are available at http://metax.genomics.cn/.
Conclusions
The pipeline of metaX is platform-independent and is easy to use for analysis of metabolomics data generated from mass spectrometry.
Electronic supplementary material
The online version of this article (doi:10.1186/s12859-017-1579-y) contains supplementary material, which is available to authorized users.
Keywords: Metabolomics, Pipeline, Workflow, Quality control, Normalization
Background
Biochemicals (metabolites) with low molecular masses are the ultimate products of biological metabolism, while a metabolome represents the total composite in a given biological system and reflects the interactions among an organism’s genome, gene expression status and the relevant micro-environment [1]. The most prevalent technology used in analysis of metabolomics is non-targeted mass spectrometry (MS) coupled with either liquid chromatography (LC-MS) or gas chromatography (GC-MS) [2, 3]. Generally, these techniques generate a set data of mass spectra with chromatography that includes retention time, peak intensity and chemical masses. Data analysis involves stepwise procedures including peak picking, quality control, data cleaning, preprocessing, univariate and multivariate statistical analysis and data visualization. A number of software packages are available for MS-based metabolomics data analysis as listed in Table 1, including propriety commercial, open-source, and online workflows. The MS manufacturers generally provide propriety software, like SIEVE (Thermo Scientific), MassHunter (Agilent Technologies) and Progenesis QI (Waters), which are often limited in scope and function. Open-source software, such as XCMS [4], CAMERA [5], MAIT [6], MetaboAnalyst [7] and Workflow4Metabolomics [8], usually cover limited processing steps. There is no such comprehensive pipeline that is used across the metabolomics community [9, 10]. Referring to the capabilities of the tools mainly used (as shown in Table 1), an automatic and comprehensive open source pipeline is urgent in bioinformatics analysis of metabolomics. Basically, the pipeline aims for users to easily perform end-to-end metabolomics data analysis with a flexible combination of different methods to efficiently integrate new modules and to build customized pipelines in multiple ways.
Table 1.
Qualitative assessment of metaX compared to other existing metabolomics tools
| No. | 1 | 2 | 3 | 4 | 5 | 6 | 7 | 8 | 9 | 14 | 15 | 10 | 11 | 12 | 13 | 14 |
|---|---|---|---|---|---|---|---|---|---|---|---|---|---|---|---|---|
| Feature | metaX | MAIT | Workflow4Metabolomics | MetMSLine | metaMS | MetaboNexus | MetaboAnalyst | XCMSOnline | MeltDB | Mzmine | Mzmatch | apLCMS | EigenMS | Metab | Metabomxtr | Metabolomics |
| Year | 2015 | 2014 | 2014 | 2013 | 2013 | 2014 | 2009 | 2012 | 2008 | 2006 | 2011 | 2009 | 2014 | 2011 | 2014 | 2014 |
| Language | R, Java | R | R, Perl, Python, Java | R | R | R | R, Java | R | perl, JavaScript and R | JAVA | JAVA, R | R | R | R | R | R |
| Platform independent | √ | √ | √ | √ | √ | Windows only | √ | √ | √ | √ | √ | √ | √ | √(windows & MacOS) | √ | √ |
| Open source | √ | √ | √ | √ | √ | √ | √ | √ | project- and user-specific access | √ | √ | √ | √ | √ | √ | √ |
| Usable offline | √ | √ | √ | √ | √ | √ | √ | - | - | √ | √ | √ | √ | √ | √ | √ |
| Power analysis | √ | - | - | - | - | - | √ | - | - | - | - | - | - | - | - | - |
| Automatic outlier samples finding | √ | - | √ | √ | - | - | - | - | - | - | - | - | - | - | - | - |
| PCA | √ | √ | √ | √ | - | √ | √ | √ | √ | √ | - | - | - | - | - | √ |
| Cluster analysis | √ | √ | √ | √ | - | √ | √ | - | √ | √ | - | - | - | - | - | √ |
| PLS-DA | √ | √ | √ | - | - | √ | √ | - | √ | - | - | - | - | - | - | - |
| ROC analysis | √ | - | - | - | - | √ | √ | - | - | - | - | - | - | - | - | - |
| Normalization | Sum, PQN, VSN, QC-RSC, ComBat, SVR, quantiles | - | Linear or local polynomial regression fitting | QC-LSC | - | Internal standard or quantile normalization | Normalized by sum/median, Normalized by reference sample/feature, sample specific normalization and quantile normalization | - | Normalized by specific compound or feature | Linear normalizaiton, normalized by internal standards | Normalized by Reference sample | - | combination of ANOVA and singular value decomposition | internal standard, medium, biomass(divides the intensity of each metabolite in a specific sample by the value of the biomass measured for this specific sample) | normalized using a mixture model with batch-specific thresholds and run order correction | normalized by sum,mean or media of each sample;normalized by specific reference;normalized by internal standards or optimal selection of multiple internal standards; |
| Biomarker analysis | √ | - | - | - | - | √ | √ | - | - | - | - | - | - | - | - | - |
| Correlation network analysis | √ | - | - | - | - | - | - | - | - | - | - | - | - | - | - | - |
| Metabolite identification | √ | √ | √ | √ | √ | √ | - | √ | √ | √ | √ | √ | - | - | - | - |
| Functional analysis | √ | - | - | - | - | √ | √ | - | √ | - | - | - | - | - | - | - |
| Quality assessment | √ | - | √ | - | - | - | - | √ | - | - | - | - | - | - | - | - |
| Peak picking | √ | √ | √ | - | √ | √ | √ | √ | √ | √ | √ | √ | - | - | - | - |
| HTML-Based report | √ | - | - | - | - | - | (PDF) | - | (PDF) | - | - | - | - | - | - | - |
We herein developed a comprehensive workflow for analysis of metabolomics data, termed metaX. At the present time, R [11] is a popular statistical programming environment and provides a convenient environment for statistical analysis of metabolomic and other -omics data [12, 13]. We thus designed metaX as an R package that automates analysis of untargeted metabolomics data acquired from LC/MS or GC/MS and offers a user-friendly web-based interface for data quality assessment and normalization evaluation. This workflow, which is open source and rich in functions, encourages experienced programmers to improve the relevant functions or to build their own pipeline within the R framework. Overall, metaX aims to be a tool array that utilizes an end-to-end statistical analysis of metabolomics data.
Implementation
A stepwise overview of data processing using metaX is illustrated in Fig. 1.
Fig. 1.
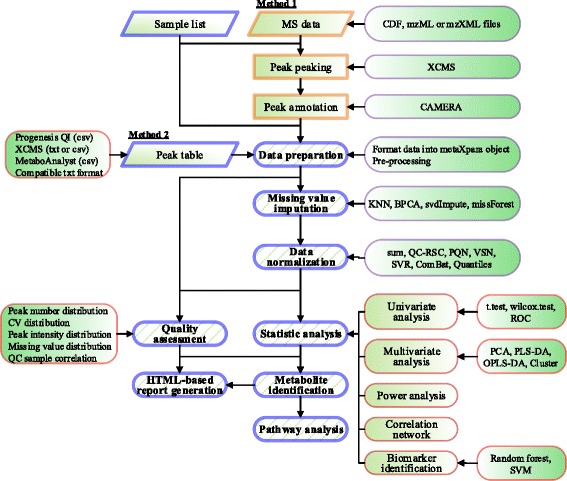
Overview of metaX. This figure summarizes the main modules, functions and features of metaX. The input data and the functions are included in the figure
Peak picking and inputs
In general, metaX can take mzXML files as input or a peak table file as input. If taking mzXML files as input, metaX will use the R package XCMS [4] to detect peaks, then use the CAMERA [5] package to perform peak annotation. If a peaks table file is an input, metaX transforms the table data from a peak detection software, such as Progenesis QI (exported comma separated value (csv) format file), into an R object compatible with the subsequent workflow.
Pre-processing of raw peak data metabolite
The raw peak intensity data was pre-processed in metaX. Firstly, if a metabolite feature is detected in < 50% of quality control (QC) samples or detected in < 20% of experimental samples, it is removed from data analysis [14]. Secondly, a missing value after the first filtering is retained and imputed. In metaX, four methods are implemented to perform missing value imputation: k-nearest neighbor (KNN), Bayesian principal component analysis replacement (BPCA), svdImpute and random forest imputation (missForest) [15].
Data scaling and transformation
Five different scaling approaches are offered in metaX: Pareto scaling, vast scaling, range scaling, autoscaling and level scaling [16]. The formulas of these scaling approaches are described in detail elsewhere [16]. In addition, three transformation approaches are offered in metaX: log, generalized logarithm (glog) and cube root transformation.
Removal of outliers
metaX provides the ability to automatically remove the outlier samples in the pre-processed data based on expansion of the Hotelling’s T2 distribution ellipse [17]. A sample within the first and second component principal component analysis (PCA) score plot beyond the expanded ellipse is removed, and then the PCA model is recalculated. In default mode, three rounds of outlier removal are performed.
Normalization
A metabolomics dataset usually contains unwanted variations introduced by signal drift/attenuation and multiplicative noise across the dynamic range. These effects can detrimentally impact the significant signal discovery and MS features that are required for rigorous quality assurance [14, 18]. In metaX, two types of normalization methods are provided: 1) Sample-based normalization is used to correct different concentrations of samples, such as normalization to total sum, probabilistic quotient normalization (PQN), variance stabilizing normalization (VSN) and quantile-based methods. 2) Peak-based normalization is implemented to correct data within batch experiment analytical variation and batch-to-batch variation in large-scale studies [19]. In this normalization, if a study contains QC samples, the QC-robust spline batch correction (QC-RSC) can be used to alleviate the effects of peak area attenuation [19]. During normalization, the degree of smoothening is controlled by a parameter that sets the proportion of points for smoothening at each point, while in metaX, this parameter is automatically assigned by using leave-one-out cross validation. On the basis of QC samples, a metabolite feature with a coefficient of variation (CV) over the predetermined value is excluded after normalization. The CV threshold could be set by users; generally, CV values ≤ 30% are recommended. Support vector regression (SVR) [20] and ComBat [21] normalization methods are also implemented in metaX. A user-friendly web-based interface (http://metax.genomics.cn) was offered for rapid evaluation of the data normalization methods for a specified dataset.
Assessment of data quality
Pre- and post-normalization, the data quality is visually assessed in several aspects, 1) the peak number distribution, 2) the number of missing value distribution, 3) the boxplot of peak intensity, 4) the total peak intensity distribution, 5) the correlation heatmap of QC samples if available, 6) the metabolite m/z (or mass) distribution, 7) the plot of m/z versus retention time, and 8) the PCA score or loading plot of all samples. There are two ways to perform data quality assessment in metaX, the command line mode and the user-friendly web-based interface at http://metax.genomics.cn/.
Univariate and multivariate statistical analysis
metaX offers both univariate and multivariate statistical analysis. For univariate statistical analysis, the parametric statistical test (Students t-test), non-parametric statistical test (Mann-Whitney U test), and classical univariate receiver operating characteristic (ROC) curve analysis are implemented. For multivariate statistical analysis, metaX offers functionalities for cluster analysis, multivariate modelling, including PCA, partial least squares-discriminant analysis (PLS-DA) and orthogonal partial least squares-discriminant analysis (OPLS-DA), with numerical and graphical results and diagnostics (optimal number of components estimated by cross-validation, R2, Q2, variable importance in projection (VIP), statistical significance of the model by permutation testing) [22]. In terms of the univariate test analysis, metaX also offers the false discovery rate (FDR)-corrected p-value by using the Benjamini-Hochberg FDR algorithm [23]. The PLS-DA was implemented based on the functions from the pls package [24], and the OPLS-DA was performed using the functions from the ropls package [25].
Power and sample size analysis
metaX offers an easy-to-use function to perform the power and sample size analysis. This function is based on the Bioconductor package SSPA [26] and outputs a figure to show the distribution curve of sample size versus the estimated power.
Metabolite correlation network analysis
metaX offers two types of network analysis. One is the correlation network analysis without regard for experimental groups information, and the other is differential correlation network analysis, which aims to identify metabolite correlation differences in a physiological state. The former was implemented using the cor function from the stats package to calculate the correlation coefficient, and the latter was implemented using the function comp.2.cc.fdr from the DiffCorr package [27] to calculate the significantly differential correlations. The igraph package [28] was used for network analysis and visualization. In addition, the network can be exported as a file in formats such as gml and pajek, which can be imported into Cytoscape [29] and Gephi [30] for network analysis and visualization. Both of the correlation network analyses aim to describe the correlation patterns among metabolites across samples, in which nodes represent metabolites and edges represent the correlation between different metabolites. The network analysis offers a complementary method to univariate and multivariate statistical analysis methods.
Metabolite identification
Currently, metaX provides a function for metabolite identification based on the Human Metabolome Database (HMDB) [31], KEGG [32, 33], MassBank [34], PubChem [35], LIPID MAPS [36], MetaCyc [37] and PlantCyc (www.plantcyc.org). Moreover, metaX can easily be extended to support the other databases. The metabolites having molecular weights within a specified tolerance to the query m/z or molecular weight value are retrieved from the databases as putative identifications. The information of adducts and isotopes is utilized to assist in metabolite identification if it is present. The default tolerance is 10 ppm.
Functional analysis
At present, metaX provides a function for metabolite pathway analysis based on IMPaLA [38].
Biomarker analysis
metaX uses functions from the R package “caret” to perform the biomarker selection, model creation and performance evaluation [39]. Currently, two methods, random forest [40] and support vector machine (SVM), are implemented to automatically select the metabolites which show the best performance. After the best set features are selected, a randomForest model can be created and the ROC curve can be plotted.
HTML-based report generation
metaX outputs an HTML-based report by using the Nozzle package [41], which contains quality assessment plots and other analysis results.
Results and discussion
To illustrate the applications of metaX, a published non-targeted LC-MS metabolomics dataset from a coronary heart disease (CHD) study was used [42, 43]. The dataset consisted of two batches of 138 plasma samples (59 CHD patients, 43 healthy controls and 36 QC samples) acquired in positive ion mode on an LTQ Orbitrap Velos instrument (Thermo Fisher Scientific, MA, USA). LC-MS raw data files were converted to mzXML format using ProteoWizard (version 3.0.5941) [44] and then were processed by XCMS [4] and CAMERA [5] for peak picking and peak annotation, respectively. In total, 1438 features were retained for downstream analysis. The mzXML files can be downloaded from the Dryad Digital Repository [43]. It merits to note that the study focus is mainly on the software application and its capabilities, not on the biological interpretation of the generated results.
Quality assessment of metabolomics data using metaX
In metabolomics studies, data quality checks are crucial prerequisites to achieve reliable results. metaX offers a quick and easy data quality check of metabolomics data. This can be done using the R function in metaX or a user-friendly web interface at the website http://metax.genomics.cn/ as shown in Fig. 2. The mainly QC charts generated by metaX for the CHD dataset are illustrated in Figs. 3 and 4. The number of features detected per sample over the analysis time (injection order) is illustrated in Fig. 4c, revealing that the peaks acquired from any group, disease, healthy and QC, are randomly distributed. The intensities of all features per samples before and after normalization over the analysis time (injection order) are illustrated in Fig. 3a and b, respectively. The missing value distribution is shown in Fig. 3e, which gives an overview of the percent of missing values of all features in both the QC and experiment samples. According to Chawade’s view, the total missing value plot and the total intensity plot derived from raw data and treated with/without normalization could be used to identify sample outliers [45]. Our analysis supported this. The correlation plots of QC samples before and after normalization by SVR are illustrated in Fig. 3c and d and indicate that the lowest correlation efficiency is enhanced from approximately 0.7 to 0.9. The CV distribution of all features before and after normalization for each group is displayed in Fig. 3f, implying that after normalization, the signal quality is obviously improved. The sum intensity of all features per sample before and after normalization over the analysis time (injection order) is illustrated in Fig. 4a and b, suggesting that normalization could narrow the signal variation. The score plots of PCA for the raw feature intensity data and the normalized data are shown in Fig. 4d and e, respectively, which give an overview of the dataset and showing trends, groupings and outliers before data normalization and after data normalization. The score plot of PCA (Fig. 4d) for the non-normalized data provided a simple and easily interpretable visual check of the presence of batch effects. In Fig. 4d, the two data batches appear as two separated groups upon PCA analysis without normalization, whereas in Fig. 4e, after normalization the batch effect was reduced and all of the QC samples were clustered tightly, which provides an initial evaluation of the data quality. Overall, these QC charts demonstrate the necessity of normalization for metabolomics data, while metaX enables overview of the data quality with different charts.
Fig. 2.
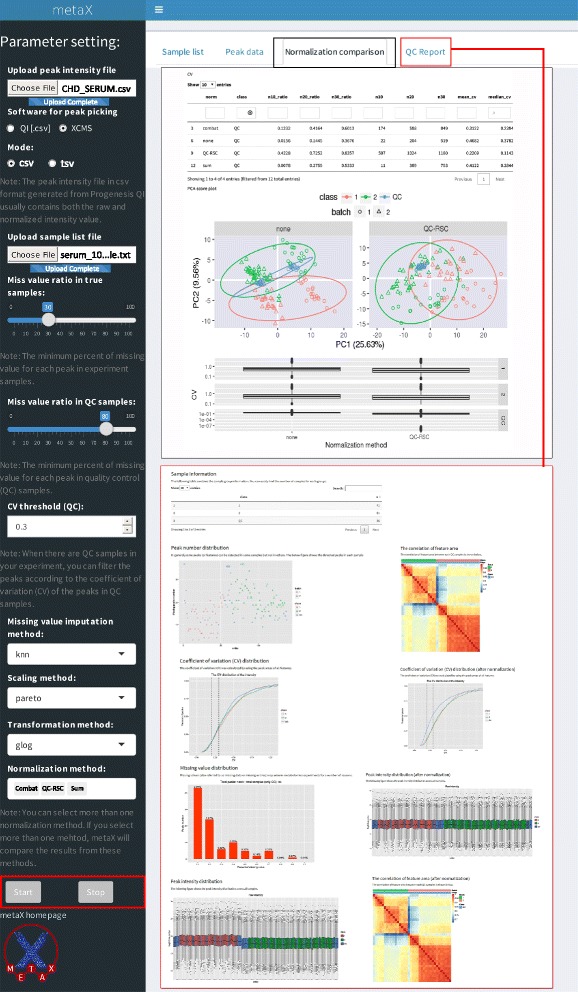
User interface of metaX for quality assessment and normalization evaluation
Fig. 3.
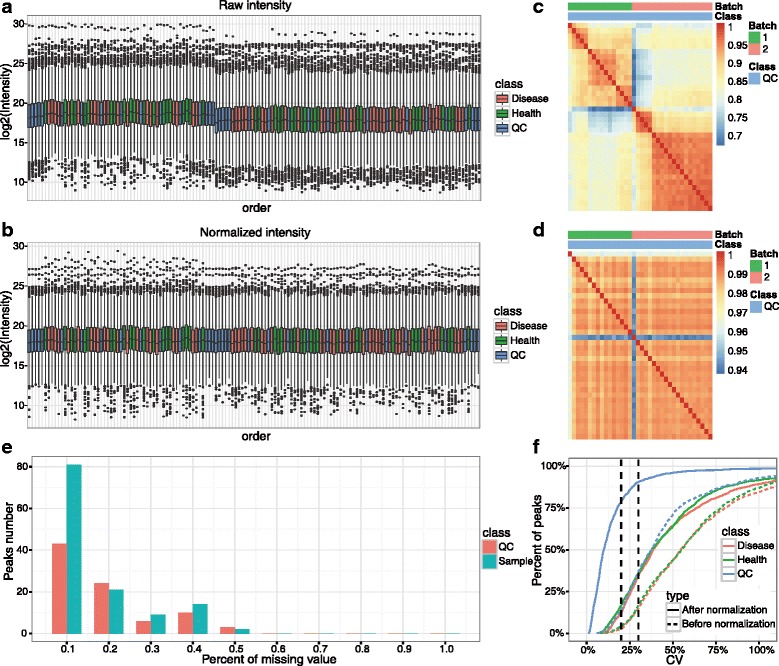
QC charts generated by metaX. a The intensity of feature distribution before normalization. b The intensity of feature distribution after normalization. c The correlation plot of QC samples before normalization. d The correlation plot of QC samples after normalization. e The missing value distribution in experimental and QC samples. f The CV distribution of all features before and after normalization for each group
Fig. 4.
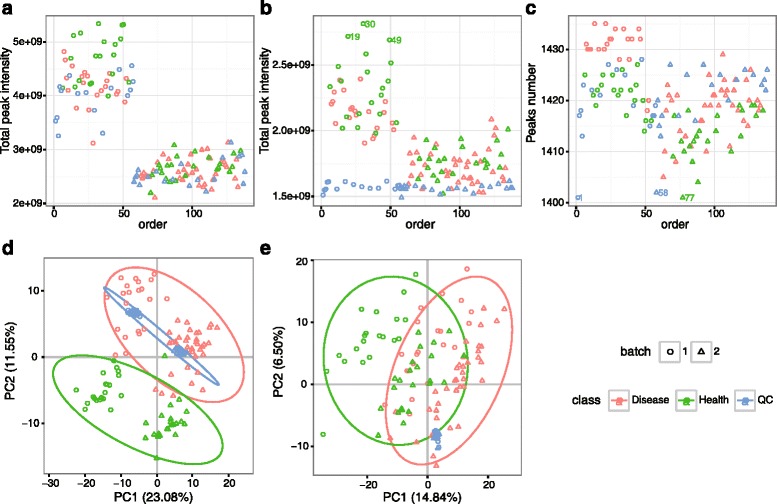
QC charts generated by metaX. a The sum intensity of all features per sample before normalization over the analysis time (injection order). b The sum intensity of all features per sample after normalization over the analysis time (injection order). c The number of features per sample over the analysis time (injection order). d The score plot of PCA for the raw feature intensity data. e The score plot of PCA for the normalized data
Evaluation of normalization methods using metaX
A systematic bias in high-throughput metabolomics data is often introduced by various steps of sample processing and data generation. Data normalization can reduce systematic biases. A question related to this issue is how to select a proper normalization method. metaX provides a user-friendly web-based Shiny application (http://metax.genomics.cn) for this purpose. To select the optimal normalization approach for the CHD dataset, seven methods are evaluated using metaX. Figure 5 shows the score plots of PCA using different normalization methods. They indicate that after normalization using QC-RSC, ComBat or SVR, all of the QC samples are clustered more tightly, and the batch effect is effectively reduced compared with other methods. Table 2 presents the quantitative comparison metrics acquired by the different methods. From the results it is clear that all normalization methods performed better than non-normalization used in most of the metrics. Specifically, SVR detects the largest number of features (1293) with CV ≤ 30% in QC samples, followed by QC-RSC (1191). For the average CV of features in QC samples, SVR achieved the best performance, followed by QC-RSC. This is similar to the findings in a previous study [20]. However, QC-RSC could detect the largest number of differentially expressed features (178), followed by SVR (170). Taken together, for this data set, SVR could be an optimal normalization method, thus it was chosen as the default normalization method for the downstream analysis.
Fig. 5.
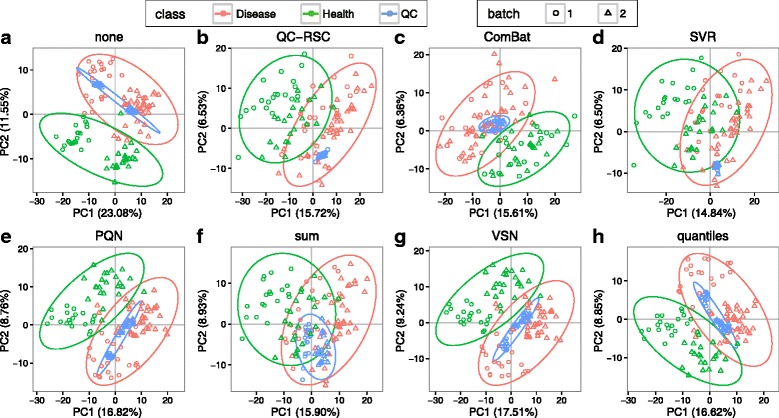
Comparison of different normalization methods from PCA. a none, b QC-RSC, c ComBat, d SRV, e) PQN, f sum, g VSN and h quantiles. The different points in the figures refer to different samples, and the samples were color-coded according to their group information and shape-coded according to their batch information
Table 2.
The comparison of different normalization methods
| Methods | NO. of peaks | NO. of peaks (CV ≤ 30%)a | DEFb | Mean (CV) CHD d | Mean (CV) Health d | Mean (CV) QC e |
|---|---|---|---|---|---|---|
| ComBat | 1438 | 930 | 127 | 0.4261 | 0.3816 | 0.1636 |
| none | 1438 | 527 | 65 | 0.4865 | 0.4739 | 0.2114 |
| QC_RSC | 1438 | 1191 | 178 | 0.5108 | 0.4664 | 0.1098 |
| SVR | 1438 | 1293 | 170 | 0.4853 | 0.4583 | 0.1081 |
| PQN | 1438 | 793 | 125 | 0.4945 | 0.4681 | 0.1777 |
| Quantiles | 1438 | 740 | 118 | 0.4911 | 0.4646 | 0.1895 |
| sum | 1438 | 761 | 119 | 0.5044 | 0.4733 | 0.1979 |
| VSN | 1438 | 772 | 120 | 0.5014 | 0.4761 | 0.1912 |
Note:
aAfter normalization, the number of peaks with CV ≤ 30% in QC samples
bDEF: differentially expressed features with q-value < = 0.05, fold change > = 1.5 or fold change < = 0.667 and VIP > = 1
cMean (CV) CHD: The average CV of peaks in CHD disease group
dMean (CV) Health: The average CV of peaks in health group
eMean (CV) QC: The average CV of peaks in QC group
Univariate and multivariate statistical analysis
Data for the QC samples are removed from the dataset prior to univariate and multivariate analysis in metaX. For univariate analysis, Mann-Whitney U test and Students t-test are performed to compare disease and health groups, followed by false discovery correction using the Benjamini-Hochberg method using metaX. The results, along with the fold change of the disease group versus health group, are presented in Additional file 1: Table S1. In total, 171 features (13.22% of total features) are detected under the criteria of the corrected p-value (Mann-Whitney U test) ≤ 0.05, fold change ≥ 1.5 or ≤ 0.667 and VIP > =1, and 170 features (13.15% of total features) are detected under the criterion of the corrected p-value (Students t-test) ≤ 0.05, fold change ≥ 1.5 or ≤ 0.667 and VIP > = 1. The result is comparable with that of the previous study [42].
For multivariate analysis, PCA, PLS-DA and OPLS-DA are performed by metaX. In PCA analysis, the normalized peak intensity matrix is glog transformed, followed by Pareto scaling and centering, and then two components are selected. The PCA score and loading plots are shown in Fig. 6a and b, respectively. The score plot indicates that there is an apparent difference between the disease and health groups. For PLS-DA and OPLS-DA, the normalized peak intensity matrix is also glog transformed, followed by Pareto scaling and centering. Two components are selected for PLS-DA and two components (one orthogonal and one predictive) for OPLS-DA. The score and loading plots for PLS-DA and OPLS-DA are shown in Fig. 7a and c, respectively. The R2Y and Q2Y values of the PLS-DA model, which are 0.908 and 0.854, respectively, indicate that the model has good goodness of fit and predictive ability. The R2Y and Q2Y values of the OPLS-DA model, which are 0.905 and 0.847, respectively, indicate that the model also has good goodness of fit and predictive ability. Overall, the two multivariate data analysis methods, PLS-DA and OPLS-DA, give similar results. To test the validity of the models of PLS-DA and OPLS-DA, a permutation test (n = 200) is performed. As shown in Fig. 7b and d, the test indicated that the two models are valid, and the good predictive ability of the model is not because of over-fitting with a p-value less than 0.05. Taken together, the results of PCA and PLS-DA (or OPLS-DA) show a distinct separation between the disease and health groups.
Fig. 6.
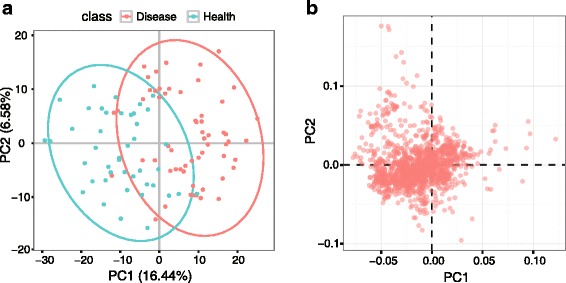
The score and loading plots of PCA. a Score plot of PCA and (b) Loading plot of PCA. The different points in the figures refer to different samples, and the samples are color-coded according to their group information. The QC samples were removed before performing the PCA analysis
Fig. 7.
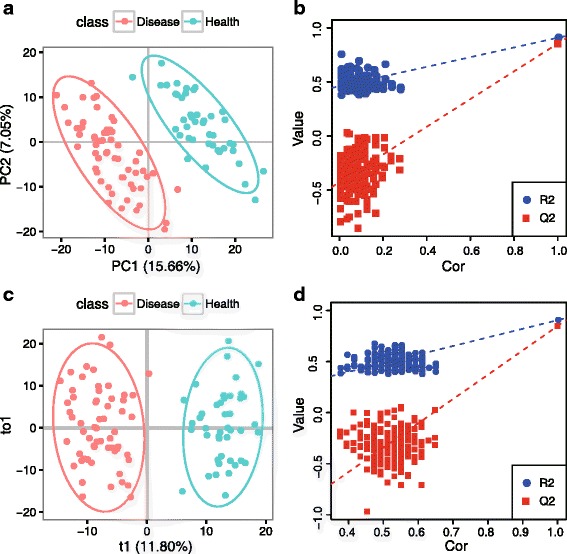
The score and permutation test plots of PLS-DA and OPLS-DA. a Score plot of PLS-DA. R2Y: 0.908, Q2Y: 0.854. b Permutation test plot of PLS-DA, p-value < = 0.05. c Score plot of OPLS-DA. R2Y: 0.905, Q2Y: 0.847. d Permutation test plot of OPLS-DA, p-value < = 0.05. The different points in the score plots (A and C) refer to different samples, and the samples are color-coded according to their group information. The number of permutations for the permutation test is 200
Biomarker analysis, metabolite identification and pathway analysis
To create the classification model between the disease and health groups, the functions implemented in metaX are used to conduct the biomarker selection, model creation and performance evaluation. A recursive feature elimination algorithm with the random forest model is used to select the best feature set. During the treatment, 5-fold cross-validation is used to optimize the model and reduce over-fitting. As shown in Table 3, 8 features were selected. To further evaluate the performance of the 8 selected features, the 102 samples were randomly split into two sample sets. One sample set (Disease: 29, Health 29) was for model building and the other (Disease: 14, Health 30) was for testing. Based on the two data sets, the 8 features were used to build a random forest model, and a receiver operating characteristic (ROC) curve of this model was plotted and is shown in Fig. 8. The result indicated that the model based on the 8 features had a good result with an area under the ROC (AUROC) curve of 0.999. The 8 features were then identified based on the HMDB (version 3.6) database through metaX. Seven out of the 8 features were identified with a mass accuracy of < 10 ppm (parts per million). The putative identified metabolites were then submitted to the IMPaLA website (version 9) through metaX to perform the pathway analysis, and the results are presented in Additional file 2: Table S2.
Table 3.
The biomarkers selected by metaX
| MZ | RT (min) | Mass | HMDB | Name | Delta (ppm) | Chemical formula |
|---|---|---|---|---|---|---|
| 308.0498 | 10.46 | 285.0629 | HMDB14387 | Cladribine | −8.18 | C10H12ClN5O3 |
| 424.3412 | 11.94 | 423.3349 | HMDB06469 | Linoleyl carnitine | −2.31 | C25H45NO4 |
| 155.0281 | 2.81 | 116.066 | HMDB32411 | 2-Methyl-1-methylthio-2-butene | −8.77 | C6H12S |
| 130.0499 | 3.43 | 129.0426 | HMDB00267 | Pyroglutamic acid | 0.15 | C5H7NO3 |
| 174.9913 | 2.30 | NULL | NULL | NULL | NULL | NULL |
| 309.0533 | 10.47 | 270.0892 | HMDB33940 | Vignafuran | 3.44 | C16H14O4 |
| 425.3446 | 11.94 | 424.3341 | HMDB06327 | Alpha-Tocotrienol | 7.62 | C29H44O2 |
| 324.0443 | 9.33 | 301.0563 | HMDB01062 | N-Acetyl-D-Glucosamine 6-Phosphate | −3.86 | C8H16NO9P |
Fig. 8.
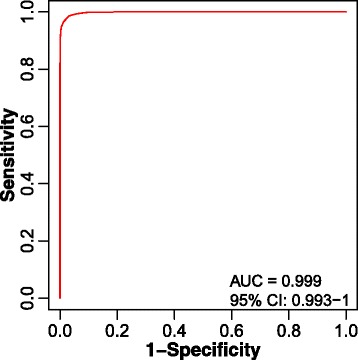
The ROC curve result of the six selected metabolites
Correlation network analysis
Network-based correlation analysis is a complementary method to the traditional univariate and multivariate statistics that is taken in metabolomics analysis to identify metabolite changes in response to variable status of physiology. All of the features with the normalized intensity described above were used to perform the differential correction network analysis. This analysis can be used to detect the interconnection of metabolite pairs whose relationships are significantly altered due to the disease process. In this study, only the metabolite pairs that had significant differential correlations (q-value < = 0.01) between the disease and health populations were used to build the network. As shown in Fig. 9, of the network with 266 nodes and 444 edges, a giant component (198/266, 74.44%) was found and the community detection analysis using the fast greedy modularity optimization algorithm against this component resulted in seven communities, in which each one has equal to or greater than 10 nodes detected. In addition, metaX can estimate three centrality metrics (degree, closeness and betweenness) for each node, and they reflect the importance of the node in the entire network (Additional file 3: Table S3). Differentially correlation network analysis is expected to provide useful insights into the underlying biological processes of the clinical development of CHD.
Fig. 9.
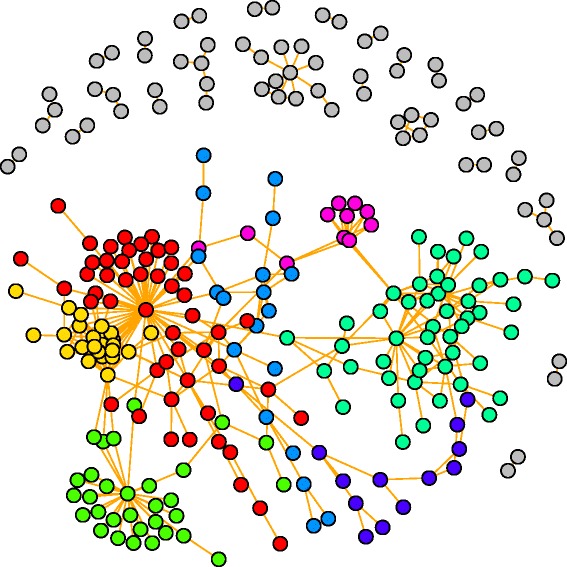
The differential correction network. The top six largest numbers of nodes communities were color-coded. Detailed information about the samples and their communities are presented in Table S3
Conclusions
metaX presents a complete data processing software that is easy to operate and capable of dealing with large-scale metabolomics datasets. A metaX user can customize the pipeline according to the research requirements. Compared to software for metabolomics datasets that requires high-manual interaction, metaX requires much less manual interaction and can be used in a command line or web-based user-friendly interface. Based upon the fast process and the optimized workflow, therefore, metaX would greatly improve the interpretation of metabolomics data.
Additional files
The fold change and p-value for all of the features. (XLSX 146 kb)
The pathway analysis results for the 8 selected biomarkers. (XLSX 14 kb)
The centrality metrics for each node in the network. (XLSX 22 kb)
Acknowledgements
We thank Dr. David Broadhurst for the implementation of QC-RSC method.
Funding
This study was supported in part by the International Science & Technology Cooperation Program of China (2014DFB30020), Chinese National Basic Research Programs (2014CBA02002-A, 2014CBA02005) and the National High-Tech Research and Development Program of China (2012AA020202). The funding body was not involved in the design of the study and collection, analysis, and interpretation of data or in writing the manuscript.
Availability of data and materials
GPL-2 licensed and available in the Bioconductor framework.
• Project name: metaX software
• Project home page: http://metax.genomics.cn/
• Operating system(s): Linux, Mac OSX, Windows
• Programming language: R, JAVA
• Other requirements: None
• License: GPL-2
• Any restrictions to use by non-academics: GPL-2
Authors’ contributions
BW conceived of and designed the project. BW and CWZ wrote the R package. BW, MZL and CWZ developed the website of metaX. BW, MZL and CWZ performed the data analysis and tested the software. BW and SQL wrote the paper and all authors revised and approved.
Competing interests
The authors declare that they have no competing interests.
Consent for publication
Not applicable.
Ethics approval and consent to participate
Not applicable.
Publisher’s Note
Springer Nature remains neutral with regard to jurisdictional claims in published maps and institutional affiliations.
Abbreviations
- FDR
False discovery rate
- GUI
Graphical user interface
- HMDB
Human metabolome database
- MS/MS
Tandem mass spectrometry
- OPLS-DA
Orthogonal partial least squares discriminant analysis
- PCA
Principal component analysis
- PLS-DA
Partial least square discriminant analysis
- QC
Quality control
- ROC
Receiver operating characteristic
Contributor Information
Bo Wen, Email: wenbo@genomics.cn.
Zhanlong Mei, Email: meizhanlong@genomics.cn.
Chunwei Zeng, Email: zengchunwei@genomics.cn.
Siqi Liu, Phone: 86-755-36307403, Email: siqiliu@genomics.cn.
References
- 1.Rochfort S. Metabolomics Reviewed: A New “Omics” Platform Technology for Systems Biology and Implications for Natural Products Research. J Nat Prod. 2005;68(12):1813–20. doi: 10.1021/np050255w. [DOI] [PubMed] [Google Scholar]
- 2.Gowda GAN, Djukovic D. Overview of Mass Spectrometry-Based Metabolomics. Oppor Challenges. 2014;1198:3–12. doi: 10.1007/978-1-4939-1258-2_1. [DOI] [PMC free article] [PubMed] [Google Scholar]
- 3.Frédérich M, Pirotte B, Fillet M, de Tullio P. Metabolomics as a Challenging Approach for Medicinal Chemistry and Personalized Medicine. J Med Chem. 2016;59(19):8649–66. doi: 10.1021/acs.jmedchem.5b01335. [DOI] [PubMed] [Google Scholar]
- 4.Smith CA, Want EJ, O’Maille G, Abagyan R, Siuzdak G. XCMS: processing mass spectrometry data for metabolite profiling using nonlinear peak alignment, matching, and identification. Anal Chem. 2006;78(3):779–87. doi: 10.1021/ac051437y. [DOI] [PubMed] [Google Scholar]
- 5.Kuhl C, Tautenhahn R, Bottcher C, Larson TR, Neumann S. CAMERA: an integrated strategy for compound spectra extraction and annotation of liquid chromatography/mass spectrometry data sets. Anal Chem. 2012;84(1):283–9. doi: 10.1021/ac202450g. [DOI] [PMC free article] [PubMed] [Google Scholar]
- 6.Fernandez-Albert F, Llorach R, Andres-Lacueva C, Perera A. An R package to analyse LC/MS metabolomic data: MAIT (Metabolite Automatic Identification Toolkit) Bioinformatics. 2014;30(13):1937–9. doi: 10.1093/bioinformatics/btu136. [DOI] [PMC free article] [PubMed] [Google Scholar]
- 7.Xia J, Psychogios N, Young N, Wishart DS. MetaboAnalyst: a web server for metabolomic data analysis and interpretation. Nucleic Acids Res. 2009;37(Web Server issue):W652–60. doi: 10.1093/nar/gkp356. [DOI] [PMC free article] [PubMed] [Google Scholar]
- 8.Giacomoni F, Le Corguille G, Monsoor M, Landi M, Pericard P, Petera M, Duperier C, Tremblay-Franco M, Martin JF, Jacob D, et al. Workflow4Metabolomics: a collaborative research infrastructure for computational metabolomics. Bioinformatics. 2015;31(9):1493–5. doi: 10.1093/bioinformatics/btu813. [DOI] [PMC free article] [PubMed] [Google Scholar]
- 9.Di Guida R, Engel J, Allwood JW, Weber RJ, Jones MR, Sommer U, Viant MR, Dunn WB. Non-targeted UHPLC-MS metabolomic data processing methods: a comparative investigation of normalisation, missing value imputation, transformation and scaling. Metabolomics. 2016;12:93. doi: 10.1007/s11306-016-1030-9. [DOI] [PMC free article] [PubMed] [Google Scholar]
- 10.Engskog MKR, Haglöf J, Arvidsson T, Pettersson C. LC–MS based global metabolite profiling: the necessity of high data quality. Metabolomics. 2016;12(7):1–9. doi: 10.1007/s11306-016-1058-x. [DOI] [Google Scholar]
- 11.Team RC . R: A Language and Environment for Statistical Computing. Vienna: R Foundation for Statistical Computing; 2016. [Google Scholar]
- 12.Ernest B, Gooding JR, Campagna SR, Saxton AM, Voy BH. MetabR: an R script for linear model analysis of quantitative metabolomic data. BMC Res Notes. 2012;5:596. doi: 10.1186/1756-0500-5-596. [DOI] [PMC free article] [PubMed] [Google Scholar]
- 13.Huber W, Carey VJ, Gentleman R, Anders S, Carlson M, Carvalho BS, Bravo HC, Davis S, Gatto L, Girke T, et al. Orchestrating high-throughput genomic analysis with Bioconductor. Nat Methods. 2015;12(2):115–21. doi: 10.1038/nmeth.3252. [DOI] [PMC free article] [PubMed] [Google Scholar]
- 14.Dunn WB, Broadhurst D, Begley P, Zelena E, Francis-McIntyre S, Anderson N, Brown M, Knowles JD, Halsall A, Haselden JN, et al. Procedures for large-scale metabolic profiling of serum and plasma using gas chromatography and liquid chromatography coupled to mass spectrometry. Nat Protoc. 2011;6(7):1060–83. doi: 10.1038/nprot.2011.335. [DOI] [PubMed] [Google Scholar]
- 15.Gromski PS, Xu Y, Kotze HL, Correa E, Ellis DI, Armitage EG, Turner ML, Goodacre R. Influence of missing values substitutes on multivariate analysis of metabolomics data. Metabolites. 2014;4(2):433–52. doi: 10.3390/metabo4020433. [DOI] [PMC free article] [PubMed] [Google Scholar]
- 16.van den Berg RA, Hoefsloot HC, Westerhuis JA, Smilde AK, van der Werf MJ. Centering, scaling, and transformations: improving the biological information content of metabolomics data. BMC Genomics. 2006;7:142. doi: 10.1186/1471-2164-7-142. [DOI] [PMC free article] [PubMed] [Google Scholar]
- 17.Edmands WM, Barupal DK, Scalbert A. MetMSLine: an automated and fully integrated pipeline for rapid processing of high-resolution LC-MS metabolomic datasets. Bioinformatics. 2015;31(5):788–90. doi: 10.1093/bioinformatics/btu705. [DOI] [PMC free article] [PubMed] [Google Scholar]
- 18.Dunn WB, Wilson ID, Nicholls AW, Broadhurst D. The importance of experimental design and QC samples in large-scale and MS-driven untargeted metabolomic studies of humans. Bioanalysis. 2012;4(18):2249–64. doi: 10.4155/bio.12.204. [DOI] [PubMed] [Google Scholar]
- 19.Kirwan JA, Broadhurst DI, Davidson RL, Viant MR. Characterising and correcting batch variation in an automated direct infusion mass spectrometry (DIMS) metabolomics workflow. Anal Bioanal Chem. 2013;405(15):5147–57. doi: 10.1007/s00216-013-6856-7. [DOI] [PubMed] [Google Scholar]
- 20.Shen X, Gong X, Cai Y, Guo Y, Tu J, Li H, Zhang T, Wang J, Xue F, Zhu Z-J. Normalization and integration of large-scale metabolomics data using support vector regression. Metabolomics. 2016;12(5):1–12. doi: 10.1007/s11306-016-1026-5. [DOI] [Google Scholar]
- 21.Johnson WE, Li C, Rabinovic A. Adjusting batch effects in microarray expression data using empirical Bayes methods. Biostatistics. 2006;8(1):118–27. doi: 10.1093/biostatistics/kxj037. [DOI] [PubMed] [Google Scholar]
- 22.Szymanska E, Saccenti E, Smilde AK, Westerhuis JA. Double-check: validation of diagnostic statistics for PLS-DA models in metabolomics studies. Metabolomics. 2012;8(Suppl 1):3–16. doi: 10.1007/s11306-011-0330-3. [DOI] [PMC free article] [PubMed] [Google Scholar]
- 23.Benjamini Y, Hochberg Y. Controlling the false discovery rate: a practical and powerful approach to multiple testing. J R Stat Soc Ser B Methodol. 1995;1:289–300. [Google Scholar]
- 24.Mevik B-H, Wehrens R, Liland KH: pls: Partial least squares and principal component regression. R package version 2015;2(5). https://cran.r-project.org/web/packages/pls/index.html
- 25.Thévenot EA, Roux A, Xu Y, Ezan E, Junot C. Analysis of the Human Adult Urinary Metabolome Variations with Age, Body Mass Index, and Gender by Implementing a Comprehensive Workflow for Univariate and OPLS Statistical Analyses. J Proteome Res. 2015;14(8):3322–35. doi: 10.1021/acs.jproteome.5b00354. [DOI] [PubMed] [Google Scholar]
- 26.van Iterson M, t Hoen PA, Pedotti P, Hooiveld GJ, den Dunnen JT, van Ommen GJ, Boer JM, Menezes RX. Relative power and sample size analysis on gene expression profiling data. BMC Genomics. 2009;10:439. doi: 10.1186/1471-2164-10-439. [DOI] [PMC free article] [PubMed] [Google Scholar]
- 27.Fukushima A. DiffCorr: An R package to analyze and visualize differential correlations in biological networks. Gene. 2013;518(1):209–14. doi: 10.1016/j.gene.2012.11.028. [DOI] [PubMed] [Google Scholar]
- 28.Csardi G, Nepusz T. The igraph software package for complex network research. Inter J Complex Syst. 2006;1695(5):1–9. [Google Scholar]
- 29.Shannon P, Markiel A, Ozier O, Baliga NS, Wang JT, Ramage D, Amin N, Schwikowski B, Ideker T. Cytoscape: a software environment for integrated models of biomolecular interaction networks. Genome Res. 2003;13(11):2498–504. doi: 10.1101/gr.1239303. [DOI] [PMC free article] [PubMed] [Google Scholar]
- 30.Bastian M, Heymann S, Jacomy M. Gephi: an open source software for exploring and manipulating networks. ICWSM. 2009;8:361–2. [Google Scholar]
- 31.Wishart DS, Jewison T, Guo AC, Wilson M, Knox C, Liu Y, Djoumbou Y, Mandal R, Aziat F, Dong E, et al. HMDB 3.0-The Human Metabolome Database in 2013. Nucleic Acids Res. 2013;41(Database issue):D801–7. doi: 10.1093/nar/gks1065. [DOI] [PMC free article] [PubMed] [Google Scholar]
- 32.Kanehisa M, Goto S. KEGG: kyoto encyclopedia of genes and genomes. Nucleic Acids Res. 2000;28(1):27–30. doi: 10.1093/nar/28.1.27. [DOI] [PMC free article] [PubMed] [Google Scholar]
- 33.Kanehisa M, Goto S, Sato Y, Furumichi M, Tanabe M. KEGG for integration and interpretation of large-scale molecular data sets. Nucleic Acids Res. 2011;40(D1):D109–14. doi: 10.1093/nar/gkr988. [DOI] [PMC free article] [PubMed] [Google Scholar]
- 34.Horai H, Arita M, Kanaya S, Nihei Y, Ikeda T, Suwa K, Ojima Y, Tanaka K, Tanaka S, Aoshima K, et al. MassBank: a public repository for sharing mass spectral data for life sciences. J Mass Spectrom. 2010;45(7):703–14. doi: 10.1002/jms.1777. [DOI] [PubMed] [Google Scholar]
- 35.Wang Y, Xiao J, Suzek TO, Zhang J, Wang J, Bryant SH, Web S. PubChem: a public information system for analyzing bioactivities of small molecules. Nucleic Acids Res. 2009;37(Web Server):W623–33. doi: 10.1093/nar/gkp456. [DOI] [PMC free article] [PubMed] [Google Scholar]
- 36.Sud M, Fahy E, Cotter D, Brown A, Dennis EA, Glass CK, Merrill AH, Jr, Murphy RC, Raetz CR, Russell DW, et al. LMSD: LIPID MAPS structure database. Nucleic Acids Res. 2007;35(Database issue):D527–32. doi: 10.1093/nar/gkl838. [DOI] [PMC free article] [PubMed] [Google Scholar]
- 37.Caspi R, Altman T, Billington R, Dreher K, Foerster H, Fulcher CA, Holland TA, Keseler IM, Kothari A, Kubo A, et al. The MetaCyc database of metabolic pathways and enzymes and the BioCyc collection of Pathway/Genome Databases. Nucleic Acids Res. 2014;42(D1):D459–71. doi: 10.1093/nar/gkt1103. [DOI] [PMC free article] [PubMed] [Google Scholar]
- 38.Kamburov A, Cavill R, Ebbels TM, Herwig R, Keun HC. Integrated pathway-level analysis of transcriptomics and metabolomics data with IMPaLA. Bioinformatics. 2011;27(20):2917–8. doi: 10.1093/bioinformatics/btr499. [DOI] [PubMed] [Google Scholar]
- 39.Kuhn M. Building predictive models in R using the caret package. J Stat Softw. 2008;28(5):1–26. doi: 10.18637/jss.v028.i05. [DOI] [Google Scholar]
- 40.Breiman L. Random forests. Mach Learn. 2001;45(1):5–32. doi: 10.1023/A:1010933404324. [DOI] [Google Scholar]
- 41.Gehlenborg N, Noble MS, Getz G, Chin L, Park PJ. Nozzle: a report generation toolkit for data analysis pipelines. Bioinformatics. 2013;29(8):1089–91. doi: 10.1093/bioinformatics/btt085. [DOI] [PMC free article] [PubMed] [Google Scholar]
- 42.Feng Q, Liu Z, Zhong S, Li R, Xia H, Jie Z, Wen B, Chen X, Yan W, Fan Y, et al. Integrated metabolomics and metagenomics analysis of plasma and urine identified microbial metabolites associated with coronary heart disease. Sci Rep. 2016;6:22525. doi: 10.1038/srep22525. [DOI] [PMC free article] [PubMed] [Google Scholar]
- 43.Feng Q, Liu Z, Zhong S, Li R, Xia H, Jie Z, Wen B, Chen X, Yan W, Fan Y, Dryad Data R, et al. Data from: Integrated metabolomics and metagenomics analysis of plasma and urine identified microbial metabolites associated with coronary heart disease. 2016. [DOI] [PMC free article] [PubMed] [Google Scholar]
- 44.Kessner D, Chambers M, Burke R, Agus D, Mallick P. ProteoWizard: open source software for rapid proteomics tools development. Bioinformatics. 2008;24(21):2534–6. doi: 10.1093/bioinformatics/btn323. [DOI] [PMC free article] [PubMed] [Google Scholar]
- 45.Chawade A, Alexandersson E, Levander F. Normalyzer: a tool for rapid evaluation of normalization methods for omics data sets. J Proteome Res. 2014;13(6):3114–20. doi: 10.1021/pr401264n. [DOI] [PMC free article] [PubMed] [Google Scholar]
Associated Data
This section collects any data citations, data availability statements, or supplementary materials included in this article.
Supplementary Materials
The fold change and p-value for all of the features. (XLSX 146 kb)
The pathway analysis results for the 8 selected biomarkers. (XLSX 14 kb)
The centrality metrics for each node in the network. (XLSX 22 kb)
Data Availability Statement
GPL-2 licensed and available in the Bioconductor framework.
• Project name: metaX software
• Project home page: http://metax.genomics.cn/
• Operating system(s): Linux, Mac OSX, Windows
• Programming language: R, JAVA
• Other requirements: None
• License: GPL-2
• Any restrictions to use by non-academics: GPL-2