eLife logoLink to eLife
. 2017 Mar 6;6:e20832. doi: 10.7554/eLife.20832

The dynamic assembly of distinct RNA polymerase I complexes modulates rDNA transcription

Eva Torreira 1,, Jaime Alegrio Louro 1,, Irene Pazos 2,3, Noelia González-Polo 4, David Gil-Carton 5, Ana Garcia Duran 2,3, Sébastien Tosi 2,3, Oriol Gallego 2,3,*, Olga Calvo 4,*, Carlos Fernández-Tornero 1,*
Editor: Alan G Hinnebusch6
PMCID: PMC5362265  PMID: 28262097

Abstract

Cell growth requires synthesis of ribosomal RNA by RNA polymerase I (Pol I). Binding of initiation factor Rrn3 activates Pol I, fostering recruitment to ribosomal DNA promoters. This fundamental process must be precisely regulated to satisfy cell needs at any time. We present in vivo evidence that, when growth is arrested by nutrient deprivation, cells induce rapid clearance of Pol I–Rrn3 complexes, followed by the assembly of inactive Pol I homodimers. This dual repressive mechanism reverts upon nutrient addition, thus restoring cell growth. Moreover, Pol I dimers also form after inhibition of either ribosome biogenesis or protein synthesis. Our mutational analysis, based on the electron cryomicroscopy structures of monomeric Pol I alone and in complex with Rrn3, underscores the central role of subunits A43 and A14 in the regulation of differential Pol I complexes assembly and subsequent promoter association.

DOI: http://dx.doi.org/10.7554/eLife.20832.001

Research Organism: S. cerevisiae

Introduction

The nucleolus constitutes a cellular hub dedicated to ribosome biogenesis, which starts with the transcription of ribosomal RNA (rRNA) precursor genes by RNA polymerase I (Pol I). Ribosomes are completed by the action of Pol II, synthesizing messenger RNA, and Pol III, involved in 5S rRNA and transfer RNA production. The critical requirement for ribosomes in actively growing cells causes that Pol I retains up to 60% of the total transcriptional activity within the eukaryotic nucleus (Warner, 1999). However, under stress conditions, cells tune down ribosome biosynthesis by repressing Pol I transcription (Mayer et al., 2004). Accordingly, defects in the regulation of this process can lead to uncontrolled cell proliferation and have been associated with different types of cancer (Bywater et al., 2012).

Initiation of rRNA synthesis in yeast is a sequential process that involves four components: the upstream activating factor (UAF) complex, the TATA box-binding protein (TBP), the core factor (CF) heterotrimer and the Rrn3 protein (Moss et al., 2007). While the first three components recognize different regions in promoter DNA, Rrn3 binding to Pol I is a prerequisite for enzyme recruitment to promoter-bound initiation factors (Keener et al., 1998; Yamamoto et al., 1996). Except for UAF, an equivalent set of proteins plays similar roles in mammals (Hannan et al., 1999), where Rrn3 is also termed TIF-IA (Bodem et al., 2000; Moorefield et al., 2000). The recent electron cryomicroscopy (cryo-EM) structures of the Pol I–Rrn3 complex show how these two components interact (Engel et al., 2016; Pilsl et al., 2016), confirming previous biochemical studies (Blattner et al., 2011; Peyroche et al., 2000).

Yeast Pol I is a 590 kDa enzyme composed of 14 subunits, whose atomic architecture was recently revealed (Engel et al., 2013; Fernández-Tornero et al., 2013). The two largest subunits, A190 and A135, forming the DNA-binding cleft and harbouring the active centre, are held together by the AC40/AC19 assembly heterodimer. Five rather globular subunits present in all nuclear RNA polymerases (Rpb5, Rpb6, Rpb8, Rpb10 and Rpb12) attach on the periphery of the complex. Subunit A12.2 contains a TFIIS-like C-terminal zinc ribbon located next to the active site, while the A49/A34.5 heterodimer attaches on the Pol I lobe through a TFIIF-like dimerization module. Finally, the A43/A14 heterodimer forms a stalk that emerges from the enzyme core.

In the Pol I crystal structure, the enzyme forms homodimers that exhibit an unexpectedly open cleft occupied by a DNA-mimicking loop, which is incompatible with transcription. The structure suggests that the interaction between the A43 C-terminal tail and the opposite monomer’s clamp is important to maintain Pol I dimers. Interestingly, Pol I dimers in solution present the same structural arrangement, as shown by cryo-EM (Pilsl et al., 2016). While homodimerization has been proposed as a potential regulatory mechanism of Pol I activity, no evidence is available to date showing Pol I dimers to exist within the cell.

Here, we have investigated the molecular mechanisms underlying Pol I activation using a holistic approach. Live-cell imaging shows that nutrient depletion causes rapid clearance of Pol I–Rrn3 complexes, followed by the formation of Pol I homodimers, while nutrient addition reverts both repressive conditions following a quasi-symmetric pattern. Additionally, we report the cryo-EM structures of monomeric Pol I alone and in complex with Rrn3 at 4.9 and 7.7 Å resolution, respectively, representing the two steps in Pol I activation. Finally, we designed stalk mutants affecting Pol I dimerization and/or Rrn3 binding, and used them to explore the influence of these complexes on rDNA association.

Results

Live-cell imaging of Pol I complexes

To investigate the formation and disruption of Pol I transcription complexes in vivo, we used PICT (Protein interactions from Imaging Complexes after Translocation), a fluorescence microscopy technique to analyse protein interactions in living cells (Gallego et al., 2013; Picco et al., 2017). This technique uses cellular anchoring platforms tagged with both RFP and FK506-binding protein (anchor-RFP-FKBP) to recruit proteins tagged with FKBP-binding domain (bait-FRB). FKBP and FRB strongly interact in the presence of rapamycin, which induces translocation of the bait-FRB to the anchor. If a GFP-tagged protein (prey-GFP) interacts with the bait, it will co-translocate to the anchor upon rapamycin addition, leading to increased co-localization of RFP and GFP signals. Previously-engineered anchors generate a large number of anchors at the plasma membrane, which only allows the detection of abundant cytosolic complexes. We designed a new anchor by tagging Tub4, a component of the spindle pole body, with RFP and FKBP (Tub4-RFP-FKBP). The resulting cells harbour only one or two anchors, thus increasing the PICT sensitivity by up to 200-fold (Figure 1—figure supplement 1A; Video 1). In addition, Tub4 is exposed to both the cytosol and the nucleus, which allows detection of complexes on both sides of the nuclear envelope (Figure 1—figure supplement 1B). The levels of recruitment can be quantified as the co-localization between prey-GFP and anchor-RFP-FKBP (see ‘Materials and methods’; Figure 1—figure supplement 2).

Video 1. Engineered anchoring platform associated with the spindle pole body.

Download video file (6.4MB, mp4)
DOI: 10.7554/eLife.20832.002

Yeast cell expressing GFP and Tub4-RFP-FKBP imaged in z-stacks of 250 nm incremental steps. Imaris software was used to obtain the 3D reconstruction. A maximum of two anchoring platforms could be observed in each cell.

DOI: http://dx.doi.org/10.7554/eLife.20832.002

Since Pol I transcription is down-regulated by rapamycin, all subsequent experiments were performed in rapamycin-insensitive strains carrying the tor1-1 mutation (Helliwell et al., 1994), so that the addition of this compound has no effect on Pol I association to rDNA promoters (Figure 1—figure supplement 3A).

Pol I dimerization is induced by nutrient deprivation and depends on A43 C-terminus

To investigate whether Pol I is able to form homodimers in vivo, we constructed a diploid strain where the Pol I subunit A190 was labelled in an allele-specific manner, with one allele tagged to GFP (A190-GFP) and the second to FRB (A190-FRB). The presence of these tags did not alter the doubling times of the cells (101.6 ± 11.6, 103.0 ± 6.2 and 101.2 ± 12.3 min for the parental, A190-GFP and A190-FRB strains, respectively). When rapamycin is added, GFP-labelled Pol I will only co-translocate to the anchor-RFP-FKBP if it interacts with FRB-tagged Pol I (Figure 1A). Cells incubated in rich medium present normal growth rate and the vast majority of Pol I accumulates in a sub-nuclear structure likely corresponding to the nucleolus (Figure 1—figure supplement 3B). Upon rapamycin addition, no recruitment of A190-GFP could be detected at the anchors (Figure 1B; Figure 1—figure supplement 3C). In contrast, when cells were incubated in a medium lacking carbon and nitrogen, hereafter starving medium, their growth was arrested and A190-GFP translocated to the nuclear side of the anchors (Figure 1B; Figure 1—figure supplement 1B). Interestingly, the total levels of A190 as well as the distribution of A190-GFP in the anchor vicinity prior to rapamycin addition are equivalent in both media (Figure 1—figure supplement 3D–E). In accordance, the levels of bait recruitment are equivalent in growing and starved cells (Figure 1—figure supplement 3F). In addition, we performed co-immunoprecipitation experiments after crosslinking, using a diploid strain where one A190 allele was tagged with TAP (A190-TAP) and the second with MYC (A190-MYC). The former was used for pull-down with IgG resin while the latter was employed for western-blot analysis with anti-MYC antibody. Whole cell extracts (WCE) showed that A190-MYC immunoprecipitation is similar for cells incubated in rich (R) or starving (ST) medium (Figure 1—figure supplement 4A, lanes 1–4). Centrifugation of whole cell extracts allowed separation of a soluble fraction (SF) from a chromatin-associated insoluble fraction (Chr F), which were examined independently. Analysis of the soluble fraction showed that Pol I homodimers are only detected in starved cells (lanes 5 and 6). As expected, the chromatin insoluble fraction of growing cells presented high levels of A190-MYC (lane 7), likely corresponding to rDNA-associated Pol I molecules, while tiny amounts of A190-MYC were detected for starved cells (lane 8). DNase I treatment of the latter indicates that this is due to minor levels of Pol I that remains associated with DNA after two hours of starvation (lane 9). The absence of histone H3 in the soluble fraction indicates that there is no contamination from the chromatin insoluble fraction (Figure 1—figure supplement 4B).

Figure 1. Live-cell imaging of Pol I homodimerization.

(A) Scheme of the diploid strains designed to study Pol I homodimers in vivo. The crystal structure of inactive Pol I homodimers, critically maintained by the A43 C-terminal tail, is shown on the right with monomers in yellow and pink. (B) Representative PICT images of the RFP-tagged anchor (upper row), GFP-tagged A190 (middle row) and a zoom of a 2.6 × 2.6 µm square around the anchoring platforms (bottom row). Below, quantification of the A190-GFP recruitment score, normalized to the measurement of the wild-type strain in starving medium (Mean ± SD, p-value * < 0.01 t-test).

DOI: http://dx.doi.org/10.7554/eLife.20832.003

Figure 1.

Figure 1—figure supplement 1. A more sensitive PICT assay to detect cytosolic and nuclear complexes.

Figure 1—figure supplement 1.

(A) Comparison of Pil1-RFP-FKBP (left) and Tub4-RFP-FKBP (right) anchoring platforms to detect the Ste5-Ste11 complex. Ste11-FRB was used as bait. Representative images of the anchor-RFP-FKBP (upper row) and Ste5-GFP (bottom row). Below, quantification of Ste5-GFP recruitment to the corresponding anchoring platform in rapamycin-treated cells (Mean ± SD). (B) PICT assay to detect nuclear and cytosolic complexes. Above, close-up view around two anchoring platforms in a representative cell. Below, intensity profile through the white dashed line for the prey-GFP (green) and Tub4-RFP-FKBP (red) channels, with arrows indicating the brightest pixel for each peak of intensity.
Figure 1—figure supplement 2. Methodology for PICT quantification.

Figure 1—figure supplement 2.

Segmentation workflow for RFP-anchors (red channel, left column) and prey-GFP spots (green channel, right column). For both channels the same operations are performed: (1) raw images, (2) noise and background attenuation by Gaussian blurring followed by top hat opening (ImageJ ‘subtract background’), (3) local mean threshold with radius adjusted to expected spot size, and (4) small and large particle removal by median filtering and area opening (area adjusted to expected spot size). The bottom row image shows an overlay of the raw GFP image, segmented RFP-anchors (red) and segmented prey-GFP spots (green), yellow pixels correspond to overlap between prey-GFP spots and RFP-anchors. The recruitment score is computed as the ratio between GFP mean intensity measured inside yellow pixel regions multiplied by the summed yellow area divided by the summed red area. In this image no false GFP positive spot counts toward the recruitment score since none overlaps with a segmented anchor. For both channels, RFP-anchors are indicated by red arrows.
Figure 1—figure supplement 3. Additional control experiments.

Figure 1—figure supplement 3.

(A) ChIP of A190-FRB + A190 GFP strain in the absence and presence of rapamycin (Mean ± SD). T-test shows that the difference is not statistically significant. (B) Visualization of the nuclear envelope by labelling of Nuc96. The A190-FRB-GFP signal is confined within the nuclear space. (C) Control experiments for live cell imaging of Pol I homodimerization using PICT. (D) Western-blot analysis of Pol I and Rrn3 levels in cells growing in rich and starving medium, using rabbit anti-A190 (gift of Michel Riva) and mouse anti-GFP (Takara, JL-8) antibodies, respectively. (E) Quantification of the A190-GFP background signal using PICT (Mean ± SD). (F) Quantification of A190-FRB-GFP recruitment to anchoring platforms in growing and starving cells (Mean ± SD).
Figure 1—figure supplement 4. Co-immunoprecipitation on Pol I dimerization.

Figure 1—figure supplement 4.

(A) Whole cell extracts (WCE) were obtained from crosslinked cells grown in rich (R) or starving media (ST). Centrifugation of the cell lysate allowed the separation of the protein soluble fraction (SF) and the pellet with the chromatin insoluble fraction and associated proteins, which was thereafter solubilized (Chr F). To analyze dimer formation, A190-TAP was precipitated from both fractions (SF and Chr F) and the amount of associated A190-MYC analyzed by western blot. The ST sample of Chr F was incubated in the presence and absence of DNase I (‘+’ and ‘−’) after immunoprecipitation. A control experiment with WCE was used to show that A190-TAP is efficiently immunoprecipitated in both conditions, R and ST, where IN is the input before immunoprecipitation and IgG the precipitated samples after being decrosslinked. (B) The quality of both fractions was verified by western blot of the chromatin associated protein histone H3, present in Chr F only, and the cytosolic protein Pgk1, present in SF mostly.
Figure 1—figure supplement 5. Analysis of Pol II and Pol III complexes.

Figure 1—figure supplement 5.

Quantification of detected Pol III and Pol II complexes in diploid yeast strains (Mean ± SD).

The crystal structure of inactive Pol I identified the A43 C-terminal tail, encompassing residues 260–326, as a key element to form Pol I homodimers (Figure 1A, inset). Therefore, we studied Pol I dimerization upon partial deletion of this structural element (A43ΔCt, Δ307–326). In this mutant, Pol I homodimerization is impaired (Figure 1B), confirming the observation derived from structural data.

To evaluate whether RNA polymerase dimerization is a more general regulatory mechanism, we applied PICT analysis to the other nuclear RNA polymerases. In the case of Pol III, no oligomerization was observed on the anchor in either growing or starving medium, indicating that Pol III does not dimerize in these conditions (Figure 1—figure supplement 5). Similarly, we were unable to detect Pol II oligomerization. However, accurate quantification was difficult in this case due to strong Pol II-GFP signal in the surroundings of the nuclear envelope where the anchor is located, which could mask recruitment of Pol II-GFP.

Defects downstream of rRNA synthesis trigger Pol I homodimerization

To rule out the possibility that Pol I homodimerization could involve the synthesis of new proteins, we followed the formation of Pol I dimers in the presence of cycloheximide, which targets ribosomes and inhibits protein synthesis. Starved cells exposed to this compound did not show any defect in Pol I homodimerization. Instead, we detect a 40% increase in the homodimers levels with respect to untreated cells. This indicates that no additional protein synthesis is required to induce this cellular event and that ribosome inhibition could reinforce Pol I dimerization (Figure 2A). Interestingly, inhibition of protein synthesis in cells grown in non-starving medium was sufficient to induce Pol I dimerization (Figure 2B). When cycloheximide was replaced by diazaborine, an inhibitor of rRNA maturation during 60S formation (Loibl et al., 2014), Pol I dimers were also assembled (Figure 2B). These results show that Pol I homodimerization is induced by inhibition of either protein synthesis or rRNA maturation, two processes that are downstream of rRNA synthesis.

Figure 2. Pol I homodimerization upon ribosome perturbation.

Figure 2.

Representative PICT images of the RFP-tagged anchor (upper row), GFP-tagged A190 (middle row) and a zoom of a 2.3 × 2.3 µm square around anchoring platforms (bottom row). Below, quantification of the A190-GFP recruitment score, normalized to the measurement of untreated cells (Mean ± SD, p-value * < 0.01 t-test). (A) Effect of cycloheximide (CHX; 0.2 µg/ml) in starved cells. (B) Effect of cycloheximide (0.2 µg/ml) and diazaborine (10 µg/ml) in growing cells.

DOI: http://dx.doi.org/10.7554/eLife.20832.009

Nutrient depletion induces Pol I–Rrn3 clearance

The Pol I–Rrn3 complex represents the activated form of the enzyme (Milkereit and Tschochner, 1998). We used PICT to evaluate whether cells also modulate the levels of this complex according to nutrient availability. We thus constructed a haploid strain expressing anchor-RFP-FKBP, Rrn3 labelled with GFP (Rrn3-GFP) and A190-FRB (Figure 3A; Figure 3—figure supplement 1A). Again, the presence of these tags did not alter the doubling time of the cells (101.6 ± 11.6 and 100.7 ± 15.03 min, for the parental and tagged strains). Despite Pol I–Rrn3 complexes were detected in cells incubated in both rich and starving media, their levels were reduced to about 40% upon nutrient deprivation (Figure 3B). Importantly, while starvation does not induce significant changes in the distribution of Rrn3-GFP in the vicinity of the anchor (Figure 3—figure supplement 1B), the cellular levels of Rrn3-GFP drop significantly in starved cells (Figure 1—figure supplement 3D). The reduction in Rrn3 and Pol I–Rrn3 correlates with an almost complete deprivation of both Pol I and Rrn3 from rDNA promoters, as observed by ChIP experiments (Figure 3C–D, wt-35S). In the case of Pol I, a similar drop in association is also observed inside the rDNA gene, where Rrn3 is absent even in wild-type cells (Figure 3D, wt-18S and wt-25S).

Figure 3. Live-cell imaging of Pol I–Rrn3 complexes.

(A) Scheme of the haploid strains designed to study Pol I–Rrn3 in vivo. (B) Representative PICT images of the RFP-tagged anchor (upper row), GFP-tagged Rrn3 (middle row) and a zoom of a 2.3 × 2.3 µm square around anchoring platforms (bottom row). Below, quantification of the Rrn3-GFP recruitment score, normalized to the measurement in rich medium (Mean ± SD, p-value * < 0.01 t-test). (C) Schematic representation of the 35S rDNA. Below, approximate location of the primer pairs used for ChIP experiments in the following panel. (D) ChIP experiments showing the relative occupancy of A190 and Rrn3 on the rDNA gene in different culture media (Mean ± SD).

DOI: http://dx.doi.org/10.7554/eLife.20832.010

Figure 3.

Figure 3—figure supplement 1. Additional control experiments.

Figure 3—figure supplement 1.

(A) Control experiments for live cell imaging of Pol I–Rrn3 complexes using PICT. (B) Quantification of the Rrn3-GFP background signal using PICT (Mean ± SD). (C) Western-blot analysis of A190 and Rrn3 in whole cell extracts, using rabbit anti-A190 and mouse anti-GFP, respectively (left panel). Comparative growth phenotype at 28°C and 37°C, obtained by serial dilutions (1:10) of wild-type and A43ΔCt mutant strains spotted on either YPD or selective SC medium, and grown for 2–3 days (right panel).
Figure 3—figure supplement 2. Analysis of the CARA strain.

Figure 3—figure supplement 2.

(A) ChIP experiments showing the relative association of A190 to the rDNA promoter in the CARA and wild-type strains, in different culture media (Mean ± SD). (B) Comparative growth phenotype at 28°C and 37°C for the CARA and wild-type strains in rich medium after growing the cells either in rich or starving conditions.

To further investigate the effect of starvation on Pol I transcription, we used our A43 C-terminal truncation abolishing Pol I dimerization. For that, we constructed A43ΔCt haploid cells that, while expressing similar levels of Rrn3 and A190 to wild-type cells, present reduced growth (Figure 3—figure supplement 1C). Structural data show that the A43 C-terminal tail is not involved in Rrn3 binding (see below; Engel et al., 2016; Pilsl et al., 2016). Growing A43ΔCt cells exhibit levels of Pol I–Rrn3 complexes equivalent to the wild-type (Figure 3B), whereas Pol I promoter association is slightly increased (Figure 3D). A greater increase in Pol I occupancy is observed inside the rDNA gene under growing conditions (Figure 3D). More interestingly, in starved A43ΔCt cells, the levels of Pol I–Rrn3 complexes are about 2-fold higher than those detected in wild-type cells (Figure 3B). Furthermore, in these conditions, association of Pol I along the rDNA gene and of Rrn3 at the promoter increase about 6-fold with respect to the wild-type (Figure 3D).

We also used a strain, termed CARA for Constitutive Association of Rrn3 and A43, expressing a Pol I–Rrn3 chimera that cannot form Pol I homodimers (Laferté et al., 2006). ChIP experiments show that the Pol I–Rrn3 chimera is normally associated to rDNA in growing cells (Figure 3—figure supplement 2A). However, under starving conditions, Pol I–Rrn3 association along rDNA is 6 to 7-fold higher than in wild-type cells, a similar behaviour to A43ΔCt cells. Moreover, recovery of CARA from nutrient-depleted medium is faster than for wild-type cells (Figure 3—figure supplement 2B). Overall, our results indicate that Pol I homodimerization is important for complete Pol I–Rrn3 clearance and transcription inactivation upon starvation.

Dynamics in the assembly of Pol I complexes in response to nutrient availability

We then quantified the temporal progression in the assembly and disassembly of Pol I inactive dimers and Pol I–Rrn3 active complexes in response to nutrient availability. When growing cells are transferred to starving medium, detected levels of Pol I–Rrn3 are rapidly depleted by about 30%, in a process that follows an exponential decay (Figure 4A, left). Accordingly, the rate of complex clearance is maximal within the first 15 min, while Pol I homodimers remain undetectable at this stage. In a second stage, disassembly of Pol I–Rrn3 complexes slows down, reaching an additional 10% decrease within the next 20 min (i.e. 40% total reduction when compared to growing cells). During this period, the observed homodimerization follows a sigmoid-like tendency, reaching its fastest assembly rate. After 35 min of starvation, cells enter a third stage where both Pol I–Rrn3 clearance and Pol I homodimerization rates remain slow but constant. Here, detected Pol I–Rrn3 complexes drop by an additional 20% (i.e. 60% total reduction) while the levels of Pol I homodimers double in amount. A symmetric pattern is observed when starved cells are transferred to nutrient rich medium (Figure 4A, right). Cells initially respond through rapid assembly of Pol I–Rrn3 during the first 15 min, where detected levels exponentially increase up to 50% of the maximum value in rich medium. Remarkably, changes in the levels of Pol I homodimers are fast as well, leading to 30% reduction in this initial stage. In a second stage, detected Pol I–Rrn3 complexes remain constant while the clearance rate of Pol I homodimers is maximal, resulting in undetectable levels of Pol I homodimers after 35 min from nutrient addition. From this point, the assembly of Pol I–Rrn3 complexes is slowly restored to the level observed in normal growing conditions.

Figure 4. Dynamics in the cellular levels of Pol I complexes in response to nutrient availability.

(A) Upper plots show the relative levels of Pol I–Rrn3 complexes and Pol I homodimers as detected by PICT. Measurements were done at the indicated time points after growing cells were switched to starving medium (left) or cells starved for 2 hr were switched to nutrient-rich medium (right). Values were normalized to the highest measurement of the corresponding complex. Bottom plots show the rate of assembly (positive values) and disassembly (negative values) of each complex between two consecutive measurements. Grey shadows indicate the different stages observed in response to nutrient availability: faster adjustment of Pol I–Rrn3 levels (lighter grey), faster adjustment of Pol I homodimer levels (middle grey) and slow consolidation of the levels of each Pol I complex (dark grey). (B) Upper plots show the relative A190 and Rrn3 occupancy at the rDNA promoter for the indicated conditions and time points, as measured by ChIP. Values were normalized to the value obtained for cells growing in rich medium (Mean ± SD). Bottom plots show the rate of assembly and disassembly, calculated as in panel A.

DOI: http://dx.doi.org/10.7554/eLife.20832.013

Figure 4.

Figure 4—figure supplement 1. A190 and Rrn3 levels in response to nutrient availability.

Figure 4—figure supplement 1.

Western-blot analysis of the A190 and Rrn3 levels in whole cell extract from wild-type cells grown in the indicated conditions and time points, using rabbit anti-A190 and mouse anti-GFP (Living colors, JL-8 Clontech) antibodies, respectively. Mouse anti-Pgk1 was used as a loading control.

ChIP experiments performed at an equivalent regime show that the promoter association of both A190 and Rrn3 drops by two thirds within the first 10 min from starvation but requires about 2 hr to reach completion (Figure 4B, left). Whereas this exponential tendency is comparable to that of Pol I–Rrn3 clearance, a significant amount of this complex can still be detected in spite of undetectable levels of A190 and Rrn3 on rDNA promoters, as mentioned above. In contrast, restoration of rDNA promoter association follows a linear pattern that is accomplished in about 2 hr (Figure 4B, right). Western-blot analysis at the same time-points shows that the overall levels of A190 remain constant while those of Rrn3 correlate with detected amounts of Pol I–Rrn3 (Figure 4—figure supplement 1), suggesting that Rrn3 levels influence the number of Pol I–Rrn3 complexes, as previously proposed (Philippi et al., 2010). Overall, these results indicate that cells respond to nutrient availability by differentially adjusting the levels of Pol I homodimers and Pol I–Rrn3.

Cryo-EM structures of monomeric Pol I alone and in complex with Rrn3

To unveil the molecular details of Pol I activation, we aimed to characterize this process structurally. Negatively-stained 2D averages of the Pol I–Rrn3 complex showed a portion of additional density next to the stalk (Figure 5—figure supplement 1A). Antibody labelling confirms that this density corresponds to Rrn3, which binds Pol I with its N-terminus facing the stalk (Figure 5—figure supplement 1B–C). We then studied the Pol I activation process using cryo-EM (Figure 5—figure supplement 2A–B). Unsupervised 3D classification into six classes identified two interesting groups with about 90,000 and 32,000 particles (Figure 5—figure supplement 2C). Refinement of the first subset, which corresponds to monomeric Pol I, yielded a 5.6 Å resolution map (Figure 5—figure supplement 2C, right). Refinement of the second group, containing an extra piece of density next to the Pol I stalk that corresponds to Rrn3, produced a 7.7 Å resolution map (Figure 5—figure supplement 2C, left). Finally, the addition of both particle sets followed by 3D refinement yielded a map that is virtually identical to that of monomeric Pol I but reaches a resolution of 4.9 Å (Figure 5—figure supplement 2C, central), thus allowing the building of a quasi-atomic model (Figure 5A; Figure 5—figure supplement 3).

Figure 5. Structure of monomeric Pol I in solution.

(A) Cryo-EM reconstruction of Pol I at 4.9 Å resolution superposed with the derived pseudo-atomic model. (B) Comparison between the structural models of the Pol I dimer (PDB-4C3H) and the Pol I monomer (this report) in yellow and cyan, respectively, with labelled structural domains. (C) Close-up views of regions becoming flexible in the transition from dimeric to monomeric Pol I, in the same colors and orientation as in panel B. Flexible regions are depicted with thicker ribbon trace and labelled in italics. (D) Representation of the conformational changes associated with the transition from dimeric to monomeric Pol I, in the same colors and orientation as in panel B.

DOI: http://dx.doi.org/10.7554/eLife.20832.015

Figure 5.

Figure 5—figure supplement 1. Negative-staining EM of the yeast Pol I–Rrn3 complex.

Figure 5—figure supplement 1.

(A) Reference-free 2D averages of free Pol I (upper row) and Pol I in complex with Rrn3 (middle row). Averages derive from 2D classes containing between 100 and 200 images each. The cleft and stalk are labelled C and S. A salmon arrow indicates the position of the additional mass in the Pol I–Rrn3 complex. In the bottom row, difference map between the two previous reconstructions, showing the presence of Rrn3 in salmon. (B) Reference-free 2D averages of a Pol I–Rrn3 complex labelled with an anti-Strep-tag antibody bound to the C-terminus of Rrn3 (bottom row), compared with similar averages of the Pol I–Rrn3 complex (top row). Averages derive from 2D classes containing between 200 and 500 images each. Salmon and yellow arrows indicate densities assigned to Rrn3 and the Fab part of the antibody, respectively. (C) Reconstructed 3D volume of the Pol I–Rrn3–anti-Strep with fitted crystal structures of Pol I in grey, Rrn3 in salmon, and an Fab in cyan. In yellow is the density assigned to the Fab part of the antibody, as shown by difference mapping with the Pol I–Rrn3 map. Green and red spheres indicate the position of the Rrn3 C-terminus after fitting inside the Pol I–Rrn3 map in two opposite orientations, with only the green being compatible with antibody labelling.
Figure 5—figure supplement 2. Cryo-EM structure of the yeast Pol I–Rrn3 complex.

Figure 5—figure supplement 2.

(A) Typical field of our cryo-EM grids. The scale bar represents 50 nm. (B) Initial reference-free 2D averages showing a significant level of detail. An arrow indicates the position of Rrn3. (C) Data processing strategy, showing the initial volume, the result of 3D classification, and the three refined maps with their corresponding local resolution and FSC curves.
Figure 5—figure supplement 3. Structural details of the monomeric Pol I and Pol I–Rrn3 cryo-EM structures.

Figure 5—figure supplement 3.

(A) Close-up views of significant regions in the structure of monomeric Pol I at 4.9 Å resolution: clamp (upper-left), lobe (upper-right), funnel (bottom-left), and groove (bottom-right). (B) Close-up views of significant regions in the structure of monomeric Pol I at 7.7 Å resolution: funnel (left) and Rrn3 (right).

Our monomeric Pol I structure provides a detailed picture of the structural transition from homodimers to monomers, a critical step in Pol I activation (Figure 5A–B). The Pol I stalk appears almost completely disordered, in spite of weak density at the region directly contacting the enzyme core, i.e. the tip domain in subunit A43 (Figure 5C). This indicates that the stalk is highly dynamic, which may be important in the Pol I activation process. Additionally, the A12.2 C-terminal Zn-ribbon, the central part of the bridge helix and the DNA-mimicking loop are not visible in our structure, suggesting that these regions are also flexible (Figure 5C). When compared with the crystal structure of dimeric Pol I (Engel et al., 2013; Fernández-Tornero et al., 2013), which is essentially identical to dimeric Pol I in solution (Pilsl et al., 2016), our monomeric Pol I structure presents a rearranged cleft entrance where the clamp coiled-coil and the protrusion approach by about 4 Å (Figure 5B). The resulting cleft entrance is 38 Å in width, which leaves enough room for double stranded DNA to access the bottom of the cleft. While further cleft closure is required to reach a transcription-competent state (Neyer et al., 2016; Tafur et al., 2016), the cleft in monomeric Pol I is about half way from inactive dimeric to elongating Pol I. Additionally, the dimer to monomer transition affects several other domains in Pol I, including movement of the jaw towards the clamp core, as well as the opening of the foot and associated subunit Rpb5 (Figure 5D; Video 2).

Video 2. Structural transition from Pol I homodimers to monomers.

Download video file (377.9KB, mp4)
DOI: 10.7554/eLife.20832.019

The Pol I enzyme is presented in the same view as Figure 5B, with the clamp on the right and the protrusion on the left.

DOI: http://dx.doi.org/10.7554/eLife.20832.019

Our cryo-EM map of the Pol I–Rrn3 complex shows the precise location of the activating factor on the enzyme (Figure 6A). The elongated Rrn3 molecule binds on the concave face of a valley formed by the stalk and the dock domain in subunit A190, and extends further to reach the AC40/AC19 heterodimer at the back of the enzyme. Interestingly, Rrn3 binding fixes the Pol I stalk with respect to free monomeric Pol I, thus generating a surface for interaction with promoter-bound initiation factors (Figure 6B). Apart from stalk ordering, the conformation of the enzyme in the Pol I–Rrn3 complex is virtually identical to that of monomeric Pol I, indicating that conformational changes are not associated with Rrn3 binding. Comparison of our cryo-EM reconstruction with the reported structures (Engel et al., 2016; Pilsl et al., 2016) shows minor differences such as flexibility of the A12.2 C-terminal Zn ribbon and a slightly shifted orientation of Rrn3 (Figure 6—figure supplement 1), which reveals a certain degree of plasticity in the complex.

Figure 6. Structure of the Pol I–Rrn3 complex.

(A) Cryo-EM reconstruction of Pol I in complex with Rrn3 (left) superposed with the derived pseudo-atomic model (right). The different Pol I structural domains and subunits are labelled. (B) Stalk fixation in the transition from free to Rrn3-bound Pol I, in a lateral view as indicated. Subunit A14 and the different domains in subunit A43 are indicated.

DOI: http://dx.doi.org/10.7554/eLife.20832.020

Figure 6.

Figure 6—figure supplement 1. Structural comparison of Pol I–Rrn3 cryo-EM structures.

Figure 6—figure supplement 1.

Comparison between the Pol I–Rrn3 structure reported here (yellow) and EMDB-3439 (green), with derived atomic models on the right side.

The stalk subunit A14 influences rDNA promoter association

Our Pol I–Rrn3 structure underscores Pol I regions that are critical to bind the activating factor (Figure 7A–B). The A43 subunit strongly binds Rrn3 HEAT repeats H2-H4, through interaction surfaces of both proteins that contain several serine residues. In particular S145 in Rrn3, whose phosphomimetic mutant exhibits a growth defect (Blattner et al., 2011), falls at the heart of a serine cradle in the A43 OB domain formed by residues S141, S143, S156 and S244 (Figure 7C). The second stalk subunit, A14, contacts Rrn3 around HEAT repeat H5 using helix α2 of its tip-associated (TA) domain. The residues in this helix that are more proximal to Rrn3 include a stretch of three serines and also arginine 91 (Figure 7D). The central part of Rrn3 contacts both the stalk-binding domain in subunit A135 and the dock domain in subunit A190 at Pol I-specific insertions (Figure 7E). Finally, the C-terminal third of Rrn3 contacts subunit AC19 and the AC40 C-terminus, in agreement with data showing that K329 in AC40 crosslinks K558 in Rrn3 (Blattner et al., 2011).

Figure 7. Mutational analysis of Pol I stalk subunits contacting Rrn3.

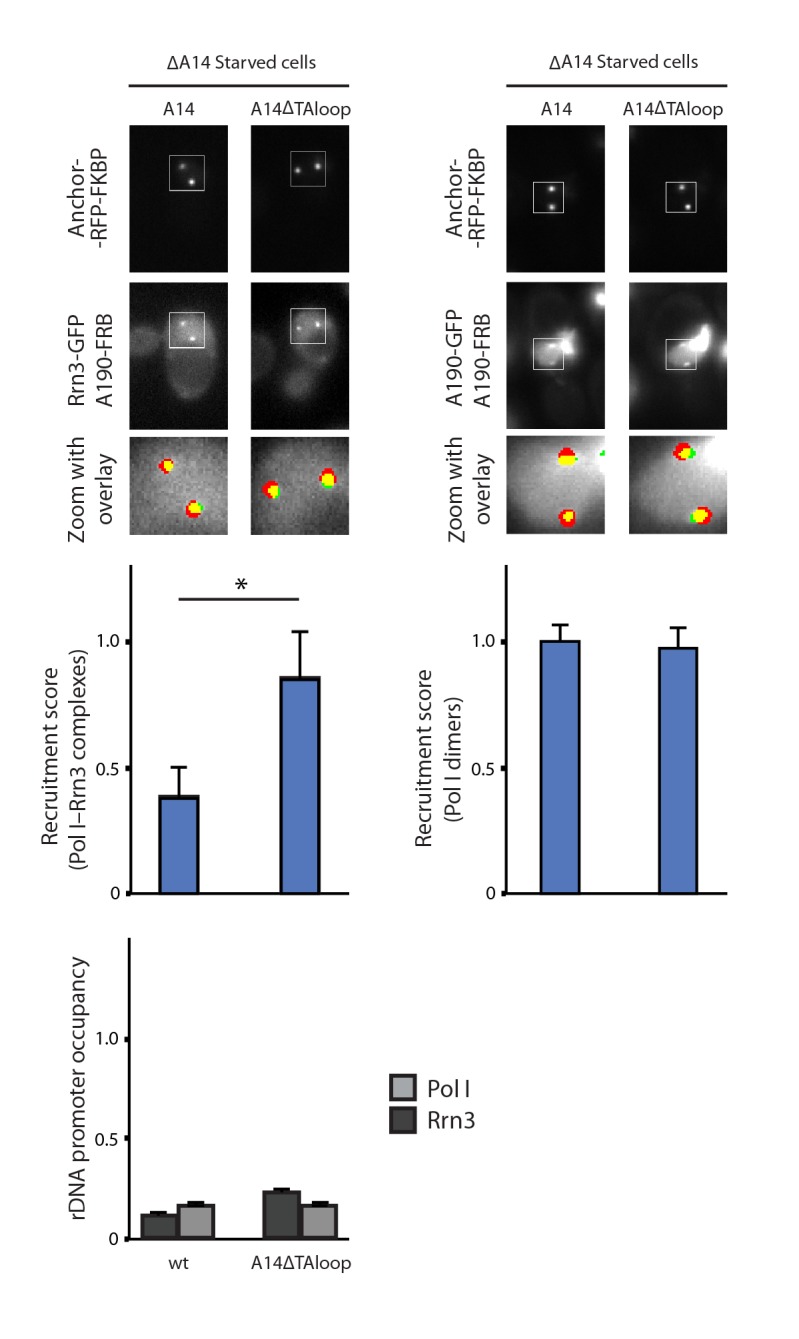
(A) Bar diagrams of the Pol I regions involved in Rrn3 binding, with connecting lines as derived from the cryo-EM structure. α-helices 1 and 2 in the A14 TA domain are marked in dark red. Serine residues in the A43 cradle, A14 stretch and Rrn3 patch are shown above the corresponding bars, with Rrn3-S145 in red. (B) Close-up view of the Pol I–Rrn3 interaction in a similar orientation to that in Figure 6B. HEAT repeats in Rrn3 labelled H1 to H10. Dotted lines represent disordered regions in the Pol I and Rrn3 crystal structures. Boxed-text marks truncated regions in the yeast mutants of panel F. (C) Close-up view of the serine cradle in A43 that accommodates serine 145 in Rrn3. (D) Close-up view of A14 helix α2, which lies in the vicinity of Rrn3. (E) Pol I specific insertions in subunits A190 and A135 are shown in green. (F) Representative PICT images of the RFP-tagged anchor (upper row), GFP-tagged Rrn3 (middle row) and a zoom of a 2.6 × 2.6 µm square around anchoring platforms (bottom row) of different mutant strains. Below, quantification of the Rrn3-GFP recruitment score, normalized to the measurement of the wild-type strain (Mean ± SD, p-value * < 0.01 t-test). At the bottom, ChIP experiments showing the relative association of A190 (light) and Rrn3 (dark) to the rDNA promoter region. All ChIP experiments were normalized to the value of the wild-type strain in rich medium (Mean ± SD).

DOI: http://dx.doi.org/10.7554/eLife.20832.022

Figure 7.

Figure 7—figure supplement 1. Additional characterization of Pol I stalk mutants.

Figure 7—figure supplement 1.

(A) Comparative growth phenotype at 28°C and 37°C of the different A14 mutants. Serial dilutions (1:10) of wild-type and mutant strains were spotted on either YPD or selective SC medium and grown for 2–3 days at the indicated temperatures. (B) Western-blot analysis of A190 and Rrn3 of the whole cell extract from the different A14 mutants, using rabbit anti-A190 and mouse anti-GFP, respectively. Mouse anti-Pgk1 was used as a loading control. (C) Western-blot analysis of different Pol I subunits in the ΔA14 strain. All antibodies against Pol I subunits are from rabbit.
Figure 7—figure supplement 2. Characterization of A14ΔTAloop in starving conditions.

Figure 7—figure supplement 2.

Representative PICT images of the RFP-tagged anchor (upper row), GFP-tagged Rrn3 (middle-left) or A190 (middle-right), and a zoom of a 2.6 × 2.6 µm square around the anchoring platforms (bottom row). Below, quantification of the Rrn3- or A190-GFP recruitment score, normalized to the measurement of the wild-type strain in rich (Rrn3-GFP) or starving (A190-GFP) medium (Mean ± SD, p-value * < 0.01 t-test). At the bottom, ChIP experiments showing the relative association of A190 (light) and Rrn3 (dark) to the rDNA promoter region. All ChIP experiments were normalized to the value of the wild-type strain in rich medium.

While the relevance of A43 in Rrn3 binding has been demonstrated (Peyroche et al., 2000), no evidence for A14 has been reported yet. Based on our cryo-EM structure, we engineered several A14 mutants to assess their role in complex formation and promoter association. We first took advantage of the fact that cells lacking this subunit are viable to produce a knockout mutant (ΔA14). In agreement with cryo-EM data, ΔA14 cells exhibit a 75% decrease in Pol I–Rrn3 as compared to wild-type (Figure 7F). A similar decrease in promoter association for both components of the complex was measured by ChIP. Moreover, this strain presents a growth defect but the levels of several Pol I subunits including A43 and those of Rrn3 are unaffected (Figure 7—figure supplement 1). These results indicate that A14 plays a role in Pol I association to rDNA. We then produced specific deletions of different A14 structural elements that, according to our cryo-EM structure, lie in the vicinity of Rrn3 (Figure 7). As in the case of ΔA14, cells expressing these mutations present similar levels of A190 and Rrn3 to wild-type cells (Figure 7—figure supplement 1B). A strain lacking the C-terminal tail (A14ΔCt, Δ101–137) presents similar levels of Pol I–Rrn3 and promoter association as wild-type cells (Figure 7F), indicating that the A14 C-terminal tail is not involved in Rrn3 binding. In accordance, this mutant exhibits normal growth (Figure 7—figure supplement 1A). However, a strain that also lacks helix α2 of the TA domain (A14△α2Ct, Δ80–137) presents about one third reduction in detected Pol I–Rrn3 levels and promoter association (Figure 7F). While less intense, this resembles the behaviour of ΔA14, also at the growth level (Figure 7—figure supplement 1). Moreover, we generated an A14 point mutant at arginine 91 (A14-R91E) exhibiting a reduction in detected levels of Pol I–Rrn3 and in promoter association that is comparable to that observed for ΔA14 (Figure 7F), while growth is less affected (Figure 7—figure supplement 1A). Our A14 mutational analysis indicates that helix α2 is fundamental for Rrn3 binding and subsequent promoter association.

Finally, we engineered a strain lacking an internal loop in the TA domain that appears disordered in the crystal structure of dimeric Pol I (A14ΔTAloop; Δ53–77). Strikingly, this mutant behaves opposite to ΔA14 and helix α2 mutants, as it shows a 2-fold increase in detected Pol I–Rrn3 complexes (Figure 7F). In accordance, we observe a 3- and 1.5-fold increase in promoter association for Pol I and Rrn3, respectively, while growth is not affected (Figure 7F; Figure 7—figure supplement 1A). When cells expressing A14ΔTAloop were cultured under starving conditions, the Pol I–Rrn3 levels are about double of the wild-type, while detected Pol I homodimers and promoter occupancy of Pol I and Rrn3 remain unaffected (Figure 7—figure supplement 2). This suggests that the TA-loop in A14 has a role in limiting binding to Rrn3. These data also show that higher levels of Pol I–Rrn3 are not sufficient to influence Pol I homodimerization or promoter dissociation in starved cells.

Discussion

In this study, which includes a wealth of techniques ranging from structural analysis to in vivo interaction experiments, we shed light on the regulation of Pol I activation, the first step in ribosome biogenesis. An improved PICT assay allowed us to investigate the levels of Pol I homodimers and Pol I–Rrn3 complexes in response to nutrient availability. We also provide a detailed picture of the conformational rearrangements taking place in the transition between the inactive and activated states of Pol I, and identify distinct stalk regions as central structural elements in this process.

Dimerization as a Pol I storage mechanism

Cellular polymerases are recruited to the promoter in an active, monomeric conformation (Hirata et al., 2008; Murakami et al., 2002; Vannini and Cramer, 2012). However, Pol I can also form homodimers that are incompetent for transcription, yet this assembly could only be observed in vitro (Engel et al., 2013; Fernández-Tornero et al., 2013; Milkereit et al., 1997). While we were unable to detect Pol I dimers in growing cells, nutrient depletion induced enzyme homodimerization. Moreover, these dimers also form after inhibition of either rRNA maturation with diazaborine or protein synthesis with cycloheximide. While these three processes are mechanistically different, they all negatively affect events that are downstream of Pol I transcription. It is therefore likely that, when rRNA synthesis has to be reduced, transcriptionally disengaged Pol I molecules form inactive dimers. This peculiar mechanism implies two major advantages. On one hand, the formation of compact homodimers could protect a pool of this highly-abundant enzyme from degradation, thus saving energy to the cell. On the other hand, upon restoration of favourable conditions, rRNA synthesis can be reactivated, while de novo Pol I production would delay the process, especially if few ribosomes are available. Finally, although we cannot exclude that Pol II or Pol III could homodimerize in conditions other than nutrient starvation, our results suggest that homodimerization is not a general mechanism to regulate eukaryotic transcription.

Cells fine-tune the levels of Pol I complexes in response to nutrient availability

While only a minor fraction of Pol I is bound to Rrn3 in growing cells (Milkereit and Tschochner, 1998), the formation of this complex is a pre-requisite for transcription initiation (Aprikian et al., 2001; Schnapp et al., 1993). We show that nutrient depletion induces a rapid reduction in the levels of Pol I–Rrn3, which correlates in time with a marked decrease in the promoter association of both Pol I and Rrn3. We also show that promoter dissociation is strongly reduced in a strain where Pol I is permanently attached to Rrn3. This suggests an influence of Pol I–Rrn3 levels in rDNA transcription. However, the levels of Pol I–Rrn3 as such are not sufficient to account for transcription inactivation by nutrient depletion, as Pol I–Rrn3 complexes can be detected regardless of null promoter levels of A190 and Rrn3. This is in agreement with previous observations of rDNA transcription inactivation by inhibition of TOR signalling (Philippi et al., 2010). Interestingly, our A43ΔCt mutant, which specifically impairs Pol I homodimerization, shows that this mechanism also contributes to inactivate Pol I transcription in response to nutrient deprivation. Therefore, both Pol I–Rrn3 and Pol I dimerization modulate rDNA transcription, which allows us to propose a model (Figure 8). When nutrients are depleted, Pol I–Rrn3 levels and promoter association drop exponentially whereas Pol I only homodimerizes subsequently. Remarkably, 20 min after starvation, Pol I–Rrn3 levels remain relatively high in spite of marginal amounts of promoter association. We thus hypothesize that, in addition to Pol I–Rrn3 disassembly, additional regulatory mechanisms may contribute to initial transcriptional inactivation. At a later stage, Pol I homodimerization remains a major factor limiting transcription. Upon refeeding from starvation, we propose that available Pol I–Rrn3 complexes are rapidly recruited for transcription, while disruption of Pol I homodimers provides fresh Pol I that can interact with Rrn3 to increase Pol I–Rrn3 complexes and further activate rDNA transcription.

Figure 8. Model for the influence of nutrient availability on the assembly of Pol I complexes.

Nutrient addition to starved cells induces formation of Pol I–Rrn3 complexes to activate transcription, while Pol I homodimers disrupt to generate fresh monomeric Pol I (green arrows). Nutrient depletion causes partial disruption of Pol I–Rrn3 complexes and formation of Pol I homodimers (orange arrows). Both events downregulate rDNA transcription, while additional regulatory mechanisms may also participate.

DOI: http://dx.doi.org/10.7554/eLife.20832.025

Figure 8.

Figure 8—figure supplement 1. Comparison with other transcription systems.

Figure 8—figure supplement 1.

(A) Cryo-EM reconstruction of the Pol I–Rrn3 complex with fitted Pol II–Mediator head complex (PDB 4V1O). The mediator head is in cyan, while its Med18 subunit is in blue. (B) Cryo-EM reconstruction of the Pol I–Rrn3 complex with fitted bacterial RNA polymerase holoenzyme (PDB 1IW7). σ70 is in pink, while its σ4 domain is in blue.

In contrast to eukaryotes, bacteria use a single form of RNA polymerase to transcribe their entire genome. In response to stress, bacteria induce the production of the ppGpp alarmone, which targets RNA polymerase at an allosteric site (Mechold et al., 2013; Zuo et al., 2013). This selectively destabilizes initiation complexes at GC-rich promoters, such as those of rRNA (Travers, 1980). The presence of a dedicated transcription system for rDNA allows eukaryotes to specifically downregulate rRNA production in order to control cell growth. Our results indicate that Pol I dimers and Pol I–Rrn3 complexes contribute to achieve this goal.

The Pol I stalk as a sensing platform of the cell state

The yeast A43 subunit comprises an elongated core, conserved within eukaryotic RNA polymerases (Kuhn et al., 2007), flanked by specific N- and C-terminal extensions (Figure 7A). We demonstrate that the A43 C-terminal end is essential for enzyme inactivation through Pol I dimerization, in accordance with published structural data (Engel et al., 2013; Fernández-Tornero et al., 2013). The A43 C-terminal tail is conserved from yeast to human, arguing for a Pol I monomer/dimer modulation of rRNA synthesis in higher eukaryotes (Beckouët et al., 2011). Nevertheless, there are organisms lacking the A43 C-terminal tail, such as S. pombe and A. thaliana, where likely no Pol I dimerization will take place in nutrient-arrested cells. Additionally, our cryo-EM structure shows that the main Pol I element involved in Rrn3 interaction is the OB domain in the A43 elongated core. This is consistent with reported data in yeast (Peyroche et al., 2000) and with the identification of an OB peptide that can bind Rrn3 in human (Rothblum et al., 2014). Moreover, our structure points towards a contact between a serine cradle in A43 and a serine patch in Rrn3. In agreement, it was shown that this interaction can only take place if Pol I is phosphorylated and Rrn3 is not (Fath et al., 2001; Gerber et al., 2008).

Additionally, we show that A14 is also involved in Rrn3 interaction. When A14 is deleted, both Rrn3 binding and promoter association of both Pol I and Rrn3 are severely impaired. A similar behaviour can be obtained by either deletion of the last 58 residues in subunit A14 or the A14-R91E point mutant. This suggests that A14, and helix α2 in particular, plays an important role in Pol I–Rrn3 complex formation, as suggested by cryo-EM data. Furthermore, the TA-loop, which is disordered in the dimeric Pol I crystal structure, is involved in limiting Rrn3 binding to Pol I. Deletion of this region leads to a strong increase in both Pol I–Rrn3 complex formation and its association with the rDNA promoter in growing cells. Genetic studies in S. pombe implicated the A14 homolog in Rrn3 binding (Imazawa et al., 2005), supporting that our A14 observations may be extended to other organisms.

A common surface for activating cofactors

Three structural elements in Pol I are involved in the interaction with Rrn3: (i) the stalk, (ii) the dock domain, and (iii) the AC40/AC19 heterodimer. Contact of the activating factor with these three regions is therefore required for activation and subsequent binding to promoter-attached initiation factors. In the Pol II system, the Mediator complex acts as an activating cofactor required for association of the enzyme to promoter-bound initiation factors (Kim et al., 1994). Interestingly, the Pol II–Mediator structure shows that the coactivator contacts the enzyme at the stalk, the dock domain, and the AC40/AC19 homolog (Plaschka et al., 2015). While other details of the enzyme-cofactor interaction differ between both transcription systems (Figure 8—figure supplement 1A), the described similarities suggest that the interaction of activating factors with the stalk and surrounding regions might help bring RNA polymerases to the promoter. Additionally, in spite of significant differences with bacterial transcription, the σ factor may also be regarded as an activator, as its binding is required for promoter association. Fitting of the bacterial holoenzyme structure into our cryo-EM map shows that domain 4 of the σ factor (σ4) falls in the region where Rrn3 is located and contacts equivalent domains of the RNA polymerase core (Figure 8—figure supplement 1B). Moreover, σ4 binds the bacterial promoter DNA (Murakami et al., 2002) and mammalian Rrn3 was shown to interact with the rDNA promoter (Stepanchick et al., 2013). These analogies suggest that an overall architectural arrangement may be conserved to mediate enzyme activation and promoter recruitment.

Materials and methods

Yeast strains

The strains used are listed in Supplementary file 1. Strain construction and other genetic manipulations were performed following standard procedures (Burke et al., 2000). Briefly, FKBP-RFP, FRB and GFP tagging was performed by gene replacement using standard PCR strategies. The same was done for deletions of RPA14 (rpa14Δ, ΔA14) and the C-terminal regions of RPA14 (A14ΔCt) and RPA43 (A43ΔCt). The remaining A14 mutants were obtained by directed mutagenesis of the wild type RPA14 gene cloned in a centromeric plasmid, which was used to transform the rpa14Δ strain, followed by selection in appropriate medium.

Live-cell imaging

The PICT assay was carried out as described (Gallego et al., 2013). For analysis, strains were grown in YPD medium at 30°C overnight, then diluted and grown up to exponential phase in synthetic complete (SC) medium. Cells attached to 35 mm glass bottom culture dishes coated with Concanavalin A were incubated for 2 hr at 30°C in either SC-Low Fluorescence medium (lacking folic acid and riboflavine) or the same medium without nitrogen and glucose. Where indicated, 10 μM rapamycin was also added, either alone or together with 0.2 µg/ml cycloheximide or 10 µg/ml diazaborine. Images were acquired on an Olympus IX81 microscope equipped with 100x/1.30 objective lens, a Hamamatsu Orca-ER camera, and two complete fluorescence filter cubes from AHF respectively optimized for GFP (ET Bandpass 470/40 + Beamsplitter 500DVXRUV + ET Bandpass 525/50) and RFP (ET Bandpass 545/30 + Beamsplitter 580 DVXRUV + BrightLine HC 617/73). All strains were analyzed in three biological replicates, where each sample was imaged in at least 6 fields of view close to the equatorial section of the cells. The acquisition of both fluorescence channels was performed sequentially by switching the filter cubes. The software ImageJ (http://rsb.info.nih.gov/ij/) was used to analyze the images and a custom image analysis workflow was developed and implemented in ImageJ macro language to enable the automatic processing of complete data sets. This workflow independently processes RFP (red) and GFP (green) channels to segment spot like structures of a specific size in the images; the functional steps (Figure 1—figure supplement 2) are identical for both channels but the settings are slightly different to adapt to the difference in image quality. The recruitment score is defined as the ratio of (i) the summed area of all segmented prey-GFP spots overlapping with segmented RFP-anchors multiplied by the mean GFP intensity measured inside this region, to (ii) the summed area of all segmented RFP-anchors. The overall recruitment score for a condition is hence a measurement performed over tens of small image regions coming from all the images of a given replica. The segmentation of RFP-anchors is almost flawless since the signal to noise ratio is very high for this channel. Prey-GFP spots are more challenging to segment due to their lower contrast and the presence of a strong but smoothly varying background signal, still the results are reasonably good thanks to the pre-filtering and local thresholding adapted to the expected spots geometry, and the automatic validation of the segmented particles based on their geometry (Figure 1—figure supplement 2). Furthermore, from the recruitment score definition, only false positive prey-GFP spots overlapping with RFP-anchors do actually count toward the recruitment score; since anchors are sparsely located, and are virtually segmented flawlessly, this only happens very marginally. Finally, no condition specific increase in GFP signal background intensity could be detected by our control experiments (Figure 1—figure supplement 3F; Figure 3—figure supplement 1B). Overall, the recruitment score is hence highly reproducible, which is backed by the low standard deviations observed across the three biological replicates of each condition.

Localization of the recruited prey-GFP on the Tub4-RFP-FKBP anchoring platform was done on images obtained from the corresponding PICT assay. Images were background subtracted and cells with two anchoring platforms were selected. Intensity profile was extracted for a line that linked the brightest pixel of each Tub4-RFP-FKBP anchoring platform, both for the red and the green channel. The ImageJ software (http://rsb.info.nih.gov/ij/) was used to analyze 10 cells for each strain. As the nucleus is found between two Tub4-RFP-FKBP anchoring platforms of yeast cells with two spindle pole bodies, recruited preys-GFP that specifically accumulate between the two anchoring platforms were scored as nuclear (Figure 1—figure supplement 1B).

Co-immunoprecipitation (co-IP)

Cells were grown to early logarithm phase and then half of the culture volume was crosslinked while the remaining half was filtered, washed, and incubated in starving medium for 2 hr. The latter was then crosslinked after the 2 hr incubation. After crosslinking the two halves were harvested, washed with water, and suspended in lysis buffer containing protease and phosphatase inhibitors. The cell suspension was flash frozen in liquid nitrogen, and then ground to a fine powder using a chilled mortar. Afterwards, the cell lysate was thawed slowly on ice, transferred to pre-chilled tubes and centrifuged. The supernatant was collected and total protein concentration was estimated. The pellet containing the chromatin insoluble fraction was resolubilized in lysis buffer by sonication. After clarification by centrifugation, the supernatant was recovered. A190-TAP was then precipitated, the volume of each cell extract containing 20 mg of protein was incubated with 50 μl of IgG Sepharose 6FF (GE Healthcare, Pittsburgh, PA) slurry overnight at 4°C, and then, after extensive washing and decrosslinking at 65°C for several hours, analysed by western-blot using a monoclonal antibody against the Myc epitope.

Chromatin immunoprecipitation (ChIP)

ChIP and purification, quantitative real-time PCR (qPCR) amplification and data analysis were performed described (García et al., 2010). For starvation experiments, cells were grown to early logarithm phase and then half of the cultures were crosslinked and half harvested, washed and incubated in starvation media for 1 hr. Then, the second half cultures were crosslinked. Following ChIP and purification, qPCR was performed with a CFX96 Detection System (Bio-Rad, Hercules, California), using SsoAdvanced Universal SYBR Green Supermix (Bio-Rad) following manufacturer’s instructions. Anti-GFP for Rrn3 analysis and anti-A190 are from rabbit (Molecular Probes and gift of Michel Riva, respectively). Four serial 10-fold dilutions of genomic DNA were amplified, using the same reaction mixture as for samples to construct the standard curves. qPCR reactions were performed in triplicate and with at least three independent ChIPs (biological replicate). Each biological replicate contained two technical replicates. Quantitative analysis was carried out using the CFX96 Manager Software (version 3.1, Bio-Rad). Plotted data correspond to mean values from at least three different experiments and the error bars represent standard deviations. To characterize the rDNA occupancy of Pol I subunit A190 and Rrn3-GFP, a 35S rDNA promoter region and a 5S rRNA gene region were amplified. After normalizing the IP to the respective input values and to a non-transcribed region of chromosome VII, relative occupancies were obtained by relating data from the promoter region to the 5S rDNA as described (Philippi et al., 2010).

Protein purification and Pol I–Rrn3 complex formation

Rrn3 was amplified by PCR from yeast genomic DNA and cloned into pETM11 between NcoI and Acc65I restriction sites, resulting in an N-terminal hexahistidine tag followed by a tobacco etch virus (TEV) protease target sequence. His-TEV-Rrn3 was expressed in E. coli Rosetta Cells (Novagen, Madison, Wisconsin) in TB autoinducing medium overnight at 24°C. Cells were harvested by centrifugation and resuspended in L Buffer (50 mM HEPES pH 7.8, 200 mM NaCl, 10% glycerol, 15 mM imidazol, 2 mM beta-mercaptoethanol) supplemented with protease inhibitors (cOmplete EDTA-free, Roche, Switzerland). Cells were sonicated and the lysate was centrifuged at 20,000 g for 40 min. The supernatant was loaded on HisTrap (GE Healthcare) equilibrated in L Buffer with 0.5 mM Phenylmethylsulfonyl fluoride and eluted in a linear gradient to 400 mM imidazole. Rrn3-containing fractions were pooled, loaded on Mono Q (GE Healthcare) equilibrated in MQ Buffer (50 mM HEPES pH 7.8, 200 mM NaCl, 5 mM DTT), and eluted in a linear gradient to 750 mM NaCl. Pooled fractions were concentrated and loaded on a Superdex 200 (GE Healthcare) equilibrated in GF Buffer (20 mM HEPES pH 7.8, 100 mM Na2SO4, 1 mM MgCl2, 10 μM ZnCl2, 5 mM DTT). Eluted fractions were concentrated to 20 mg/mL, frozen in liquid N2 and stored at −80°C.

Pol I was obtained according to published protocols (Moreno-Morcillo et al., 2014). A Pol I variant lacking the last 49 residues in subunit A43 was isolated from standard purifications, as a distinct peak in ionic exchange chromatography. For Pol I–Rrn3 complex preparation, the enzyme was dialyzed against GF Buffer and incubated with Rrn3 in a 1:1 molar ratio on ice for 16 hr. The sample was cross-linked with 0.16% glutaraldehyde for 5 min on ice and subsequently quenched with 25 mM Tris pH 8.3, 200 mM glycine. This sample was injected in a Superdex 200 (GE Healthcare) size exclusion column equilibrated in EM buffer (20 mM HEPES pH 7.8, 100 mM NaCl). The quality of the crosslinked sample was assessed by SDS-PAGE, native gel electrophoresis and LC-ESI MS/MS. For Rrn3 antibody labelling in the context of the Pol I–Rrn3 complex, Pol I was incubated with Rrn3 in a 1:1 molar ratio overnight at 4°C in GF buffer, supplemented with HEPES up to 110 mM. The sample was crosslinked by incubation with 0.48% glutaraldehyde for 5 min on ice and then quenched with 25 mM Tris pH 8.3, 200 mM glycine. The StrepMab-Immo antibody (IBA, Germany) was then added to form the Pol I–Rrn3–antibody complex (1:1:1.5 molar ratio). The mixture was loaded in a Superose 6 (GE Healthcare) equilibrated in GF1 buffer (20 mM HEPES pH 7.8, 85 mM Na2SO4, 3 mM DTT) to isolate the complex of interest from the free antibody and crosslinking aggregates.

Electron microscopy

For negative-staining EM, crosslinked Pol I–Rrn3 (20 ng/μl) was adsorbed on a glow-discharged carbon-coated copper grid and stained with 2% uranyl formate. Observations were performed in a JEOL-1230 electron microscope operated at 100 kV and micrographs were recorded under low-dose conditions (~10 e–/Å2) using a 4k × 4k TemCam-F416 camera (TVIPS) at 2.28 Å/pixel. The same procedure was used for the Pol I–Rrn3–antibody complex, except that micrographs were collected at 2.84 Å/pix.

For cryo-EM, 4 µl of crosslinked Pol I–Rrn3 (60 ng/µl) were placed onto glow-discharged Quantifoil R2/2 grids and incubated in the chamber of a FEI Vitrobot at 4°C and 95% humidity for 30 s before blotting for 2 s at an offset of –2 mm. Data were collected on a FEI Titan Krios electron microscope operated at 300 kV, using FEI automated single particle acquisition software (EPU) on a back-thinned FEI Falcon II detector at a calibrated magnification of 79,096 (pixel size of 1.77 Å). Defocus values ranged from 1.9 to 4.2 µm. Videos were intercepted at a rate of 68 frames for 4 s exposures.

Image processing

For negative-staining, around 63,500 images of Pol I and 42,400 images of Pol I–Rrn3 were extracted using EMAN (Tang et al., 2007) and binned to 5.68 Å/pixel of 2D analysis. The contrast transfer function (CFT) was estimated using CTFFIND3 (Mindell and Grigorieff, 2003) and corrected by flipping phases. Reference-free averages were obtained using EMAN, while 3D reconstructions were carried out using protocols implemented in Xmipp (Scheres et al., 2008). The correctness of the final structures was supported by the high correlation between 2D projections of the models and reference-free averages. In the case of Pol I–Rrn3–antibody, data processing was done in Scipion (de la Rosa-Trevín et al., 2016) following a similar procedure except that 10,997 particles selected after 2D classification were subjected to several rounds of 3D classification using Relion (Scheres, 2012). A 3D class containing 1355 particles clearly corresponded to Pol I–Rrn3–antibody complex.

For cryo-EM, 1288 movies were averaged using optical flow correction (Abrishami et al., 2015) and their CTF was estimated using CTFFIND4 (Mindell and Grigorieff, 2003). Approximately 230,000 particles were automatically selected using RELION (Scheres, 2012), also employed for subsequent data processing (Supplementary file 2). Two rounds of reference-free 2D class averaging allowed removal of bad particles, yielding a stack of 190,750 good-quality images. A negative-staining reconstruction of free Pol I was low-pass filtered at 60 Å and used as starting model to sort the images using 3D classification. Particles were split into six classes with T = 4, an offset search range of 6 pixels, and offset search steps of 2 pixels. Only one class containing a total of 32,175 images clearly showed density for both Pol I and Rrn3, while a second class with 90,173 particles corresponds to monomeric Pol I. Both particle sets were subjected to 3D refinement including particle polishing and post-processing, which yielded maps for monomeric Pol I and Pol I–Rrn3 with final resolutions of 5.6 and 7.7 Å, respectively, according to the gold-standard FSC = 0.143. Finally, both particle sets were added together and subjected to the same refinement procedure, producing a map with a resolution of 4.9 Å.

Structure modeling

The available crystal structure of dimeric Pol I (PDB entry 4C3H) was fitted into the cryo-EM map of monomeric Pol I at 4.9 Å resolution, using UCSF Chimera (Pettersen et al., 2004). Regions that appeared disordered in the cryo-EM map were deleted from the model using COOT (Emsley and Cowtan, 2004). The resulting model was divided into 30 different rigid bodies, as previously defined (Moreno-Morcillo et al., 2014), subjected to rigid-body real-space refinement using PHENIX (Adams et al., 2010) and finally corrected for chain breaks. The same procedure was used for the cryo-EM map of the Pol I–Rrn3 complex by the addition of the Rrn3 crystal structure (PDB entry 3TJ1), which was divided into two rigid bodies at the disordered acidic loop located in the middle region of the Rrn3 structure. Figures were prepared with UCSF Chimera or Pymol (www.pymol.org).

Data availability

The Pol I–Rrn3 and Pol I monomer cryo-EM maps were deposited under accession numbers EMD-4086 and EMD-4087. The cryo-EM map of the Pol I monomer at 4.9 Å resolution and its corresponding pseudo-atomic model were deposited under accession codes EMD-4088 and PDB-5LMX.

Acknowledgements

The authors would like to thank KS Murakami and M Moreno-Morcillo for critically reading the manuscript. We are also grateful to IS Fernández, S Scheres, I Fita, R Méndez, KR Vinothkumar and NMI Taylor for helpful advice. We express our gratitude to M Riva and O Gadal for providing plasmids, strains and antibodies, the LMB-MRC for access to electron microscopes, V Abrishami for movie processing, D Ureña for yeast growth, H Bergler for the diazaborine compound, A Paradela for mass spectrometry, the ADMCF-IRB for live-cell imaging, and the CIB Protein Chemistry Facility for N-terminal sequencing. The project was supported by grant BFU2013-48374-P of the Spanish MINECO and by the Ramón Areces Foundation. OG held a research contract under the Ramón y Cajal program of the Spanish MINECO (RYC-2011–07967). IRB Barcelona is the recipient of a Severo Ochoa Award of Excellence from the Spanish MINECO.

Funding Statement

The funders had no role in study design, data collection and interpretation, or the decision to submit the work for publication.

Funding Information

This paper was supported by the following grants:

  • Ministerio de Economía y Competitividad BFU2013-48374-P to Carlos Fernández-Tornero.

  • Fundación Ramón Areces to Carlos Fernández-Tornero.

  • Ministerio de Economía y Competitividad RYC-2011-07967 to Oriol Gallego.

Additional information

Competing interests

The authors declare that no competing interests exist.

Author contributions

ET, Conceptualization, Formal analysis, Validation, Investigation, Methodology, Writing—review and editing, Designed, carried out and analyzed protein complex preparation and electron microscopy experiments, and assisted with reviewing/editing the manuscript.

JAL, Formal analysis, Investigation, Methodology, Writing—review and editing, Designed, carried out and analyzed protein complex preparation and electron microscopy experiments, and assisted with preparing the manuscript.

IP, Formal analysis, Investigation, Methodology, Designed, carried out and analysed PICT experiments and constructed yeast strains.

NG-P, Investigation, Constructed yeast strains, and carried out ChIP, CoIP, western blot and growth phenotype analysis.

DG-C, Investigation, Methodology, Carried out cryo-EM grid preparation and quality control.

AGD, Investigation, Methodology, Developed the highly sensitive PICT assay and constructed yeast strains.

ST, Formal analysis, Methodology, Writing—review and editing, Designed and analysed PICT experiments and contributed to prepare the manuscript.

OG, Conceptualization, Resources, Formal analysis, Supervision, Validation, Investigation, Methodology, Writing—review and editing, Developed the highly sensitive PICT assay, designed and analyzed PICT experiments, and contributed to prepare the manuscript.

OC, Conceptualization, Resources, Formal analysis, Supervision, Validation, Investigation, Methodology, Writing—review and editing, Designed, carried out and analyzed ChIP experiments and CoIP assays, constructed yeast strains and contributed to prepare the manuscript.

CF-T, Conceptualization, Resources, Formal analysis, Supervision, Funding acquisition, Validation, Investigation, Methodology, Writing—original draft, Project administration, Writing—review and editing, Designed, carried out and analyzed protein complex preparation and electron microscopy experiments, contributed to design all other experiments, wrote the paper, and supervised the project.

Additional files

Supplementary file 1. Table of yeast strains used in this study.

DOI: http://dx.doi.org/10.7554/eLife.20832.027

elife-20832-supp1.docx (25.5KB, docx)
DOI: 10.7554/eLife.20832.027
Supplementary file 2. Table of statistics for the cryo-EM structures described in this study.

DOI: http://dx.doi.org/10.7554/eLife.20832.028

elife-20832-supp2.docx (58.7KB, docx)
DOI: 10.7554/eLife.20832.028

References

  1. Abrishami V, Vargas J, Li X, Cheng Y, Marabini R, Sorzano CÓ, Carazo JM. Alignment of direct detection device micrographs using a robust optical flow approach. Journal of Structural Biology. 2015;189:163–176. doi: 10.1016/j.jsb.2015.02.001. [DOI] [PubMed] [Google Scholar]
  2. Adams PD, Afonine PV, Bunkóczi G, Chen VB, Davis IW, Echols N, Headd JJ, Hung LW, Kapral GJ, Grosse-Kunstleve RW, McCoy AJ, Moriarty NW, Oeffner R, Read RJ, Richardson DC, Richardson JS, Terwilliger TC, Zwart PH. PHENIX: a comprehensive Python-based system for macromolecular structure solution. Acta Crystallographica Section D Biological Crystallography. 2010;66:213–221. doi: 10.1107/S0907444909052925. [DOI] [PMC free article] [PubMed] [Google Scholar]
  3. Aprikian P, Moorefield B, Reeder RH. New model for the yeast RNA polymerase I transcription cycle. Molecular and Cellular Biology. 2001;21:4847–4855. doi: 10.1128/MCB.21.15.4847-4855.2001. [DOI] [PMC free article] [PubMed] [Google Scholar]
  4. Beckouët F, Mariotte-Labarre S, Peyroche G, Nogi Y, Thuriaux P. Rpa43 and its partners in the yeast RNA polymerase I transcription complex. FEBS Letters. 2011;585:3355–3359. doi: 10.1016/j.febslet.2011.09.011. [DOI] [PubMed] [Google Scholar]
  5. Blattner C, Jennebach S, Herzog F, Mayer A, Cheung AC, Witte G, Lorenzen K, Hopfner KP, Heck AJ, Aebersold R, Cramer P. Molecular basis of Rrn3-regulated RNA polymerase I initiation and cell growth. Genes & Development. 2011;25:2093–2105. doi: 10.1101/gad.17363311. [DOI] [PMC free article] [PubMed] [Google Scholar]
  6. Bodem J, Dobreva G, Hoffmann-Rohrer U, Iben S, Zentgraf H, Delius H, Vingron M, Grummt I. TIF-IA, the factor mediating growth-dependent control of ribosomal RNA synthesis, is the mammalian homolog of yeast Rrn3p. EMBO Reports. 2000;1:171–175. doi: 10.1093/embo-reports/kvd032. [DOI] [PMC free article] [PubMed] [Google Scholar]
  7. Burke D, Dawson D, Stearns T. Methods in Yeast Genetics. New York: Cold Spring Harbor Laboratory Press; 2000. [Google Scholar]
  8. Bywater MJ, Poortinga G, Sanij E, Hein N, Peck A, Cullinane C, Wall M, Cluse L, Drygin D, Anderes K, Huser N, Proffitt C, Bliesath J, Haddach M, Schwaebe MK, Ryckman DM, Rice WG, Schmitt C, Lowe SW, Johnstone RW, Pearson RB, McArthur GA, Hannan RD. Inhibition of RNA polymerase I as a therapeutic strategy to promote cancer-specific activation of p53. Cancer Cell. 2012;22:51–65. doi: 10.1016/j.ccr.2012.05.019. [DOI] [PMC free article] [PubMed] [Google Scholar]
  9. de la Rosa-Trevín JM, Quintana A, Del Cano L, Zaldívar A, Foche I, Gutiérrez J, Gómez-Blanco J, Burguet-Castell J, Cuenca-Alba J, Abrishami V, Vargas J, Otón J, Sharov G, Vilas JL, Navas J, Conesa P, Kazemi M, Marabini R, Sorzano CO, Carazo JM. Scipion: a software framework toward integration, reproducibility and validation in 3D Electron microscopy. Journal of Structural Biology. 2016;195:93–99. doi: 10.1016/j.jsb.2016.04.010. [DOI] [PubMed] [Google Scholar]
  10. Emsley P, Cowtan K. Coot: model-building tools for molecular graphics. Acta Crystallographica. Section D, Biological Crystallography. 2004;60:2126–2132. doi: 10.1107/S0907444904019158. [DOI] [PubMed] [Google Scholar]
  11. Engel C, Plitzko J, Cramer P. RNA polymerase I–Rrn3 complex at 4.8 Å resolution. Nature Communications. 2016;7:12129. doi: 10.1038/ncomms12129. [DOI] [PMC free article] [PubMed] [Google Scholar]
  12. Engel C, Sainsbury S, Cheung AC, Kostrewa D, Cramer P. RNA polymerase I structure and transcription regulation. Nature. 2013;502:650–655. doi: 10.1038/nature12712. [DOI] [PubMed] [Google Scholar]
  13. Fath S, Milkereit P, Peyroche G, Riva M, Carles C, Tschochner H. Differential roles of phosphorylation in the formation of transcriptional active RNA polymerase I. PNAS. 2001;98:14334–14339. doi: 10.1073/pnas.231181398. [DOI] [PMC free article] [PubMed] [Google Scholar]
  14. Fernández-Tornero C, Moreno-Morcillo M, Rashid UJ, Taylor NM, Ruiz FM, Gruene T, Legrand P, Steuerwald U, Müller CW. Crystal structure of the 14-subunit RNA polymerase I. Nature. 2013;502:644–649. doi: 10.1038/nature12636. [DOI] [PubMed] [Google Scholar]
  15. Gallego O, Specht T, Brach T, Kumar A, Gavin AC, Kaksonen M. Detection and characterization of protein interactions in vivo by a simple live-cell imaging method. PLoS One. 2013;8:e62195. doi: 10.1371/journal.pone.0062195. [DOI] [PMC free article] [PubMed] [Google Scholar]
  16. García A, Rosonina E, Manley JL, Calvo O. Sub1 globally regulates RNA polymerase II C-terminal domain phosphorylation. Molecular and Cellular Biology. 2010;30:5180–5193. doi: 10.1128/MCB.00819-10. [DOI] [PMC free article] [PubMed] [Google Scholar]
  17. Gerber J, Reiter A, Steinbauer R, Jakob S, Kuhn CD, Cramer P, Griesenbeck J, Milkereit P, Tschochner H. Site specific phosphorylation of yeast RNA polymerase I. Nucleic Acids Research. 2008;36:793–802. doi: 10.1093/nar/gkm1093. [DOI] [PMC free article] [PubMed] [Google Scholar]
  18. Hannan RD, Cavanaugh A, Hempel WM, Moss T, Rothblum L. Identification of a mammalian RNA polymerase I holoenzyme containing components of the DNA repair/replication system. Nucleic Acids Research. 1999;27:3720–3727. doi: 10.1093/nar/27.18.3720. [DOI] [PMC free article] [PubMed] [Google Scholar]
  19. Helliwell SB, Wagner P, Kunz J, Deuter-Reinhard M, Henriquez R, Hall MN. TOR1 and TOR2 are structurally and functionally similar but not identical phosphatidylinositol kinase homologues in yeast. Molecular Biology of the Cell. 1994;5:105–118. doi: 10.1091/mbc.5.1.105. [DOI] [PMC free article] [PubMed] [Google Scholar]
  20. Hirata A, Klein BJ, Murakami KS. The X-ray crystal structure of RNA polymerase from Archaea. Nature. 2008;451:851–854. doi: 10.1038/nature06530. [DOI] [PMC free article] [PubMed] [Google Scholar]
  21. Imazawa Y, Hisatake K, Mitsuzawa H, Matsumoto M, Tsukui T, Nakagawa K, Nakadai T, Shimada M, Ishihama A, Nogi Y. The fission yeast protein Ker1p is an ortholog of RNA polymerase I subunit A14 in Saccharomyces cerevisiae and is required for stable association of Rrn3p and RPA21 in RNA polymerase I. Journal of Biological Chemistry. 2005;280:11467–11474. doi: 10.1074/jbc.M411150200. [DOI] [PubMed] [Google Scholar]
  22. Keener J, Josaitis CA, Dodd JA, Nomura M. Reconstitution of yeast RNA polymerase I transcription in vitro from purified components. TATA-binding protein is not required for basal transcription. Journal of Biological Chemistry. 1998;273:33795–33802. doi: 10.1074/jbc.273.50.33795. [DOI] [PubMed] [Google Scholar]
  23. Kim YJ, Björklund S, Li Y, Sayre MH, Kornberg RD. A multiprotein mediator of transcriptional activation and its interaction with the C-terminal repeat domain of RNA polymerase II. Cell. 1994;77:599–608. doi: 10.1016/0092-8674(94)90221-6. [DOI] [PubMed] [Google Scholar]
  24. Kuhn CD, Geiger SR, Baumli S, Gartmann M, Gerber J, Jennebach S, Mielke T, Tschochner H, Beckmann R, Cramer P. Functional architecture of RNA polymerase I. Cell. 2007;131:1260–1272. doi: 10.1016/j.cell.2007.10.051. [DOI] [PubMed] [Google Scholar]
  25. Laferté A, Favry E, Sentenac A, Riva M, Carles C, Chédin S. The transcriptional activity of RNA polymerase I is a key determinant for the level of all ribosome components. Genes & Development. 2006;20:2030–2040. doi: 10.1101/gad.386106. [DOI] [PMC free article] [PubMed] [Google Scholar]
  26. Loibl M, Klein I, Prattes M, Schmidt C, Kappel L, Zisser G, Gungl A, Krieger E, Pertschy B, Bergler H. The drug diazaborine blocks ribosome biogenesis by inhibiting the AAA-ATPase Drg1. Journal of Biological Chemistry. 2014;289:3913–3922. doi: 10.1074/jbc.M113.536110. [DOI] [PMC free article] [PubMed] [Google Scholar]
  27. Mayer C, Zhao J, Yuan X, Grummt I. mTOR-dependent activation of the transcription factor TIF-IA links rRNA synthesis to nutrient availability. Genes & Development. 2004;18:423–434. doi: 10.1101/gad.285504. [DOI] [PMC free article] [PubMed] [Google Scholar]
  28. Mechold U, Potrykus K, Murphy H, Murakami KS, Cashel M. Differential regulation by ppGpp versus pppGpp in Escherichia coli. Nucleic Acids Research. 2013;41:6175–6189. doi: 10.1093/nar/gkt302. [DOI] [PMC free article] [PubMed] [Google Scholar]
  29. Milkereit P, Schultz P, Tschochner H. Resolution of RNA polymerase I into dimers and monomers and their function in transcription. Biological Chemistry. 1997;378:1433–1443. doi: 10.1515/bchm.1997.378.12.1433. [DOI] [PubMed] [Google Scholar]
  30. Milkereit P, Tschochner H. A specialized form of RNA polymerase I, essential for initiation and growth-dependent regulation of rRNA synthesis, is disrupted during transcription. The EMBO Journal. 1998;17:3692–3703. doi: 10.1093/emboj/17.13.3692. [DOI] [PMC free article] [PubMed] [Google Scholar]
  31. Mindell JA, Grigorieff N. Accurate determination of local defocus and specimen tilt in Electron microscopy. Journal of Structural Biology. 2003;142:334–347. doi: 10.1016/S1047-8477(03)00069-8. [DOI] [PubMed] [Google Scholar]
  32. Moorefield B, Greene EA, Reeder RH. RNA polymerase I transcription factor Rrn3 is functionally conserved between yeast and human. PNAS. 2000;97:4724–4729. doi: 10.1073/pnas.080063997. [DOI] [PMC free article] [PubMed] [Google Scholar]
  33. Moreno-Morcillo M, Taylor NM, Gruene T, Legrand P, Rashid UJ, Ruiz FM, Steuerwald U, Müller CW, Fernández-Tornero C. Solving the RNA polymerase I structural puzzle. Acta Crystallographica Biological Crystallography. 2014;70:2570–2582. doi: 10.1107/S1399004714015788. [DOI] [PMC free article] [PubMed] [Google Scholar]
  34. Moss T, Langlois F, Gagnon-Kugler T, Stefanovsky V. A housekeeper with power of attorney: the rRNA genes in ribosome biogenesis. Cellular and Molecular Life Sciences. 2007;64:29–49. doi: 10.1007/s00018-006-6278-1. [DOI] [PMC free article] [PubMed] [Google Scholar]
  35. Murakami KS, Masuda S, Campbell EA, Muzzin O, Darst SA. Structural basis of transcription initiation: an RNA polymerase holoenzyme-DNA complex. Science. 2002;296:1285–1290. doi: 10.1126/science.1069595. [DOI] [PubMed] [Google Scholar]
  36. Neyer S, Kunz M, Geiss C, Hantsche M, Hodirnau V-V, Seybert A, Engel C, Scheffer MP, Cramer P, Frangakis AS. Structure of RNA polymerase I transcribing ribosomal DNA genes. Nature. 2016;540:607–610. doi: 10.1038/nature20561. [DOI] [PubMed] [Google Scholar]
  37. Pettersen EF, Goddard TD, Huang CC, Couch GS, Greenblatt DM, Meng EC, Ferrin TE. UCSF chimera--a visualization system for exploratory research and analysis. Journal of Computational Chemistry. 2004;25:1605–1612. doi: 10.1002/jcc.20084. [DOI] [PubMed] [Google Scholar]
  38. Peyroche G, Milkereit P, Bischler N, Tschochner H, Schultz P, Sentenac A, Carles C, Riva M. The recruitment of RNA polymerase I on rDNA is mediated by the interaction of the A43 subunit with Rrn3. The EMBO Journal. 2000;19:5473–5482. doi: 10.1093/emboj/19.20.5473. [DOI] [PMC free article] [PubMed] [Google Scholar]
  39. Philippi A, Steinbauer R, Reiter A, Fath S, Leger-Silvestre I, Milkereit P, Griesenbeck J, Tschochner H. TOR-dependent reduction in the expression level of Rrn3p lowers the activity of the yeast RNA pol I machinery, but does not account for the strong inhibition of rRNA production. Nucleic Acids Research. 2010;38:5315–5326. doi: 10.1093/nar/gkq264. [DOI] [PMC free article] [PubMed] [Google Scholar]
  40. Picco A, Irastorza-Azcarate I, Specht T, Böke D, Pazos I, Rivier-Cordey AS, Devos DP, Kaksonen M, Gallego O. The in Vivo Architecture of the Exocyst Provides Structural Basis for Exocytosis. Cell. 2017;168:400–412. doi: 10.1016/j.cell.2017.01.004. [DOI] [PubMed] [Google Scholar]
  41. Pilsl M, Crucifix C, Papai G, Krupp F, Steinbauer R, Griesenbeck J, Milkereit P, Tschochner H, Schultz P. Structure of the initiation-competent RNA polymerase I and its implication for transcription. Nature Communications. 2016;7:12126. doi: 10.1038/ncomms12126. [DOI] [PMC free article] [PubMed] [Google Scholar]
  42. Plaschka C, Larivière L, Wenzeck L, Seizl M, Hemann M, Tegunov D, Petrotchenko EV, Borchers CH, Baumeister W, Herzog F, Villa E, Cramer P. Architecture of the RNA polymerase II-Mediator core initiation complex. Nature. 2015;518:376–380. doi: 10.1038/nature14229. [DOI] [PubMed] [Google Scholar]
  43. Rothblum K, Hu Q, Penrod Y, Rothblum LI. Selective inhibition of rDNA transcription by a small-molecule peptide that targets the interface between RNA polymerase I and Rrn3. Molecular Cancer Research. 2014;12:1586–1596. doi: 10.1158/1541-7786.MCR-14-0229. [DOI] [PMC free article] [PubMed] [Google Scholar]
  44. Scheres SH, Núñez-Ramírez R, Sorzano CO, Carazo JM, Marabini R. Image processing for Electron microscopy single-particle analysis using XMIPP. Nature Protocols. 2008;3:977–990. doi: 10.1038/nprot.2008.62. [DOI] [PMC free article] [PubMed] [Google Scholar]
  45. Scheres SH. RELION: implementation of a Bayesian approach to cryo-EM structure determination. Journal of Structural Biology. 2012;180:519–530. doi: 10.1016/j.jsb.2012.09.006. [DOI] [PMC free article] [PubMed] [Google Scholar]
  46. Schnapp A, Schnapp G, Erny B, Grummt I. Function of the growth-regulated transcription initiation factor TIF-IA in initiation complex formation at the murine ribosomal gene promoter. Molecular and Cellular Biology. 1993;13:6723–6732. doi: 10.1128/MCB.13.11.6723. [DOI] [PMC free article] [PubMed] [Google Scholar]
  47. Stepanchick A, Zhi H, Cavanaugh AH, Rothblum K, Schneider DA, Rothblum LI. DNA binding by the ribosomal DNA transcription factor rrn3 is essential for ribosomal DNA transcription. Journal of Biological Chemistry. 2013;288:9135–9144. doi: 10.1074/jbc.M112.444265. [DOI] [PMC free article] [PubMed] [Google Scholar]
  48. Tafur L, Sadian Y, Hoffmann NA, Jakobi AJ, Wetzel R, Hagen WJ, Sachse C, Müller CW. Molecular structures of transcribing RNA polymerase I. Molecular Cell. 2016;64:1135–1143. doi: 10.1016/j.molcel.2016.11.013. [DOI] [PMC free article] [PubMed] [Google Scholar]
  49. Tang G, Peng L, Baldwin PR, Mann DS, Jiang W, Rees I, Ludtke SJ. EMAN2: an extensible image processing suite for Electron microscopy. Journal of Structural Biology. 2007;157:38–46. doi: 10.1016/j.jsb.2006.05.009. [DOI] [PubMed] [Google Scholar]
  50. Travers AA. Promoter sequence for stringent control of bacterial ribonucleic acid synthesis. Journal of Bacteriology. 1980;141:973–976. doi: 10.1128/jb.141.2.973-976.1980. [DOI] [PMC free article] [PubMed] [Google Scholar]
  51. Vannini A, Cramer P. Conservation between the RNA polymerase I, II, and III transcription initiation machineries. Molecular Cell. 2012;45:439–446. doi: 10.1016/j.molcel.2012.01.023. [DOI] [PubMed] [Google Scholar]
  52. Warner JR. The economics of ribosome biosynthesis in yeast. Trends in Biochemical Sciences. 1999;24:437–440. doi: 10.1016/S0968-0004(99)01460-7. [DOI] [PubMed] [Google Scholar]
  53. Yamamoto RT, Nogi Y, Dodd JA, Nomura M. RRN3 gene of Saccharomyces cerevisiae encodes an essential RNA polymerase I transcription factor which interacts with the polymerase independently of DNA template. The EMBO Journal. 1996;15:3964–3973. [PMC free article] [PubMed] [Google Scholar]
  54. Zuo Y, Wang Y, Steitz TA. The mechanism of E. coli RNA polymerase regulation by ppGpp is suggested by the structure of their complex. Molecular Cell. 2013;50:430–436. doi: 10.1016/j.molcel.2013.03.020. [DOI] [PMC free article] [PubMed] [Google Scholar]
eLife. 2017 Mar 6;6:e20832. doi: 10.7554/eLife.20832.029

Decision letter

Editor: Alan G Hinnebusch1

In the interests of transparency, eLife includes the editorial decision letter and accompanying author responses. A lightly edited version of the letter sent to the authors after peer review is shown, indicating the most substantive concerns; minor comments are not usually included.

Thank you for submitting your article "The dynamic balance between RNA polymerase I complexes regulates rDNA transcriptional activation" for consideration by eLife. Your article has been favorably evaluated by Kevin Struhl (Senior Editor) and three reviewers, one of whom, Alan G Hinnebusch (Reviewer #1), is a member of our Board of Reviewing Editors. The following individuals involved in review of your submission have agreed to reveal their identity:.

The reviewers have discussed the reviews with one another and the Reviewing Editor has drafted this decision to help you prepare a revised submission.

Summary:

In this paper, the authors study the down-regulation of Pol I activity by nutrient starvation, focusing on the roles of Pol I homodimerization and dissociation of the activated complex formed with cofactor Rrn3 as possible mechanisms that diminish recruitment of the Pol I:Rrn3 complex to the RDN promoter. Introducing an improvement in the PICT assay, they provide the first evidence that Pol I forms homodimers in cells, in a manner that depends on nutrient starvation or inhibition of either translation or ribosome biogenesis using drugs. The dimerization requires the C-terminal domain of subunit A43, implicated in dimerization by the previous crystal structure of a Pol I dimer. They could also use the PICT assay to monitor Pol I:Rrn3 complex levels and show that these are down-regulated in starved cells, although not to the same extent as promoter occupancy of these proteins measured by ChIP. They examine the kinetics of formation/dissociation of the Pol I dimer and Pol I:Rrn3 complexes by PICT in the transition from growth to starvation and back to growth, which are complex and multiphasic and show that at least to some extent the two processes are not tightly coupled in time. They then switch gears and present two cryo-EM structures, a Pol I::Rrn3 complex at 7.7 Å resolution, which appears similar in most important respects to a higher resolution structure (4.8 Å) of the same complex recently published by another group; and a Pol I monomer at 4.9 Å, of higher resolution than one also published this year. Comparison of their Pol I monomer to the crystallized dimer gives some insights into the transition from the presumably inactive dimer to active monomer, but these transitions were either not dramatic or were not well explained in the text/figures. The Pol I:Rrn3 complex is highly relevant to Pol I activation and they go on to perform a limited structure-function analysis of this interaction, showing that it is impaired if the A14 subunit (which interacts extensively with Rrn3) is simply deleted from Pol I. The Pol I:Rrn3 complex assembly and recruitment are either diminished or enhanced if the unstructured C-terminal tail of A43 is removed or the internal unstructured "TA-loop" of A14 is removed, respectively. The effect of deleting A14 entirely could be indirect, as it also interacts extensively with A43; and the opposing effects of deleting A43-CTT or A14 TA-loop, while interesting, are difficult to rationalize because they are unstructured segments that don't make known contacts with Rrn3.

Essential revisions:

The consensus of the reviewers is that the structural information in the second half of the paper is valuable, even if mostly confirmatory of other recently published structures, as are the structure-function studies, even if somewhat limited in scope. However, the structural insights into the transition from presumably inactive dimer to active monomer gleaned from the structures were either not dramatic or not well explained in the text/figures and should be highlighted better. In addition, the possible effects of the A14 subunit deletion on Pol I integrity and abundance would have to be examined.

Regarding the results obtained using the PICT assay in the first part of the paper, there are important concerns about whether the results are sufficient to conclude, as the title of the paper implies, that formation/disassembly of the homodimer versus Pol I-Rrn3 complexes are important events regulating rDNA transcription in response to nutrient availability. All three reviewers had difficulty understanding how the PICT results have been quantified; Rev. #2 had the most serious concerns, and has explained the difficulties thoroughly in his/her review. The large halo of background GFP signal compared to the small amount associated with the tethered RFP makes quantification of the co-localizing PICT signal highly questionable; and the images in Figures 1 and 2 raise doubts about whether the degree of co-localization of the anchor and Pol I-GFP signals can be reliably measured. The PICT homodimerization data seem to indicate that only a small fraction of the Pol I exists in homodimers, and the Pol-Rrn3 PICT data indicate only a modest reduction in this complex (which might merely reflect reduced Rrn3 abundance) despite a strong loss of Rrn3/Pol I occupancy of the RDN promoter measured by ChIP. The analysis of the kinetics of forming/dissociating these complexes by PICT do not indicate tight coordination of Pol-Rrn3 dissociation and homodimer formation, and provide no evidence that homodimerization is driving dissociation of Pol I-Rrn3 complexes. The rates of forming/dissociating these complexes measured by PICT are quite slow and have not been compared to the rates of Rrn3/Pol I association/dissociation from the promoter measured by ChIP. As such, formation/dissociation of these protein complexes may be secondary to the key events that regulate promoter occupancy at much higher rates. In addition, the conclusions that inactive ribosomes trigger Pol I dimerization are not substantiated by the data and represent an overinterpretation of the data. Thus, while the PICT assay might be providing evidence for Pol I dimerization in cells that is triggered by nutrient starvation, provided the criticisms raised by Rev. #2 can be satisfied, it is unclear that dimerization is extensive enough and occurs with the proper kinetics to represent an important mechanism for down-regulating Pol I function, as opposed to a secondary event that might simply protect idle Pol I molecules from degradation. One way to support your claim would be to construct a mutation in the A43-CTT that specifically impairs homodimerization and show that this mutation abolishes homodimerization by PICT and also dampens loss of Pol 1:Rrn3 promoter complexes in starved cells measured by ChIP.

Specific recommendations:

1) It would be very helpful if they had an independent assay(s) for dimerization. Two choices. First, they could formaldehyde crosslink under the various in vivo situation and do a co-IP with essentially the same constructs they already have. Second, they could replace the targeting tags with Gal4, which would allow Gal4-Pol I fusions to targeted to Gal4 binding sites (assayed by ChIP). If the model is correct, one should see the non-Gal4 version of Pol I associating with Gal4 binding sites under starvation. Both of these approaches might be better for kinetics and quantification, but the real virtue of them is that they are independent assays for dimerization.

2) The authors haven't demonstrated "regulation", so their title needs to be softened. What they have "shown" is that the dimerization and change in complexes is associated with regulation.

Reviewer #1:

Summary of work:

In this paper, the authors study the down-regulation of Pol I activity by nutrient starvation, focusing on the roles of Pol I homodimerization and dissociation of the activated complex formed with cofactor Rrn3 as possible mechanisms that diminish recruitment of the Pol I:Rrn3 complex to the RDN promoter. Introducing an improvement in the PICT assay, they provide the first evidence that Pol I forms homodimers in cells, in a manner that depends on nutrient starvation or inhibition of either translation or ribosome biogenesis using drugs. The dimerization requires the C-terminal domain of subunit A43, implicated in dimerization by the previous crystal structure of a Pol I dimer. They could also use the PICT assay to monitor Pol I:Rrrn3 complex levels and show that these are down-regulated in starved cells, although not to the same extent as promoter occupancy of these proteins measured by ChIP. They examine the kinetics of formation/dissociation of the Pol I dimer and Pol I:Rrn3 complexes by PICT in the transition from growth to starvation and back to growth, which are complex and multiphasic and show that at least to some extent the two processes are not tightly coupled in time. They then switch gears and present two cryo-EM structures, a Pol I::Rrn3 complex at 7.7 Å resolution, which appears to be similar in all important respects to a higher resolution structure (4.8 Å) of the same complex recently published by another group; and a Pol I monomer at 4.9 Å, of higher resolution than one also published this year. Comparison of their Pol I monomer to the crystallized dimer gives some insights into the transition from the presumably inactive dimer to active monomer, but these transitions were either not dramatic or were not well explained in the text/figures. The Pol I:Rrn3 complex is highly relevant to Pol I activation and they go on to perform a limited structure-function analysis of this interaction, showing that it is impaired if the A14 subunit (which interacts extensively with Rrn3) is simply deleted from Pol I. the Pol I:Rrn3 complex assembly and recruitment are either diminished or enhanced if the unstructured C-terminal tail of A43 is removed or the internal unstructured "TA-loop" of A14 is removed, respectively. The effect of deleting A14 entirely could be indirect, as it also interacts extensively with A43, and the opposing effects of deleting A43-CTT or A14 TA-loop, while interesting, are difficult to rationalize because they are unstructured segments that don't make known contacts with Rrn3. Unfortunately, they did not make any "surgical" alterations to A14 or A43 at points of direct contact with Rrn3 in an attempt to validate the physiological relevance of the cryoEM structure for understanding assembly of the Pol I:Rrn3 complex.

General critique:

Previous work on Pol I in yeast has shown that Rrn3 binding to the enzyme is required for Pol I recruitment to the promoter, and that Pol I can form homodimers in solution and was crystallized as a homodimer with structural features indicating an inactive conformation. This paper uses the PICT assay to provide convincing evidence that Pol I homodimers can form in cells, but only in stress conditions including starvation for carbon and nitrogen, arrest of translation elongation by cycloheximide, or treatment with a drug shown to impair ribosome biogenesis. The evidence that homodimerization occurs in cells is firm, and the fact that it was observed only in starved/stressed cells supports its role as a regulatory mechanism for inactivation of Pol I under conditions where new ribosome synthesis is unwanted. Unfortunately, however, there is no direct evidence establishing its importance in down-regulating Pol I function. In fact, the kinetics of homodimerization versus PolI:Rrn3 interaction shown in Figure 4 reveal that the initial, and most rapid phase of dissociation of Pol I:Rrn3 on the shift from growth to starvation precedes any appreciable formation of Pol I dimers, and hence, is clearly not being driven, at least initially, by dimerization. What is needed in my view is a mutation that specifically impairs homodimerization, such as in the A43-CTT, and to show that this mutation would dampen the loss of Pol 1:Rrn3 complexes from promoter DNA in starved cells, thereby showing that dimerization is an important component of the down-regulation of Pol I recruitment/transcription. Unfortunately, the mutation they examined that simply deletes the entire A43-CT has the complication of also, inexplicably, impairing Pol I:Rrn3 interaction and promoter recruitment. Thus, a more surgical mutational approach would be needed to achieve this important goal.

The PICT assay also gives evidence of reduced Pol I:Rrn3 association in starved cells by ~50%, and there is an even greater reduction in Pol I/Rrn3 occupancy of the Pol I promoter measured by ChIP. However, the Western in Figure 1—figure supplement 2 shows reduced Rrn3 abundance that could be as much as 50%, which would lead to a different and less interesting interpretation of the PICT data, with no evidence for a weaker Pol I:Rrn3 association occurring in starved cells.

The cryo-EM analysis of the Pol I monomer at 4.9 Å resolution and the Pol I::Rrn3 complex at 7.7 Å resolution are valuable, although another group recently published a Pol I-Rrn3 complex at higher resolution (4.9 Å) that seems to contain all of the same key features and allows the same insights into this important intermediate in Pol I activation as those described here-thus diminishing the significance of the current structure of the complex. The higher resolution of their monomeric Pol I compared to that recently published by another group, should allow a superior comparison between the monomeric and dimer Pol I (from the crystal structure), from which they conclude that the transition from dimer to monomer "involves partial cleft closure and increased flexibility of critical motifs". However, the relevant figure (Figure 5C) does not make a convincing case for the cleft closure in the monomer, and the accompanying text (subsection “Cryo-EM structures of monomeric Pol I alone and in complex with Rrn3”) did not help much to convince me. In addition, it seems possible that the critical motifs are flexible in both the monomer and dimer but were fixed in the dimer by crystal contacts.

The experiments showing that deleting the A14 subunit weakens Pol I:Rrn3 interaction by PICT assay and reduces Pol I/Rrrn3 occupancy at the promoter by ChIP assay are valuable, but they have not ruled out the possibility that removing this subunit perturbs other Pol I subunits, e.g. A43 with which it seems to interact with extensively, and thus impairs Pol I interaction with Rrn3 indirectly by disrupting A43:Rrn3 contacts rather than eliminating the A14:Rrn3 interactions evident in the cryoEM structure. It is even possible that the steady state level of Pol I is reduced by the A14 deletion and contributes to the reduced yield of Pol I:Rrn3 interactions and Pol I recruitment. Thus, the effects of the A14 subunit deletion on Pol I integrity and abundance should have been examined. But even more importantly, the authors should have used the molecular details of the cryoEM structure to more surgically disrupt the A14:Rrn3 interaction by truncating or substituting helix 2 of A14 in a way designed not to disrupt A14 interactions with other Pol I subunits. This seems like a missed opportunity to exploit their structure.

In summary, the paper represents a collection of three different lines of work joined by the theme of regulating Pol I:Rrn3 interaction. The evidence for homodimer formation in cells is interesting and valuable but it is unclear that it constitutes an important means of impeding Pol I:Rrn3 association and promoter recruitment rather than being a byproduct of the loss of this complex by other means that serves only to protect Pol I from degradation. The cryoEM structures are valuable, but a Pol I:Rrn3 complex of higher resolution was already published. The structure-function analysis of A43 and A14 did not exploit the cryoEM structure, as it involved deletions of large segments that are not present at their interfaces with Rrn3. The result that deleting the TA loop in A14 leads to greater Pol I:Rrn3 association and promoter occupancy is the most interesting finding, but the molecular mechanism is not obvious from the structure. Taken together, the paper is not a strong candidate for eLife, even if the authors can address all of the shortcomings in the experiments and interpretations mentioned above or below.

Other major criticisms:

The PICT approach requires Rapamycin, which is known to impair ribosome biogenesis. It's unclear from the genotypes provided whether both alleles of TOR1 in the diploid strains they used are the tor1-1 allele conferring resistance to Rap, which would seem to be required. Even if this is so, it seems important to show directly, if it's not in the literature already, that treatment of their PICT strain with rapamycin has no effect on Pol I recruitment or 35S pre-rRNA synthesis.

Figure 4: the very long time scale involved in the appearance or disappearance of the Pol I homodimers and Pol I:Rrn3 complexes raises the question of how important either one might be to regulating Pol I/Rrn3 occupancy of promoters, which might occur much more rapidly than either of these protein assembly reactions. It seems important to conduct ChIP experiments in the same regimen to determine how quickly promoter association is lost or regained in the transitions between growth and starvation – it might go to completion within a few minutes, which would be highly relevant to their interpretations.

It should be stipulated that the model in Figure 7 assumes that all of the Pol I is dimerized in starved cells, whereas the PICT assay only says that some detectable level of dimerization can be detected in starved cells without indicating the proportion of Pol I in this state. At this stage of their knowledge, it would be more prudent to depict a mixture of Pol I dimers and monomers present in starved cells with Pol I:Rrn3 complex assembly proceeding either from pre-existing monomers or following dissociation of dimers. This would make it easier to understand the multi-phase kinetics of Pol I:Rrn3 assembly and also take into account the fact that cycloheximide treatment of starved cells evokes even higher levels of dimer formation than starvation alone (implying that not all of the Pol I is dimerized in starved cells).

Reviewer #2:

The manuscript has two distinct parts, the first to study the in vivo formation of the inactive PolI dimer and its role in nutrient regulation of transcription in yeast, the second to present 4.9A Cryo-EM structures of yeast PolI and the PolI-Rrn3 complex. This reviewer does not feel competent to judge the validity or significance of these structures and so I will limit my review to the data on PolI dimer formation as a regulatory mechanism, Figures 14.

The authors use an adaption technique called PICT (Protein interactions from Imaging of Complexes after Translocation) that uses the ability of Rapamycin to mediate an interaction between FKBP and FRB. In this adaption of PICT, FKBP is fused to Tub4 and RFP, and FRB to the large subunit of PolI. Addition of rapamycin then causes FRB-PolI to be recruited to the RFP tagged spindle poles. The authors then study the co-localization of a GFP-PolI fusion with the RFP tag as a measure of PolI dimerization in rapid growth in rich medium and after nutrient withdrawal. Similarly, and Rrn3-GFP fusion is used to study the formation of the active PolI-Rrn3 complex. A rapamycin resistant yeast strain is used to avoid the known effects of this drug on the Tor pathway.

The technical approach is interesting and still novel. The question of whether or not an inactive PolI dimer forms in vivo and plays a part in regulation of the ribosomal RNA genes is an important one. This said, I found the data inadequate to support the key claims that nutrient deprivation or drug induced inhibition of protein synthesis or ribosome assembly leads to a significant accumulation of inactive PolI dimers and that could be reversed by refeeding or drug withdrawal.

Already from Figure 1 I found it very difficult convince myself that there was true co-localization of GFP and RFP and hence PolI dimer formation in the starved wt/wt situation. At best only a very small fraction of the GFP signal colocalizes with the RFP anchor, but a halo of GFP also forms around the anchor site (Figure 1B). Why this halo forms is not discussed, and since no marker of the nuclear space is provided it is also very unclear what is being observed. The GFP halo around the RFP signal, very prominent in both wt/wt and A43ΔCt/A43ΔCt but present in most images throughout the manuscript, appears to make even a rough estimate of RFP-GFP co-localization near impossible. The quantitation protocol used (Materials and methods) makes no attempt to take this GFP halo into account as a (non co-localizing) background fluorescence. The problem is clearly demonstrated in Figure 1—figure supplement 1B, where the background level of GFP even in these test examples is at least as large and often many times the co-localizing signal. Given this, not only is the quantification of the co-localizing PICT signal highly questionable, but it would be essential to demonstrate the degree to which the GFP signal is detected in the RFP optical channel, even a small overlap would give a very significant PICT signal.

The same problems occur in Figure 2, and again here the lack of definition of the nuclear volume and the varying distances between the anchor points suggest yet a further complication that each image represents a different cell cycle stage. The images shown in Figures 1 and 2 do not convince me that it is possible to estimate in any reliable way the degree of co-localization of the anchor and PolI-GFP signals and in Figure 2A even the authors' quantitations for +- cycloheximide are well within the estimated errors. Also, the authors provide no quantitation of Diazaborine effects, nor a control to demonstrate that non-functional ribosomes actually form in their experiment as they claim. The title of this section "Non-functional ribosomes trigger Pol I homodimerization" is clearly not supported by the data.

For these reasons, it is my opinion that the data do not convincingly demonstrate PolI dimerization in vivo or that it is modulated on nutrient deprivation, transcription inactivation or inhibition of protein synthesis.

The evidence for an in vivo interaction between PolI and Rrn3 in Figure 3 is much more convincing. Here a co-localization is evident between the Rrn3-GFP and the anchored PolI-associated RFP signals. But the images do not convincingly show a reduction on nutrient starvation, and here again the GFP halo makes quantitation very uncertain. Further, the ChIP measurement of PolI and Rrn3 recruitment at the gene promoter reduces by over 80% in starved cells (Figure 3C) and is not consistent with the only 50% reduction in PolI-Rrn3 estimated by PICT. (To be reliable the ChIP data should be extended to other amplicons both within and outside of the 35S transcribed region to show that the reduction in promoter signal is not due to chromatin accessibility changes after nutrient depletion, etc.) As is, the data provided suggest that the reduction in transcription on nutrient withdrawal is not due either to dissociation of the PolI-Rrn3 complex or the formation of inactive PolI dimers.

The time course data in Figure 4 is potentially interesting, but again is based on a techniques and quantitation regime that are wholly inadequate. Even if we accept that the data do in fact reflect in vivo changes, we have no idea what the relative signals mean in terms of the fraction of PolI in the different complexes. The PolI dimer signal might be rising on nutrient withdrawal and falling on refeeding, but we have no idea how much of PolI is undergoing this change. This is particularly clear from the refeeding data, where dimers appear to be rapidly eliminated, but PolI-Rrn3 complexes hardly increase over the same time period.

In short, the questions are interesting, the technique fascinating, but the data do not support the claims and interpretations.

Reviewer #3:

It's been known for quite a while that the Rrn3 transcription factor is needed for RNA Polymerase I activity. Several very recent papers, including this one, have shown that the structure of Rrn3 bound to Pol I appears mutually exclusive with dimerization of Pol I. This report goes beyond to the recent Nature Communications papers from Cramer and Schultz in providing in vivo evidence for this model of regulation. Using an improved fluorescent co-localization protocol (PICT), Pol I homodimers and Rrn3-Pol I heterodimers can be assayed under various conditions. Several treatments known to repress ribosomal transcription or to inhibit translation result in a shift from heterodimers to Pol I homodimers. Overall, I think this is an interesting and important paper that would be appropriate for eLife.

Specific comments:

For the PICT results, it's sometimes not clear how the individual cell panels illustrate the numbers shown in the bar graphs. For example, in Figure 1, why is the δ 43 heterozygote nearly WT on the bar graph, while the homozygote is zero? The pictures make it look like it should be the other way around. Please clarify exactly what the bar graphs are showing: simple overlap of peaks in two dimensions, or some 3D measurement? Perhaps more pictures would help.

In the last paragraph of the subsection “Dynamics in the assembly of Pol I complexes in response to nutrient availability”, the paper states that in the second stage after addition of nutrients, the pol I homodimers disappear, but with no increase in the Rrn3/pol I complex. Where do those polymerase molecules go, if not into the Rrn3 complex?

I like the idea in final paragraph of the Discussion, which draws parallels between the Rrn3-pol I and Mediator – pol II interactions. However, use of the word "holoenzyme" in the pol II system has been very messy and I would avoid it. To my mind, a holoenzyme should have all the activities needed for promoter recognition and transcription initiation. There were some early papers proposing a pre-assembled holoenzyme of pol II with all the general transcription factors, but those models haven't held up. Later papers started misusing holoenzyme to mean the Mediator – pol II complex. For similar reasons, I don't think Rrn3-pol I would qualify as a holoenzyme. I would avoid the word altogether so as not to distract from the concept that factor interactions with the stalk and surrounding regions might help bring RNA polymerases to the promoter.

[Editors' note: further revisions were requested prior to acceptance, as described below.]

Thank you for resubmitting your work entitled "The dynamic assembly of distinct RNA polymerase I complexes modulates rDNA transcription" for further consideration at eLife. Your revised article has been favorably evaluated by Kevin Struhl as the Senior Editor, Alan Hinnebusch as the Reviewing Editor and two reviewers.

The majority of the remaining issues have been raised by the Reviewing editor, as described below:

The authors have substantially improved the manuscript in several respects to address all of the major criticisms. They obtained a new mutation in the A43 CTT that specifically impairs homodimerization without affecting interaction with Rrn3, and showed that this mutation dampened the loss of Pol I:Rrn3 complexes from promoter DNA in starved cells, thereby providing evidence that dimerization is an important component of the down-regulation of Pol I recruitment and transcription. They better explained the partial cleft closure observed in their cryoEM structure of the Pol I monomer. They provided evidence that the A14 deletion does not simply destabilize Pol I as the means of impairing complex formation with Rrn3 and promoter binding of the complex. Importantly, they also added additional mutants that implicate helix 2 of the A14 subunit in Rrn3 association with Pol I, exploiting novel predictions of their Pol I:Rrn3 structure. They have also better explained the quantification of results from the PICT assay. As such, there are no remaining major criticisms that would require any additional experimentation to address.

However, there are two major issues with their description of the results.

First, their description of the new coIP experiment shown in Figure 1—figure supplement 4 is very confusing and incomplete. The only results that are straightforward are shown in lanes 1-2 and 5-6, which provide valuable evidence for Pol I homodimers in the soluble fractions obtained from cross-linked cells when the cells have been starved. In their "Responses to reviewers", they provide a somewhat more complete explanation of the last 3 lanes pertaining to the insoluble cell fractions, but even this doesn't make complete sense, and it was left out of the manuscript/legends completely. A coherent explanation of all of the lanes in Figure 1—figure supplement 4 is required.

Second, in the Discussion: the statement that "initial transcriptional inactivation is mainly driven by Pol I:Rrn3 disassembly." does not seem justified. The experiments in Figure 4A-B clearly show that the bulk of the dissociation of Pol I: Rrn3 from the promoter occurs within the first 20 min at a timepoint where Pol I:Rrn3 complexes are still very abundant and almost no Pol I homodimers have formed. It seems unavoidable that there is another regulatory mechanism apart from dissociation of Pol I:Rrn3 complexes and Pol I homodimerization responsible for the rapid and nearly complete loss of promoter-bound Pol I on starvation. From their statements at several places in the text, it appears that the authors actually agree with this view, but they don't state it directly in the Discussion and it is not depicted in the final model, which could be misleading to the field. The authors are urged to acknowledge more explicating in the Discussion and in their final model that there remains an important gap in knowledge about how the rapid dissociation of the Pol I:Rrn3 complex from the promoter is achieved on starvation.

Reviewer #2:

My major criticisms of the original manuscript concerned the use of the PICT technique and more precisely the analysis of images. The authors have tried to address these concerns, but it is clear that their quantification of Pol1 dimer and Pol1-Rrn3 complex formation is subject to considerable noise. This said, they now provide a detailed quantification protocol and have attempted to better explain the steps used to eliminate problems caused by the very high and variable GFP background signal. They have also improved their ChIP data, clearly validating their ChIP signal for Rrn3.

Given the novelty of the approach and the importance of better understanding Pol1 dimerization and whether or not it has a regulatory role, I feel that on balance the data should now be published.

Reviewer #3:

The revised version of this manuscript does a much better job explaining the PICT assay, and now that I understand how to look at the data I find that the authors have made a persuasive case. These experiments are very important in showing that yeast RNA pol I uses controlled dimerization, in competition with Rrn3 binding, to regulate transcription in response to nutrients and translational status. This work is nicely complemented by some structures that confirm and extend recent work from other groups. I am in favor of publication in eLife.

eLife. 2017 Mar 6;6:e20832. doi: 10.7554/eLife.20832.030

Author response


Essential revisions:

The consensus of the reviewers is that the structural information in the second half of the paper is valuable, even if mostly confirmatory of other recently published structures, as are the structure-function studies, even if somewhat limited in scope. However, the structural insights into the transition from presumably inactive dimer to active monomer gleaned from the structures were either not dramatic or not well explained in the text/figures and should be highlighted better. In addition, the possible effects of the A14 subunit deletion on Pol I integrity and abundance would have to be examined.

We thank the reviewers for the positive comments regarding the scientific value of the structural results. Following the Editor recommendation on the Pol I dimer to monomer structural description, we have included three major changes in our revised version: (i) text revision to more clearly highlight the structural transition, (ii) two additional panels in Figure 5 with zoom views of mobile domains and a schematic representation of the conformational change; and (iii) a new video (Rich Media File 2) to help visualize the conformational rearrangement. This is explained in detail in the response to reviewer 1. Regarding the effects of the A14 subunit deletion on Pol I levels, we performed western-blot analysis with antibodies against several subunits in the complex (A190, A135, A49, A43 and A34.5), and in all cases their levels are identical to those in the wild-type strain.

Regarding the results obtained using the PICT assay in the first part of the paper, there are important concerns about whether the results are sufficient to conclude, as the title of the paper implies, that formation/disassembly of the homodimer versus Pol I-Rrn3 complexes are important events regulating rDNA transcription in response to nutrient availability. All three reviewers had difficulty understanding how the PICT results have been quantified; Rev. #2 had the most serious concerns, and has explained the difficulties thoroughly in his/her review. The large halo of background GFP signal compared to the small amount associated with the tethered RFP makes quantification of the co-localizing PICT signal highly questionable; and the images in Figures 1 and 2 raise doubts about whether the degree of co-localization of the anchor and Pol I-GFP signals can be reliably measured. The PICT homodimerization data seem to indicate that only a small fraction of the Pol I exists in homodimers, and the Pol-Rrn3 PICT data indicate only a modest reduction in this complex (which might merely reflect reduced Rrn3 abundance) despite a strong loss of Rrn3/Pol I occupancy of the RDN promoter measured by ChIP. The analysis of the kinetics of forming/dissociating these complexes by PICT do not indicate tight coordination of Pol-Rrn3 dissociation and homodimer formation, and provide no evidence that homodimerization is driving dissociation of Pol I-Rrn3 complexes. The rates of forming/dissociating these complexes measured by PICT are quite slow and have not been compared to the rates of Rrn3/Pol I association/dissociation from the promoter measured by ChIP. As such, formation/dissociation of these protein complexes may be secondary to the key events that regulate promoter occupancy at much higher rates. In addition, the conclusions that inactive ribosomes trigger Pol I dimerization are not substantiated by the data and represent an overinterpretation of the data. Thus, while the PICT assay might be providing evidence for Pol I dimerization in cells that is triggered by nutrient starvation, provided the criticisms raised by Rev. #2 can be satisfied, it is unclear that dimerization is extensive enough and occurs with the proper kinetics to represent an important mechanism for down-regulating Pol I function, as opposed to a secondary event that might simply protect idle Pol I molecules from degradation. One way to support your claim would be to construct a mutation in the A43-CTT that specifically impairs homodimerization and show that this mutation abolishes homodimerization by PICT and also dampens loss of Pol 1:Rrn3 promoter complexes in starved cells measured by ChIP.

We would like to thank all reviewers for their comments on the PICT assay. We apologize for the lack of information on how the images from PICT assays were analyzed, and for missing figures illustrating this. We have now detailed the procedure in the ‘Materials and methods’ section and also included a clear definition of the recruitment score used to quantify PICT (see comments to reviewers 1 and 2 for a deeper explanation). In addition, we appended a new figure supplement (Figure 1—figure supplement 2) with a step-by-step illustration of the image analysis to detect Pol I homodimerization in starving cells. We agree that quantifying the recruitment to the anchoring platform is not trivial and that the GFP halo around the anchor further complicates this quantification. Nonetheless, our image analysis protocol allows for specific segmentation of the GFP signal recruited to the anchoring platforms, regardless of the background. We agree that images used to illustrate the PICT assays through the manuscript conveyed the false impression that the intensity of the GFP halo varies among the different conditions. The negligible effect of the GFP halo in the detection of Pol I complexes and computation of the recruitment score is extensively discussed in the comments to reviewer 2.

Regarding the influence of complex formation and disruption on rDNA transcriptional regulation, we have performed new experiments that shed light on our interpretation. To support our claim that homodimerization influences Pol I transcription, we designed a new mutant (A43ΔCt, Δ307-326) that specifically abolishes Pol I ability to homodimerize (Figure 1 and 3). Upon starvation, this strain presents higher levels of Pol I and Rrn3 associated to rDNA (Figure 3). Nonetheless, these levels remain lower than in growing cells, indicating that another mechanism also contributes to inactivate Pol I transcription (see specific response to reviewer 1). In addition, we measured promoter association of A190 and Rrn3 along two hours after cells were deprived from nutrients (Figure 4). Our results show that full promoter dissociation occurs with comparable dynamics as Pol I–Rrn3 disassembly, i.e. within 2 hours from starvation. Moreover, we studied the behavior of a chimeric strain where Rrn3 and A43 are covalently fused (Laferte et al., 2006), so that no free monomeric or dimeric Pol I can form. ChIP data show higher association levels of A190 than the wild-type along the entire rDNA gene (Figure 3—figure supplement 2), indicating that, in the absence of Pol I dimers and increased Pol I–Rrn3 levels, rDNA transcription is upregulated in starved cells. The fact that we detect Pol I–Rrn3 complexes in the wild-type strain when promoter association is null (Figure 3 and 4), suggests that Pol I–Rrn3 levels alone are not enough to drive transcription inactivation in starved cells. A TA-loop mutant that specifically increases Pol I–Rrn3 levels without affecting promoter association in starving conditions further supports this. As this mutant also presents unperturbed levels of Pol I dimers, it confirms the observation from time-course PICT that assembly/disassembly of Pol I–Rrn3 does not drive Pol I dimerization. Finally, we have also more accurately interpreted our data on Pol I dimerization upon drug treatment, as explained in detail for reviewer 1. To account for all these results, we modified the main text at different sections (see specific sections in responses to reviewer 1). Moreover, to better express the conclusions of our work, we modified the manuscript title, as also suggested by the Editor (see below).

Specific recommendations:

1) It would be very helpful if they had an independent assay(s) for dimerization. Two choices. First, they could formaldehyde crosslink under the various in vivo situation and do a co-IP with essentially the same constructs they already have. Second, they could replace the targeting tags with Gal4, which would allow Gal4-Pol I fusions to targeted to Gal4 binding sites (assayed by ChIP). If the model is correct, one should see the non-Gal4 version of Pol I associating with Gal4 binding sites under starvation. Both of these approaches might be better for kinetics and quantification, but the real virtue of them is that they are independent assays for dimerization.

We thank the Editor for this useful recommendation. We have performed co-IP experiments after crosslinking on a diploid strain harboring TAP and MYC-tags at the C-termini of each A190 allele. After clarification of whole cell extracts to separate the soluble and chromatin insoluble fractions, we used both fractions to pull down A190-TAP with IgG resin. Thereafter, pulled down proteins were de-crosslinked at 65 ºC for several hours and we analyzed co-IPed A190-MYC by western blot. As shown in Figure 1—figure supplement 4, we could detect Pol I homodimers in the soluble fraction of starved cells, while no dimer could be observed in the same fraction of growing cells. On the opposite, and as expected, we detect A190-MYC in the chromatin fraction in growing conditions, most likely corresponding to tandemly elongating polymerases. We detect tiny amounts of Pol I dimers in the chromatin fraction of starving cells, probably as a result of some protein contamination from the soluble fraction, as suggested by the presence of low levels of Pgk1 in this fraction (panel B), or due to minor amounts of Pol I still attached to DNA after two hours of starvation. DNAse I treatment of the precipitated A190-TAP confirms that detected A190-MYC in starved cells was bound to the DNA. These results have been included in the revised manuscript, as follows:

“In addition, we performed co-immunoprecipitation experiments after crosslinking, using a diploid strain where one A190 allele was tagged with TAP (A190-TAP) and the second with MYC (A190-MYC). Homodimerization could be observed in the soluble fraction of starved cells only (Figure 1—figure supplement 4). Overall, these results indicate that cells induce the formation of Pol I homodimers specifically upon starvation.”

2) The authors haven't demonstrated "regulation", so their title needs to be softened. What they have "shown" is that the dimerization and change in complexes is associated with regulation.

Following the Editor recommendation and in the view of the new experiments, we have now changed the title to “The dynamic assembly of distinct RNA polymerase I complexes modulates rDNA transcription”, which more accurately reflects the significance of our results.

Reviewer #1:

[…] General critique:

Previous work on Pol I in yeast has shown that Rrn3 binding to the enzyme is required for Pol I recruitment to the promoter, and that Pol I can form homodimers in solution and was crystallized as a homodimer with structural features indicating an inactive conformation. This paper uses the PICT assay to provide convincing evidence that Pol I homodimers can form in cells, but only in stress conditions including starvation for carbon and nitrogen, arrest of translation elongation by cycloheximide, or treatment with a drug shown to impair ribosome biogenesis. The evidence that homodimerization occurs in cells is firm, and the fact that it was observed only in starved/stressed cells supports its role as a regulatory mechanism for inactivation of Pol I under conditions where new ribosome synthesis is unwanted. Unfortunately, however, there is no direct evidence establishing its importance in down-regulating Pol I function. In fact, the kinetics of homodimerization versus PolI:Rrn3 interaction shown in Figure 4 reveal that the initial, and most rapid phase of dissociation of Pol I:Rrn3 on the shift from growth to starvation precedes any appreciable formation of Pol I dimers, and hence, is clearly not being driven, at least initially, by dimerization. What is needed in my view is a mutation that specifically impairs homodimerization, such as in the A43-CTT, and to show that this mutation would dampen the loss of Pol 1:Rrn3 complexes from promoter DNA in starved cells, thereby showing that dimerization is an important component of the down-regulation of Pol I recruitment/transcription. Unfortunately, the mutation they examined that simply deletes the entire A43-CT has the complication of also, inexplicably, impairing Pol I:Rrn3 interaction and promoter recruitment. Thus, a more surgical mutational approach would be needed to achieve this important goal.

We thank the reviewer for this useful suggestion. In spite of the challenge, we succeeded in finding a mutant that abolishes homodimerization while maintaining Pol I–Rrn3 levels (A43ΔCt, Δ307-326). When this strain is cultured in starving medium, ChIP experiments show that the promoter levels of Pol I and Rrn3 are higher than in the WT strain. This proves that homodimerization is required for full down-regulation of Pol I recruitment/transcription and improves the significance of our results. To improve simplicity for the reader, we eliminated the former A43ΔCt mutant (Δ277-326) and used the same nomenclature for our more surgical mutant, so that in the revised manuscript A43ΔCt corresponds to A43Δ307-326. The results of this mutant appear at two sections in the revised manuscript:

“Therefore, we studied Pol I dimerization upon partial deletion of this structural element (A43ΔCt, Δ307-326). In this mutant, Pol I homodimerization is impaired (Figure 1B), confirming the observation derived from structural data.”

“To further investigate the effect of starvation on Pol I transcription, we used our A43 C-terminal truncation abolishing Pol I dimerization. […] Furthermore, in these conditions, association of Pol I along the rDNA gene and of Rrn3 at the promoter increase about 6-fold with respect to the wild-type.”

In addition, we studied the behavior of a chimeric strain where A43 is covalently fused to Rrn3 (Laferte et al., 2006), so that all Pol I is complexed to Rrn3 and no free monomeric or dimeric Pol I can form. This strain presents higher association levels of A190 along the entire rDNA gene and recovers faster from starvation than the wild-type. This indicates that, when Pol I dimers cannot form and Pol I–Rrn3 levels are increased, rDNA transcription is upregulated in starving cells. The corresponding manuscript section now reads:

“We also used a strain expressing a Pol I–Rrn3 chimera that cannot form Pol I homodimers (Laferte et al., 2006). […] Moreover, recovery of CARA from nutrient-depleted medium is faster than for wild-type cells (Figure 3—figure supplement 2B).”

The PICT assay also gives evidence of reduced Pol I:Rrn3 association in starved cells by ~50%, and there is an even greater reduction in Pol I/Rrn3 occupancy of the Pol I promoter measured by ChIP. However, the Western in Figure 1—figure supplement 2 shows reduced Rrn3 abundance that could be as much as 50%, which would lead to a different and less interesting interpretation of the PICT data, with no evidence for a weaker Pol I:Rrn3 association occurring in starved cells.

We agree that the PICT technique does not provide evidences about the affinity of the interaction between Pol I and Rrn3, but only about relative levels of the complex. As the reviewer pointed out, the levels of Rrn3 drop upon starvation. This suggests that degradation of Rrn3 might be a mechanism that the cell employs to regulate Pol I–Rrn3 levels during the first stages of starvation. We performed western-blots of Rrn3 and A190 at different time points (Figure 4—figure supplement 1). Although upon starvation the levels of Rrn3 roughly correlate with those of Pol I–Rrn3 as detected by PICT, in the reverse transition the levels of Rrn3 recover steadily while Pol I–Rrn3 levels follow a different dynamic that partially correlates with Pol I homodimer disassembly. Moreover, the A14△TAloop mutant presents higher levels of Pol I–Rrn3 while western-blot shows that Rrn3 levels are unaltered respect to the wild-type. Therefore, Rrn3 degradation might be an important mechanism to regulate Pol I–Rrn3 levels during the first stages upon starvation, but not in cells starved for longer times. Similarly, upon re-feeding, synthesis of fresh Rrn3 likely plays an important role to control Pol I–Rrn3 levels, but this is not sufficient to explain the dynamics observed, which suggest that Pol I homodimers disassembly might also contribute to activate transcription, as supported by the novel A43ΔCt mutant described above. In summary, we conclude that Pol I–Rrn3 levels are an important regulatory mechanism of Pol I activation in growing cells and during the first minutes upon starvation, but in cells starved for longer times they are not sufficient to determine rDNA transcription. This is in agreement with previous observations of rDNA inactivation by inhibition of TOR signaling (Philippi et al., 2010). The revised manuscript now reads:

“We show that nutrient depletion induces a rapid reduction in the levels of Pol I–Rrn3, which correlates in time with a marked decrease in promoter association of both Pol I and Rrn3. […] This is in agreement with previous observations of rDNA transcription inactivation by inhibition of TOR signalling (Philippi et al., 2010).”

The cryo-EM analysis of the Pol I monomer at 4.9 Å resolution and the Pol I::Rrn3 complex at 7.7 Å resolution are valuable, although another group recently published a Pol I-Rrn3 complex at higher resolution (4.9 Å) that seems to contain all of the same key features and allows the same insights into this important intermediate in Pol I activation as those described here-thus diminishing the significance of the current structure of the complex. The higher resolution of their monomeric Pol I compared to that recently published by another group, should allow a superior comparison between the monomeric and dimer Pol I (from the crystal structure), from which they conclude that the transition from dimer to monomer "involves partial cleft closure and increased flexibility of critical motifs". However, the relevant figure (Figure 5C) does not make a convincing case for the cleft closure in the monomer, and the accompanying text (subsection “Cryo-EM structures of monomeric Pol I alone and in complex with Rrn3”) did not help much to convince me. In addition, it seems possible that the critical motifs are flexible in both the monomer and dimer but were fixed in the dimer by crystal contacts.

Partial cleft closure in the dimer to monomer transition is half the closure required to achieve the transcription-competent state and, importantly, no further closure is observed upon Rrn3 binding. Both observations highlight the relevance of this conformational change. In order to improve clarity in our text, we have included a more detailed explanation of this structural transition that involves two events: (i) increased flexibility of 3 domains, the stalk, the DNA-mimicking loop and the A12.2 C-terminal Zn-ribbon; and (ii) partial cleft closure by approach of the clamp and protrusion domains. The revised manuscript incorporates these changes in the subsection “Cryo-EM structures of monomeric Pol I alone and in complex with Rrn3”. As a second major change, we have included new panels in Figure 5 that present close-up views of the domains undergoing the structural transitions described in the text, as well as a schematic representation of the conformational changes (Figure 5B-D). To further improve the graphical presentation, we decided to split the resulting figure into two main figures, one describing the transitions from dimeric to monomeric Pol I (Figure 5) and the other showing the transitions from monomeric to Rrn3-bound Pol I (Figure 6). As a third major change, we included an additional Rich Media File 2 showing a morph between the dimeric and monomeric states of free Pol I.

Regarding crystal contacts, domains that become flexible upon monomerization (stalk, DNA mimicking loop and A12.2 C-terminal Zn-ribbon) are not directly involved in crystal maintenance. Moreover, the cryo-EM structure of Pol I dimers in solution at 7.5 Å resolution is virtually identical to that of the crystals (Pilsl et al., 2016). Therefore, it is not possible that these critical motifs are fixed in the dimer structure as a result of the crystal contacts. A sentence stating this has been included in our revised manuscript:

“When compared with the crystal structure of dimeric Pol I (Engel et al., 2013; Fernandez-Tornero et al., 2013), which is essentially identical to dimeric Pol I in solution (Pilsl et al., 2016), our monomeric Pol I structure presents a rearranged cleft entrance where the clamp coiled-coil and the protrusion approach by about 4 Å (Figure 5B).”

The experiments showing that deleting the A14 subunit weakens Pol I:Rrn3 interaction by PICT assay and reduces Pol I/Rrrn3 occupancy at the promoter by ChIP assay are valuable, but they have not ruled out the possibility that removing this subunit perturbs other Pol I subunits, e.g. A43 with which it seems to interact with extensively, and thus impairs Pol I interaction with Rrn3 indirectly by disrupting A43:Rrn3 contacts rather than eliminating the A14:Rrn3 interactions evident in the cryoEM structure. It is even possible that the steady state level of Pol I is reduced by the A14 deletion and contributes to the reduced yield of Pol I:Rrn3 interactions and Pol I recruitment. Thus, the effects of the A14 subunit deletion on Pol I integrity and abundance should have been examined. But even more importantly, the authors should have used the molecular details of the cryoEM structure to more surgically disrupt the A14:Rrn3 interaction by truncating or substituting helix 2 of A14 in a way designed not to disrupt A14 interactions with other Pol I subunits. This seems like a missed opportunity to exploit their structure.

To rule out the possibility that mutations of A14 perturb other Pol I subunits, we performed western-blot analysis against several subunits in the complex (Figure 7—figure supplement 1). For the complete deletion of A14 we tested subunits A190, A135, A49, A43 and A34.5. For the other mutants we tested A190. For all the mutants, we also evaluated the Rrn3 levels. In all cases the levels of detected proteins were similar to those in the wild-type strain. To further exploit our structural data, we designed two additional mutants in subunit A14. Following the reviewer’s suggestion, we have produced a deletion mutant that includes helix-α2 and the A14-Ct tail, the latter being innocuous for Rrn3 binding. Additionally, we also designed a surgical point mutant within helix-α2, R91E. Cells with helix-α2 mutated (deletion or point mutation) present lower levels of Pol I–Rrn3 and lower occupancy at the rDNA promoter of Pol I and Rrn3, features that resemble △A14 cells. Together with the A14ΔTAloop mutant (see below), these results confirm that the activation of Pol I in growing cells is regulated through the levels of Pol I–Rrn3 assembly. This is presented in the revised manuscript (subsection “The stalk subunit A14 influences rDNA promoter association”, second paragraph) and accompanying figure (Figure 7F), as well as in the Discussion (subsection “The Pol I stalk as a sensing platform of the cell state”).

In summary, the paper represents a collection of three different lines of work joined by the theme of regulating Pol I:Rrn3 interaction. The evidence for homodimer formation in cells is interesting and valuable but it is unclear that it constitutes an important means of impeding Pol I:Rrn3 association and promoter recruitment rather than being a byproduct of the loss of this complex by other means that serves only to protect Pol I from degradation. The cryoEM structures are valuable, but a Pol I:Rrn3 complex of higher resolution was already published. The structure-function analysis of A43 and A14 did not exploit the cryoEM structure, as it involved deletions of large segments that are not present at their interfaces with Rrn3. The result that deleting the TA loop in A14 leads to greater Pol I:Rrn3 association and promoter occupancy is the most interesting finding, but the molecular mechanism is not obvious from the structure. Taken together, the paper is not a strong candidate for eLife, even if the authors can address all of the shortcomings in the experiments and interpretations mentioned above or below.

We believe that the three lines of work and the diversity of methods that we employed to study the influence of Pol I complexes on transcriptional activation represent a major strength of our manuscript. Overall, the manuscript has been improved in different ways:

1) Pol I homodimerization is now confirmed by Co-IP after crosslinking experiments (Figure 1—figure supplement 4). Moreover, to evaluate if Pol I homodimerization is just a byproduct of Pol I–Rrn3 complex clearance, we analyzed the levels of Pol I homodimers in cells with perturbed levels of the Pol I–Rrn3 complex. Using the A14ΔTAloop, which exhibits a 2-fold increment in Pol I–Rrn3 levels in starving conditions, we could not detect any change in Pol I dimerization compared to the WT (Figure 7—figure supplement 2). This observation suggests that Pol I homodimerization is not a consequence of Pol I-Rrn3 clearance, but a process that is specifically induced upon starvation.

2) New mutants allow specific targeting of Pol I complexes to discern the contribution of each assembly in Pol I regulation. As mentioned, we have further exploited our Pol I–Rrn3 structure to design mutants that show the biological relevance of subunit A14. Helix-α2 mutants specifically disrupt Pol I–Rrn3 assembly and show that Pol I–Rrn3 complexes are required for proper Pol I activation in growing cells. Moreover, cells expressing a mutated form of A14 lacking the TA-loop, show higher levels of Pol I–Rrn3, both in growing and starved cells (Figure 7F and Figure 7—figure supplement 2). Since Rrn3 and A190 levels are equivalent to WT cells (Figure 7—figure supplement 1), this confirms the role of the TA-loop in regulating Pol I–Rrn3 levels independently of total Rrn3 levels. In addition, ChIP experiments show that in growing cells higher levels of Pol I–Rrn3 are enough to strength the activation of Pol I. However, under starvation higher Pol I–Rrn3 assembly is not enough to increase the recruitment of Pol I to the promoter. These results indicate that levels of Pol I–Rrn3 regulate Pol I activation in growing cells but are not sufficient for inactivation after long nutrient depletion. Interestingly, our more surgical A43ΔCt mutant (Δ307-326), which specifically impairs Pol I dimerization, dampens loss of Pol I and Rrn3 at the promoter (Figures 1 and 3). This shows that Pol I homodimerization in starved cells contributes to down-regulate Pol I–Rrn3 levels and subsequent recruitment to rDNA. Thus, we propose that the cell uses homodimerization to down regulate Pol I in starved cells.

3) We used ChIP to study the dynamics of Pol I activation upon perturbation in nutrient availability (further described below). Down regulation of Pol I upon nutrient deprivation follows a similar pattern than Pol I–Rrn3 disassembly. This is in agreement with the mutagenic analysis and suggests that the levels of Pol I–Rrn3 dictate activation of Pol I transcription in growing cells and the first minutes upon nutrient deprivation. Upon re-feeding, rDNA association follows a linear behavior, different to the dynamics of Pol I–Rrn3 assembly. We hypothesize that this reflects the combination of Pol I release from homodimers and the increment in the levels of Pol I–Rrn3.

In conclusion, we believe that our manuscript represents a significant advance in the field.

Other major criticisms:

The PICT approach requires Rapamycin, which is known to impair ribosome biogenesis. It's unclear from the genotypes provided whether both alleles of TOR1 in the diploid strains they used are the tor1-1 allele conferring resistance to Rap, which would seem to be required. Even if this is so, it seems important to show directly, if it's not in the literature already, that treatment of their PICT strain with rapamycin has no effect on Pol I recruitment or 35S pre-rRNA synthesis.

We have clarified the genotype in Supplementary file 1. All diploid strains used had the two tor1-1 alleles as well as the two fpr1 alleles deleted. Following the reviewer’s suggestion, we performed ChIP analysis in our tor1-1 mutant strain and concluded that Rapamycin treatment has no effect on Pol I association to the rDNA promoter. The corresponding ChIP experiment has been included as a new panel A in Figure 1—figure supplement 3. The revised manuscript now reads:

“Since Pol I transcription is down-regulated by rapamycin, all subsequent experiments were performed in rapamycin-insensitive strains carrying the tor1-1 mutation (Helliwell et al., 1994), so that addition of this compound has no effect on Pol I association to rDNA promoters (Figure 1—figure supplement 3A).”

Figure 4: the very long time scale involved in the appearance or disappearance of the Pol I homodimers and Pol I:Rrn3 complexes raises the question of how important either one might be to regulating Pol I/Rrn3 occupancy of promoters, which might occur much more rapidly than either of these protein assembly reactions. It seems important to conduct ChIP experiments in the same regimen to determine how quickly promoter association is lost or regained in the transitions between growth and starvation – it might go to completion within a few minutes, which would be highly relevant to their interpretations.

We conducted ChIP experiments at similar time intervals as PICT after nutrients were severely altered. Because performing ChIP experiments at many time points is very challenging, we chose time points that cover the different stages observed in complex assembly by PICT. Our results show that rDNA promoter association of Pol I and Rrn3 extinguishes and recovers with kinetics in the same time scale as changes observed in the levels of Pol I homodimers and Pol I–Rrn3 complexes detected by PICT. Upon nutrient deprivation, promoter association drops exponentially and correlates with changes in Pol I–Rrn3 levels. The rate curve resembles that of Pol I–Rrn3 clearance, but the latter only reaches 40% of the initial value, in accordance with the overall levels of Rrn3 as shown by western-blot. This is in agreement with the experiments of A14 mutants and the Rrn3-A43 fusion strain (see above). Altogether, the data show that Pol I–Rrn3 levels influence Pol I activation in growing cells and during the first minutes upon starvation, but they are not sufficient to regulate Pol I inactivation in long-term starved cells. Upon nutrient re-supplementation, promoter association increases steadily while Pol I–Rrn3 formation follows different dynamics, where Pol I–Rrn3 levels grow at an early stage, remain constant during a second stage and then increase again up to growing levels. This suggests that Pol I homodimers represent a rapid enzyme supply to generate Pol I–Rrn3 complexes. This is supported by the observation that cells where Pol I homodimerization is impaired (new A43ΔCt mutant) present higher levels of Pol I and Rrn3 at the promoter and of the former within the gene. This mutant also suggests that in cells starved for 2 hours, Pol I homodimerization accounts for about 60% of Pol I inactivation, according to Pol I promoter. The description of the new ChIP experiments has been included in the revised manuscript, which now reads:

“ChIP experiments performed at an equivalent regime show that promoter association of both A190 and Rrn3 drops by two thirds within the first 10 minutes from starvation but requires about 2 hours to reach completion (Figure 4B, left). […] Overall, these results indicate that cells respond to nutrient availability by differentially adjusting the levels of Pol I homodimers and Pol I–Rrn3.”

It should be stipulated that the model in Figure 7 assumes that all of the Pol I is dimerized in starved cells, whereas the PICT assay only says that some detectable level of dimerization can be detected in starved cells without indicating the proportion of Pol I in this state. At this stage of their knowledge, it would be more prudent to depict a mixture of Pol I dimers and monomers present in starved cells with Pol I:Rrn3 complex assembly proceeding either from pre-existing monomers or following dissociation of dimers. This would make it easier to understand the multi-phase kinetics of Pol I:Rrn3 assembly and also take into account the fact that cycloheximide treatment of starved cells evokes even higher levels of dimer formation than starvation alone (implying that not all of the Pol I is dimerized in starved cells).

We appreciate the reviewer’s comment but we did not intend to suggest that all of the Pol I is dimerized in starved cells. We have changed former Figure 7, now Figure 8, to better integrate the conclusions and hypothesis derived from our results. The revised manuscript now reads:

“Therefore, both Pol I–Rrn3 and Pol I dimerization modulate rDNA transcription, which allows us to propose a model (Figure 8). […] Upon refeeding from starvation, we propose that available Pol I–Rrn3 complexes are rapidly recruited for transcription, while disruption of Pol I homodimers provides fresh Pol I that can interact with Rrn3 to increase Pol I–Rrn3 complexes and further activate rDNA transcription.”

Reviewer #2:

The manuscript has two distinct parts, the first to study the in vivo formation of the inactive PolI dimer and its role in nutrient regulation of transcription in yeast, the second to present 4.9A Cryo-EM structures of yeast PolI and the PolI-Rrn3 complex. This reviewer does not feel competent to judge the validity or significance of these structures and so I will limit my review to the data on PolI dimer formation as a regulatory mechanism, Figures 14.

The authors use an adaption technique called PICT (Protein interactions from Imaging of Complexes after Translocation) that uses the ability of Rapamycin to mediate an interaction between FKBP and FRB. In this adaption of PICT, FKBP is fused to Tub4 and RFP, and FRB to the large subunit of PolI. Addition of rapamycin then causes FRB-PolI to be recruited to the RFP tagged spindle poles. The authors then study the co-localization of a GFP-PolI fusion with the RFP tag as a measure of PolI dimerization in rapid growth in rich medium and after nutrient withdrawal. Similarly, and Rrn3-GFP fusion is used to study the formation of the active PolI-Rrn3 complex. A rapamycin resistant yeast strain is used to avoid the known effects of this drug on the Tor pathway.

The technical approach is interesting and still novel. The question of whether or not an inactive PolI dimer forms in vivo and plays a part in regulation of the ribosomal RNA genes is an important one. This said, I found the data inadequate to support the key claims that nutrient deprivation or drug induced inhibition of protein synthesis or ribosome assembly leads to a significant accumulation of inactive PolI dimers and that could be reversed by refeeding or drug withdrawal.

Already from Figure 1 I found it very difficult convince myself that there was true co-localization of GFP and RFP and hence PolI dimer formation in the starved wt/wt situation. At best only a very small fraction of the GFP signal colocalizes with the RFP anchor, but a halo of GFP also forms around the anchor site (Figure 1B). Why this halo forms is not discussed, and since no marker of the nuclear space is provided it is also very unclear what is being observed. The GFP halo around the RFP signal, very prominent in both wt/wt and A43ΔCt/A43ΔCt but present in most images throughout the manuscript, appears to make even a rough estimate of RFP-GFP co-localization near impossible. The quantitation protocol used (Materials and methods) makes no attempt to take this GFP halo into account as a (non co-localizing) background fluorescence. The problem is clearly demonstrated in Figure 1—figure supplement 1B, where the background level of GFP even in these test examples is at least as large and often many times the co-localizing signal. Given this, not only is the quantification of the co-localizing PICT signal highly questionable, but it would be essential to demonstrate the degree to which the GFP signal is detected in the RFP optical channel, even a small overlap would give a very significant PICT signal.

This reviewer mentions a list of points that are key to correctly interpret the PICT assay. We agree that the Methods section and some of the figures lack clarity and might have been misleading. For this reason we appreciate his/her comments and have modified the manuscript to address them as follows:

The vast majority of A190 accumulates in a sub-compartment of the nucleus. We imaged the perimeter of the nucleus using the Nic96-RFP marker (a component of the nuclear pore complex) in cells with the genetic background used for PICT (i.e. tor1-1 mutant and deleted fpr1) and that express A190-FRB-GFP (OGY0346). These cells showed that some A190-FRB-GFP signal is also observed through the entire nucleus, which the reviewer called GFP “halo”. Since the anchoring platform (Tub4-RFP-FKBP) resides in the nuclear envelope, depending on the orientation from where each cell is imaged, the RFP spot corresponding to the anchor might be surrounded by more or less of this GFP halo. Since in the in focus field of view the nucleus of each cell is oriented randomly, we expect a high variability. As shown in Figure 1—figure supplement 3F, growing and starving cells have comparable mean GFP intensity in the area occupied by the anchor. Nevertheless, in both conditions, cell-to-cell variability is remarkable, with a standard deviation higher than 30% of the mean. In summary, the GFP halo does not form as a result of the rapamycin or the media used, but probably reflects the localization of a small population of A190 in yeast cells. We have corrected all PICT figures in the manuscript to include cells that present a GFP halo signal that is representative of each sample. A deeper study of the A190 diffused in the nucleus goes beyond the scope of this manuscript.

Additionally, we quantified the impact of the incubation media in the recruitment score by measuring the recruitment of A190 fused to FRB and GFP (A190-FRB-GFP). As expected, there was no significant difference between the recruitment score determined in growing and starved cells.

Our image analysis workflow, which is now fully detailed in Figure 1—figure supplement 2, has been designed to guarantee a specific detection of spots in the GFP channel, even in the presence of strong but smoothly varying background signal. This is achieved by local thresholding adapted to expected spots geometry, and the validation of the detected connected particles. Furthermore, only residual false positives GFP spots overlapping with a detected anchor actually count toward the recruitment score. Since anchors are sparsely located, and are virtually detected flawlessly, this only happens very marginally (see Figure 1—figure supplement 2). Overall, recruitment scores are highly reproducible across experiment conditions and exhibit a low standard deviation.

As mentioned, the mean GFP halo intensity is comparable in growing and starved cells. Since the quantification of the recruitment score is done on multitude of cells (see comment to reviewer 1), the cell-to-cell variability is averaged out. For this reason, it is not necessary to take into account this GFP signal in order to establish relative differences between our samples.

Figure 1—figure supplement 1B shows the intensity profile in the GFP (prey-GFP) and the RFP (Tub4-RFP-FKBP) channel. The profile of the GFP and RFP channels are shown in arbitrary units so that they do not overlap and the brightest pixel of each channel can be identified easily. In the three examples, the GFP signal that co-localizes with Tub4-RFP-FKBP is higher than the surrounding GFP signal.

The optical system of our microscope ensures that bleed-through from the GFP to the RFP channel is negligible since we have used specific combination of optimized beam splitters, excitation and emission filters (cubes) for each fluorophore type and since the images were recorded sequentially. As mentioned earlier, the vast majority of the A190-GFP signal is in the nucleolus. If there was bleed-through from the GFP to the RFP channel, we should see this reflected in an apparent RFP signal localizing in this sub-compartment of the nucleus. Among other controls, the blank experiments (Figure 1—figure supplement 3C) show that there is no detectable GFP signal in the RFP channel or RFP signal in the GFP channel, as there is no colocalization between the two fluorophores before adding rapamycin. We have detailed the optics of our microscope in the ‘Materials and methods’ section.

In summary, detection of Pol I homodimers by PICT cannot result from artifacts caused by the GFP halo, the incubation in different medium or bleed-through between the GFP and the RFP channels.

The same problems occur in Figure 2, and again here the lack of definition of the nuclear volume and the varying distances between the anchor points suggest yet a further complication that each image represents a different cell cycle stage. The images shown in Figures 1 and 2 do not convince me that it is possible to estimate in any reliable way the degree of co-localization of the anchor and PolI-GFP signals and in Figure 2A even the authors' quantitations for +- cycloheximide are well within the estimated errors. Also, the authors provide no quantitation of Diazaborine effects, nor a control to demonstrate that non-functional ribosomes actually form in their experiment as they claim. The title of this section "Non-functional ribosomes trigger Pol I homodimerization" is clearly not supported by the data.

For these reasons, it is my opinion that the data do not convincingly demonstrate PolI dimerization in vivo or that it is modulated on nutrient deprivation, transcription inactivation or inhibition of protein synthesis.

We have engineered anchoring platforms at the spindle pole body (SPB). During the cell cycle, SPB duplicates and separates to the daughter and mother cell. Therefore, cells hold 1 or 2 anchoring platforms depending on the cell cycle stage they are at during imaging. Starved cells also hold 1 or 2 anchoring platforms. When holding 2 anchoring platforms, the observed anchor-to-anchor distance spread is large and depends on the cell cycle stage at the moment of nutrient deprivation. These differences, however, are averaged out in our quantifications because the overall PICT recruitment score is computed over a minimum of 67 cells for each biological replicate (3 biological replicates). We apologize because some of the images we had chosen presented highly varying anchor to anchor distances, suggesting that samples had been analyzed at different cell cycle stages. We have now chosen cell images to correct this misunderstanding. The new Figure 1—figure supplement 2 shows the detailed workflow of the PICT image analysis and a field of view with cells (with different number of anchoring platforms and anchor to anchor distances).

Following the reviewer’s suggestion, we have performed a quantitative PICT assay to estimate the recruitment score of Pol I homodimers upon diazaborine and cycloheximide treatment in growing cells (Figure 2B). As mentioned in previous comments, we have improved the clarity of the figures for PICT experiments by choosing representative cells for the GFP halo intensity and cell cycle stages, as well as by adjusting the contrast of the GFP image.

The evidence for an in vivo interaction between PolI and Rrn3 in Figure 3 is much more convincing. Here a co-localization is evident between the Rrn3-GFP and the anchored PolI-associated RFP signals. But the images do not convincingly show a reduction on nutrient starvation, and here again the GFP halo makes quantitation very uncertain. Further, the ChIP measurement of PolI and Rrn3 recruitment at the gene promoter reduces by over 80% in starved cells (Figure 3C) and is not consistent with the only 50% reduction in PolI-Rrn3 estimated by PICT. (To be reliable the ChIP data should be extended to other amplicons both within and outside of the 35S transcribed region to show that the reduction in promoter signal is not due to chromatin accessibility changes after nutrient depletion, etc.) As is, the data provided suggest that the reduction in transcription on nutrient withdrawal is not due either to dissociation of the PolI-Rrn3 complex or the formation of inactive PolI dimers.

We agree with this reviewer that previous figures did not illustrate well the spread of recruitment typically observed in PICT experiments. As mentioned, we have modified the figures to include a zoomed inset around the anchors of a representative cell. In this inset we have color-overlaid segmented spots in the GFP channel, the RFP channel and the intersection of both channels (pixels where we detected co-localization between RFP and GFP). As we have shown for cells expressing A190-GFP, the GFP signal around the anchor in cells expressing Rrn3-GFP is similar in both growing cells and starved cells (Figure 3—figure supplement 1B). Rrn3-GFP signal is segmented in the same way as A190-GFP (explained in detail in the Materials and methods section and illustrated in Figure 1—figure supplement 2). The inset with color overlay shows that segmentation of anchors is perfect, and that all apparent GFP spots are detected with some false detections that do not affect significantly the recruitment score since they only marginally occur over an anchor.

Regarding disparity between Pol I–Rrn3 levels and Pol I and Rrn3 promoter association in starved cells, we agree that reduction of Pol I–Rrn3 levels are not sufficient to fully account for inactivation of rDNA transcription. However, we now present a more surgical mutation of the A43 C-terminal tail (new A43ΔCt mutant) where Pol I dimerization is impaired (Figure 1B) but the levels of Pol I and Rrn3 promoter association are higher than for the wild-type in starving conditions. This suggests that Pol I homodimerization plays an essential role in inactivation of rDNA transcription. In conclusion, we have tuned-down our claims and now state that both Pol I homodimers and Pol I–Rrn3 complexes modulate rDNA transcription.

To fulfill the reviewer’s requirement, we have performed ChIP experiments at two different regions within the rDNA gene, i.e. 18S and 25S (Figure 3C). Our results show that A190 associates with the chromatin all along the transcribed region and the rDNA promoter, while Rrn3 levels are only high at the promoter region for the wild-type strain (Figure 3D). However, our ChIP analysis of mutant strains indicates that changes in chromatin accessibility after nutrient depletion do not explain the reduction in Pol I and Rrn3 promoter association. For instance, in the Rrn3-A43 fusion strain, A190 can be localized associated within the 35S rDNA gene under starving conditions at significantly higher levels than in wild-type cells (Figure 3—figure supplement 2). A similar behavior can be observed for the new A43ΔCt mutant (Figure 3D). Therefore, while a profound study of chromatin accessibility in different nutrient conditions is very interesting, we feel that a deeper analysis of this event goes far beyond the scope of the current studies and our data do not support this hypothesis.

The time course data in Figure 4 is potentially interesting, but again is based on a techniques and quantitation regime that are wholly inadequate. Even if we accept that the data do in fact reflect in vivo changes, we have no idea what the relative signals mean in terms of the fraction of PolI in the different complexes. The PolI dimer signal might be rising on nutrient withdrawal and falling on refeeding, but we have no idea how much of PolI is undergoing this change. This is particularly clear from the refeeding data, where dimers appear to be rapidly eliminated, but PolI-Rrn3 complexes hardly increase over the same time period.

We agree with the reviewer that PICT does not tell about absolute levels of protein complexes but it does reflect relative changes between different time points. As mentioned above, we have now included time-course ChIP experiments showing that, upon refeeding, Pol I is rapidly associated to promoters to activate transcription. Thus, in spite of an increment in the assembly of Pol I–Rrn3 complexes, these will also rapidly disassemble as a result of rRNA synthesis. Therefore, Pol I–Rrn3 levels as seen by PICT are not expected to rise until Pol I–Rrn3 assembly is faster than Pol I incorporation to rDNA, which we observe only at the later stages of recovery from starvation. The absolute quantification of Pol I dimer copies goes beyond the scope of this study. Nonetheless, our novel A43ΔCt mutant shows that Pol I homodimerization is responsible for about 60% of Pol I inhibition in cells starved for 2 hours, highlighting the relevance of this regulatory mechanism.

In short, the questions are interesting, the technique fascinating, but the data do not support the claims and interpretations.

Reviewer #3:

[…] Specific comments:

For the PICT results, it's sometimes not clear how the individual cell panels illustrate the numbers shown in the bar graphs. For example, in Figure 1, why is the δ 43 heterozygote nearly WT on the bar graph, while the homozygote is zero? The pictures make it look like it should be the other way around. Please clarify exactly what the bar graphs are showing: simple overlap of peaks in two dimensions, or some 3D measurement? Perhaps more pictures would help.

We have now presented more clear images of cells so that the quantification can be more easily examined. Please refer to responses to reviewer 2 for a thorough explanation on how PICT images have been quantified. The methodology followed to analyze and quantify these assays had not been explained accurately. We have extended the description in the Materials and methods section. We have also modified all the figures to clarify the PICT experiments. Since we had article space limitation and since the spots of the recruited prey-GFP at the anchoring platforms are small, we could not show many cells for each treatment. Instead we selected cells that were representative of each sample. We have adjusted the contrast to facilitate the identification of the recruited prey-GFP. Finally, we have updated the image to include a zoomed inset of the area around the anchoring platforms and also used a color overlay that labels pixels according to segmented spots in both channels.

In the last paragraph of the subsection “Dynamics in the assembly of Pol I complexes in response to nutrient availability”, the paper states that in the second stage after addition of nutrients, the pol I homodimers disappear, but with no increase in the Rrn3/pol I complex. Where do those polymerase molecules go, if not into the Rrn3 complex?

As explained for reviewer 2, we interpret that these molecules are engaged in active transcription, so they should be loaded along the rDNA gene. This would explain that there is no apparent change in the overall levels of Pol I–Rrn3 in the middle stage of recovery from starvation.

I like the idea in final paragraph of the Discussion, which draws parallels between the Rrn3-pol I and Mediator – pol II interactions. However, use of the word "holoenzyme" in the pol II system has been very messy and I would avoid it. To my mind, a holoenzyme should have all the activities needed for promoter recognition and transcription initiation. There were some early papers proposing a pre-assembled holoenzyme of pol II with all the general transcription factors, but those models haven't held up. Later papers started misusing holoenzyme to mean the Mediator – pol II complex. For similar reasons, I don't think Rrn3-pol I would qualify as a holoenzyme. I would avoid the word altogether so as not to distract from the concept that factor interactions with the stalk and surrounding regions might help bring RNA polymerases to the promoter.

We have now re-written this section to remove the Pol I holoemzyme concept, while keeping the comparison with the Pol II and bacterial systems. The revised manuscript includes a revised paragraph at the end of the Discussion.

[Editors' note: further revisions were requested prior to acceptance, as described below.]

[…] However, there are two major issues with their description of the results.

First, their description of the new coIP experiment shown in Figure 1—figure supplement 4 is very confusing and incomplete. The only results that are straightforward are shown in lanes 1-2 and 5-6, which provide valuable evidence for Pol I homodimers in the soluble fractions obtained from cross-linked cells when the cells have been starved. In their "Responses to reviewers", they provide a somewhat more complete explanation of the last 3 lanes pertaining to the insoluble cell fractions, but even this doesn't make complete sense, and it was left out of the manuscript/legends completely. A coherent explanation of all of the lanes in Figure 1—figure supplement 4 is required.

We thank the Reviewing editor for this useful recommendation. In addition to a more detailed description of the coIP experiments, labelling of lanes 8 and 9 in Figure 1—figure supplement 4A had been interchanged and is now amended. The revised version of the manuscript now reads:

“In addition, we performed co-immunoprecipitation experiments after crosslinking, using a diploid strain where one A190 allele was tagged with TAP (A190-TAP) and the second with MYC (A190-MYC). […] The absence of histone H3 in the soluble fraction indicates that there is no contamination from the chromatin insoluble fraction (Figure 1—figure supplement 4B).”

Second, in the Discussion: the statement that "initial transcriptional inactivation is mainly driven by Pol I:Rrn3 disassembly." does not seem justified. The experiments in Figure 4A-B clearly show that the bulk of the dissociation of Pol I: Rrn3 from the promoter occurs within the first 20 min at a timepoint where Pol I:Rrn3 complexes are still very abundant and almost no Pol I homodimers have formed. It seems unavoidable that there is another regulatory mechanism apart from dissociation of Pol I:Rrn3 complexes and Pol I homodimerization responsible for the rapid and nearly complete loss of promoter-bound Pol I on starvation. From their statements at several places in the text, it appears that the authors actually agree with this view, but they don't state it directly in the Discussion and it is not depicted in the final model, which could be misleading to the field. The authors are urged to acknowledge more explicating in the Discussion and in their final model that there remains an important gap in knowledge about how the rapid dissociation of the Pol I:Rrn3 complex from the promoter is achieved on starvation.

We agree with the view of the Reviewing editor and have now incorporated this concept in the Discussion section, as well as in the new Figure 8 and accompanying legend. The revised manuscript now reads:

“When nutrients are depleted, Pol I–Rrn3 levels and promoter association drop exponentially whereas Pol I only homodimerizes subsequently. […] At a later stage, Pol I homodimerization remains a major factor limiting transcription.”

Figure 8. Model for the influence of nutrient availability on the assembly of Pol I complexes. […] Transparency indicates mobility of the stalk in monomeric Pol I.”

Associated Data

    This section collects any data citations, data availability statements, or supplementary materials included in this article.

    Supplementary Materials

    Supplementary file 1. Table of yeast strains used in this study.

    DOI: http://dx.doi.org/10.7554/eLife.20832.027

    elife-20832-supp1.docx (25.5KB, docx)
    DOI: 10.7554/eLife.20832.027
    Supplementary file 2. Table of statistics for the cryo-EM structures described in this study.

    DOI: http://dx.doi.org/10.7554/eLife.20832.028

    elife-20832-supp2.docx (58.7KB, docx)
    DOI: 10.7554/eLife.20832.028

    Data Availability Statement

    The Pol I–Rrn3 and Pol I monomer cryo-EM maps were deposited under accession numbers EMD-4086 and EMD-4087. The cryo-EM map of the Pol I monomer at 4.9 Å resolution and its corresponding pseudo-atomic model were deposited under accession codes EMD-4088 and PDB-5LMX.


    Articles from eLife are provided here courtesy of eLife Sciences Publications, Ltd

    RESOURCES