

SUMMARY
Design of small molecules that disrupt protein-protein interactions, including the interaction of RAS proteins and their effectors, have potential use as chemical probes and therapeutic agents. We describe here the synthesis and testing of potential small molecule pan-RAS ligands, which were designed to interact with adjacent sites on the surface of oncogenic KRAS. One compound, termed 3144, was found to bind to RAS proteins using microscale thermophoresis, nuclear magnetic resonance spectroscopy and isothermal titration calorimetry, and to exhibit lethality in cells partially dependent on expression of RAS proteins. This compound was metabolically stable in liver microsomes and displayed anti-tumor activity in xenograft mouse cancer models. These findings suggest that pan-RAS inhibition may be an effective therapeutic strategy for some cancers, and that structure-based design of small molecules targeting multiple adjacent sites to create multivalent inhibitors may be effective for some proteins.
Keywords: Ras, Kras, Nras, Hras, cancer, small molecule, drug design, chemical biology, GTPase, multivalent
INTRODUCTION
Small molecule drugs act by binding to proteins; those proteins that harbor sites amenable to small molecule binding are termed druggable (Hopkins and Groom, 2002). An important class of proteins that is challenging from the standpoint of small molecule ligand discovery consists of proteins that exert biological effects through protein-protein interactions (Arkin et al., 2014; Arkin and Wells, 2004). While some protein-protein interactions consisting of short alpha helical domains inserted into a hydrophobic pocket in an interacting protein have been amenable to disruption with small molecules (e.g., the p53-Mdm2 interaction (Vassilev et al., 2004)), most protein-protein interactions have been challenging to inhibit with small molecules. Within this category of challenging targets is the RAS family of GTPases. Despite numerous efforts to target these oncogenic proteins, therapeutic agents that directly inhibit the oncogenic effects of RAS proteins have been challenging to create (Cox et al., 2014); this is noteworthy because RAS proteins have been extensively studied due to their high prevalence and frequent essentiality in lethal malignancies (Downward, 2003).
Mutations RAS genes are commonly found in numerous malignancies, including pancreatic (90%), colon (45%), and lung cancers (35%) (Prior et al., 2012). Many tumor types have been shown to be dependent on continued expression of oncogenic RAS proteins in cell and animal models (McCormick, 2011). The critical ongoing role of RAS proteins in the viability, maintenance and growth of many cancers, and the inability of researchers to develop drugs directly targeting RAS proteins has motivated alternative approaches, such as synthetic lethal screening; to date, however, this approach has not yielded promising drug candidates for RAS mutant cancers (Dolma et al., 2003; Kaelin, 2005; Yang and Stockwell, 2008).
The RAS proteins function in signal transduction pathways controlling cell growth and differentiation as binary switches, transitioning from an inactive GDP-bound state to an active GTP-bound state (Karnoub and Weinberg, 2008; Malumbres and Barbacid, 2003; Prior and Hancock, 2012). GTP binding enables several residues, primarily in the switch I region (residues 30–40) and the switch II region (residues 60–70) to adopt a conformation that permits RAS effector proteins to bind; this switch is regulated by GTPase activating proteins (GAPs) and guanine nucleotide exchange factors (GEFs) (Hall et al., 2002). Mutations that result in the impairment of the intrinsic GTPase activity of RAS proteins, or that prevent GAP binding, activate downstream signaling pathways and contribute to tumor formation and maintenance (Block et al., 1996; Huang et al., 1998; Huang et al., 1997; Pacold et al., 2000).
RAS proteins have been challenging drug targets, primarily due to the lack of a sufficiently large and deep hydrophobic pocket for small molecule binding, aside from the challenging nucleotide-binding site (Cox et al., 2014; Gysin et al., 2011; Shima et al., 2013; Spiegel et al., 2014; Stephen et al., 2014; Sun et al., 2012; Wang et al., 2012). Previous efforts, which have included fragment-based experimental screening, have focused on identifying and targeting individual shallow sites on RAS proteins, (Burns et al., 2014; Cox et al., 2014; Maurer et al., 2012; Ostrem et al., 2013; Shima et al., 2013; Sun et al., 2012; Sun et al., 2014). Targeting such sites has yet to yield ligands with sufficient potency and selectivity to enable in vivo exploration of contexts in which RAS proteins serve as viable pharmacological targets. This observation motivated our hypothesis that instead of targeting a single site on RAS proteins, we might be able to design ligands that target multiple sites, enabling sufficient affinity and selectivity for pharmacological RAS inhibition. Moreover, given frequent addiction to mutated RAS proteins, we hypothesized that pan-RAS inhibition (i.e., simultaneous inhibition of the products of the HRAS, NRAS and KRAS genes) would be therapeutically beneficial, despite the essentiality of Kras for normal mouse development (Johnson et al., 1997). Here, we report the design and testing of candidate small molecule pan-RAS inhibitors; these compounds were designed to prevent effector protein binding; we focused on one compound that was found to bind to RAS proteins in vitro, and to cause inhibition of tumor growth in animal models of RAS-dependent cancers. This approach represents a potential therapeutic strategy for treating RAS-dependent cancers and demonstrates that structure-based computational design of small molecules targeting two or more sites may be effective for otherwise challenging drug targets.
RESULTS
Our initial efforts focused on analyzing the interaction of KRASG12D with effector proteins and attempting to identify small molecule binding sites that are also functionally relevant. We noted that mutagenesis of the residues in a stretch of amino acids in the switch I region (Figure 1A) (i.e., I36 - S39), or of the interacting residues on the primary effector proteins (RAF, PI3K or RALGDS), has been reported to lower binding affinity for effector proteins to RAS proteins (Colicelli, 2004; Gysin et al., 2011; Hall et al., 2002; Huang et al., 1998; Huang et al., 1997; Karnoub and Weinberg, 2008; Malumbres and Barbacid, 2003; Pacold et al., 2000; Scheffzek et al., 1997; Shaw and Cantley, 2006; Tanaka and Rabbitts, 2010; Tsutsumi et al., 2009; Vigil et al., 2010; Walker and Olson, 2005). Analysis of the KRASG12D (PDB: 4DSN, and see Supporting Information) structure revealed a candidate site in the switch I region (termed here the D38 site), and two additional potential binding sites near the D38 site (Figure 1B and Supporting Information): we identified a site centered on alanine 59 (termed the A59 site), located between the switch I and switch II regions; on the other side of the D38 site, we identified a potential binding site near Y32 (Figure 1B and Supporting Information).
Figure 1. Design of inhibitor of RAS proteins.

(A) KRASG12D (PDB: 4DSN) with the switch I region shown in green and the switch 2 region in purple. (B) Location of three sites on KRASG12D targeted (D38 site in yellow, A59 site in blue, Y32 site in red), with pose of docked 3144 ligand. (C) Structure, docking score, chemical formula, mass and molecular weight of the small molecule 3144. See also Figure S1, Table S1 and Supporting Information.
We computationally docked (using Glide SP, Schrödinger Inc.) designed fragment-like and lead-like small molecules into each of these sites on KRASG12D. Small molecule libraries were designed spanning two or three of these sites, with the goal of generating compounds with improved affinity and specificity. Among the top-ranked fragments selected for the D38 site, we observed a substantial number of aliphatic rings that contained protonated amines making electrostatic interactions with the carboxylic acid functional groups of D38 and D33. In the adjacent A59 site, several of the top-scoring fragments contained an indole. We calculated the predicted physiochemical properties (using Qikprop, Schrödinger Inc) of the most promising compounds, to determine if they would be ultimately suitable for in vivo testing, given the larger molecular weights required for creating favorable predicted interactions with two or more sites. While the molecular weights surpassed the ideal range for orally bioavailable molecules (e.g., Figure 1C and Figure S1C) and predicted logP values were larger than is typically seen for orally available drugs, other properties were potentially suitable (Figure S1A, C). After synthesizing and testing a number of candidate compounds (see Supporting Information), we focused on compound 3144 as the most promising candidate inhibitor (see Supporting Information for a list of compounds synthesized and tested). Compound 3144 (Figure 1C, S1A) was docked into the analogous site on other small GTPases in the RAS superfamily, which yielded less favorable docking scores, suggesting potential RAS protein selectivity (Figure S1B).
The small molecule 3144 binds to KRASG12D in MST, ITC and NMR assays
We observed that the 19F NMR spectrum of 10 μM 3144, which bears a trifluoromethoxy group, contained a single peak, as expected (Figure 2A); addition of 20 μM KRASG12D bound to the non-hydrolyzable GTP analog GppNHp (see Supporting Information) to 3144 resulted in loss of this 19F peak, presumably due to protein binding (Figure 2A), suggesting a KD for the 3144-KRASG12D-GppNHp interaction of < 20 μM. Increasing the concentration of compound 3144 resulted in the reappearance of a single peak in the 19F spectrum, presumably due to unbound excess ligand (Figure 2A). These data suggest that compound 3144 binds to KRASG12D-GppNHp with an affinity less than 20 μM under these conditions.
Figure 2. 3144 binds to KRASG12D.

(A) 19F NMR spectrum of 3144 titrated into KRASG12D (GppNHp-bound) at the indicated concentrations. (B) ITC binding assay with 3144 and KRASG12D-GppNHp. (C) (left panel) MST assay of the three-site compound 3495 and the two-site compound from which it was derived, 3443, using KRASG12D-GppNHp, (middle panel) MST assay with 3144 and its differential selectivity towards GppNHp-bound vs. GDP-bound KRASG12D, and (right panel) MST assay with two different point mutants within the predicted docking site on KRASG12D-GppNHp and 3144. (D and E) Summary of KD values obtained for binding of 3144 to the indicated proteins by MST. (F) Melting temperatures of the indicated proteins with either endogenous nucleotide or GTP (after nucleotide exchange); the shift in melting temperature indicates successful exchange of bound nucleotide. See also Figure S2 and Supporting Information.
To further validate and characterize the interaction between 3144 and KRASG12D, we measured the interaction using isothermal titration calorimetry (ITC) and HSQC NMR (Figure 2B and Figure S2). Calorimetric titration of KRASG12D-GppNHp into a solution of compound 3144 showed exothermic binding with dissociation constant (KD) of 17.8 ± 4.5 μM, consistent with the 19F NMR assay data (Figure 2B). In addition, the 1H-15N HSQC spectrum (Figure S2A, B) showed changes in amide resonances were observed in residues S39, D38, E37 and I36, consistent with the predicted docking pose (Figure S2C).
We used another independent biophysical method to test binding of 3144 to KRASG12D: we performed microscale thermophoresis (MST) using labeled GppNHp-loaded KRASG12D. We measured a dissociation constant of 9 μM +/−1 μM for the interaction between 3144 and KRASG12D-GppNHp using MST (Figure 2C). Consistent with modeling and docking (Figure S1), we detected a reduced affinity of 3144 for the GDP complex of KRASG12D (Figure 2C).
To verify the nature of the nucleotide bound to the protein used in these assays, we evaluated the composition to KRASG12D in each sample (see Supporting Information). We found that exchange of the endogenous nucleotide that is normally retained after protein purification caused a reliable shift in the melting temperature of the KRASG12D protein, allowing us to measure the efficiency of nucleotide exchange (Figure 2F). Nucleotide exchange was then confirmed directly by mass spectrometry: protein preparations were diluted into a denaturing buffer (50% MeOH with 0.05% formic acid) or into a native mode buffer (10 mM ammonium acetate), and each protein solution analyzed by mass spectrometry (see Supporting Information). The nucleotide-free apoprotein (KRASG12D) was the predominant species in the denaturing buffer methanol, but was not detected in ammonium acetate, suggesting that ammonium acetate was effective in retaining the native structure of the protein (Figure S2E). For spectra recorded in ammonium acetate, purified protein appeared as a mixture bound to GDP and GTP nucleotides, as expected. In addition, this exchange protocol was effective for both GDP and GTP (Figure S2F): no GTP was detected in the GDP-exchanged samples, and no GDP was detected in the GTP-exchanged samples. In contrast, GppNHp exchange resulted in a mixture of KRASG12D containing either GppNHp or GDP, likely due to the lower affinity of RAS proteins for this non-hydrolyzable nucleotide analog (Figure S2E). Thus, these preparations of KRASG12D-GTP and KRASG12D-GDP were pure with the expected nucleotide present, and the preparation of KRASG12D-GppNHp was a mixture of KRASG12D bound to GDP and GppNHp. The presence of contaminating GDP nucleotide in the KRASG12D-GppNHp samples may account for the modest shift in affinity of 3144 in comparing GppNHp-bound protein and GDP-bound protein in this assay (Figure 2C). It is notable that some compounds designed to bind to three sites had improved affinity, but at the expense of a larger molecular weight, lower aqueous solubility and possibly less favor physicochemical properties (Figure 2C); therefore we continued to focus our studies on compound 3144 to evaluate the feasibility of targeting two adjacent sites on RAS proteins to generate pan-RAS inhibitors.
To test whether the compound 3144 bound to KRASG12D in the predicted binding site, we generated two point mutants (D38A and I36N) that were predicted to reduce the binding affinity of 3144, and found that these mutant proteins displayed reduced binding affinity of 3144 in the MST assay (Figure 2C). We confirmed that these mutant proteins could also be exchanged with GTP, and so were still capable of binding nucleotide in a manner similar to KRASG12D (Figure 2E, F).
To assess target selectivity, we measured binding of compound 3144 to other RAS superfamily small GTPases using MST. We detected binding to KRASG12D, KRASwt, HRASwt and NRASwt, but not to other small GTPases in the RAS superfamily, with the exception of RRAS2, which showed weak binding (Figure 2D).
We attempted to obtain a crystal structure of compound 3144 bound to KRASG12D or KRASG12V: 960 different crystallization conditions were screened with these proteins at 70 mg/ml and 20 mg/ml concentrations. The higher concentration yielded crystal structures of KRASG12D Mg-GDP and Mg-GppNHp complexes at up to 1.83 Å resolution, which were nearly identical to published structures (Figure S2D and Supporting Information) (Ostrem and Shokat, 2016). We were also able to obtain a crystal structure of KRASG12V in complex with Mg-GDP (Figure S2D and Supporting Information). By comparing the G12V and G12D KRAS structures, we determined that 3144 should bind with similar affinity to both mutants, as they are essentially identical. Co-crystallization experiments with a stoichiometric amount of 3144 were not successful at yielding a ligand-bound structure, possibly due to limited solubility. Our attempts at using sub-stoichiometric concentrations for co-crystallization and crystal soaking did not yield any structures of the 3144-protein complex.
Activity of 3144 in cell lines
We next sought to test whether compound 3144 had RAS inhibitory activity in a cellular context. Given that this compound was capable of binding to HRAS, KRAS and NRAS in the MST assay, we evaluated whether combined knockdown of KRAS, NRAS and HRAS genes (Supplemental Table S2) would sensitize cancer cells to 3144; to test this, we identified a less RAS-addicted cell line (DLD-1, with KRASG13D) in which pan-RAS knockdown was not on its own substantially lethal at high cell densities (Figure 3A, S3AB). We found that while DLD-1 cells were resistant to 3144 up to 20 μM under these conditions, combined knockdown of HRAS, NRAS and KRAS resulted in sensitization to 3144 lethality, as expected for a pan-RAS inhibitor (Figure 3A). Pan-RAS knockdown did not sensitize DLD-1 cells to the lethality of MG132, a proteasome inhibitor, indicating that the sensitization to 3144 is not a general sensitization to lethal compounds (Figure 3A, Figure S3AB).
Figure 3. 3144 has RAS-dependent lethality.

(A) (left panel) Inhibition of RAS expression in DLD-1 cells transfected with siRNAs targeting HRAS, NRAS and KRAS (si-panRAS) or a non-targeting siRNA control. Total Ras expression was determined with a pan-RAS antibody, as well as actin abundance. The total RAS abundance, normalized to actin abundance, is indicated. (middle and right panels) The concentration-dependent effects of 3144 and MG132 on DLD1 cells transfected with either si-panRAS or siNT was measured using Cell Titer Glo. (B) The effect of 3144 (left panel) and vemurafenib (right panel) on viability and growth of mouse embryo fibroblasts (MEFs) was measured at the indicated concentrations using Alamar blue. All compound measurements were performed in duplicate. Black line = Kraslox/lox, Hras−/−, Nras−/− RERTnert/ert MEFs; red line = BRAFV600E-CAAX; Kras−/−, Hras−/−, Nras−/− RERTnert/ert MEFs. (C) The effect of 3144 was tested at the indicated concentrations in cultured patient-derived T-ALL samples. PDTALL6, 9, 13 and 19 = wt NRAS, PDTALL22 = NRASG13V, PDTALL26 = NRASG13D. See also Figure S3 and Supporting Information.
To further examine the potential RAS-dependent lethality of 3144, we used a previously reported mouse embryo fibroblast (MEF) cell line in which murine Hras and Nras had been deleted, and only Kras remained, flanked by loxP sites; a tamoxifen-inducible Cre recombinase was also expressed in these Kraslox/lox, Hras−/−, Nras−/− RERTnert/ert cells (Urosevic et al., 2009). We found that these cells were sensitive to the lethality of compound 3144, as expected (IC50 = 3.8 μM, Figure 3B); however, excision of Kras from these cells using tamoxifen, and introduction of membrane-targeted BRAFV600E-CAAX resulted in resistance to 3144 (Figure 3B), indicating a degree of Kras-dependent lethality. The lethality of 3144 in BRAFV600E-CAAX-expressing MEF cells at concentrations of 20 μM and above may reflect residual expression of Kras due to incomplete excision, or off-target lethality of 3144, perhaps including RRAS2 inhibition (Figure S4). The sensitivity of these lines to vemurafenib, a BRAFV600E inhibitor, was reversed, as expected, with BRAFV600E-CAAX-expressing cells being more sensitive, indicating the resistance caused by BRAFV600E-CAAX expression did not cause a general resistance to lethal compounds (Figure 3B). Moreover, we found that at concentrations below 3 μM, 3144 did not reduce the number of MEFs below the starting number (Figure S4A–C); given that treatment of these cells with 4-OHT does not result in complete lethality, but rather arrest (Figure 4B), this suggested that at some concentrations, 3144 is cytostatic, possibly due to pan-RAS inhibition.
Figure 4. 3144 inhibits RAS-dependent signaling in cells.

(A) 250,000 cells/well of the indicated MEFs were seeded in six-well dishes in medium with 10% FBS, then the next day the medium was changed to serum-free medium and the cells incubated for 24 h. 3144 or vehicle (DMSO) control were added the cells in serum-free medium for the indicated times. The cells were stimulated for 15 minutes with 10 ng/mL human EGF, then washed with cold PBS and analyzed by western blotting. The effects on abundance of phospho-ERK, total ERK, phospho-AKT, and total AKT were measured. The normalized relative abundance of pERK and pAKT is indicated next to these bands. (B) The effects of 3144, U0126 (MEK inhibitor) or BEZ-235 (PI3K inhibitor) on abundance of pAKT and total AKT (top left panel) and pERK and total ERK (bottom left panel) was determined at the indicated concentrations in BJeLR engineered human tumor cells (with HRASV12). (right panel) A similar experiment was performed in HT-1080 cells and Kras MEFs: For HT-1080 cells, 1 million cells/well (6 well dishes) were seeded, and incubated overnight. The medium was replaced with serum free medium containing the indicated concentration of 3144. After 2 h, 10ng/mL EGF was added as indicated for 15 min. MEF cells were seeded at 700k cells/well in a 12 well plate, and incubated overnight. The following day, normal growth media was replaced with serum free media containing the indicated concentration of 3144. Cells were treated for 80 min, after which the medium was replaced with medium containing the indicated concentration of 3144 +/− EGF at 10 ng/mL as indicated. Cells were treated with EGF for 15 min. (C) (top panel) BJeLR cells were treated with 3144 or U0126 as indicated and the amount of c-RAF bound to RAS proteins was determined. The cells were then lysed and the lysate was incubated with CRAF RBD-agarose beads for 2 h before being washed 2× with PBS, denatured and subsequently detected by western blotting. (Bottom panel) Effect of 3144 on RAS-RALGDS pathway. BJeLR cells were seeded in 2% FBS in DMEM 18 h prior to treatment with 3144 and U0126 in 2% FBS in DMEM for 3 h. Cells were then lysed and the lysate was incubated with RalBP1 agarose beads for 2 h before being washed 2× with PBS, denatured and subsequently detected by western blotting. (D) BJeLR cells were seeded in 10% FBS in DMEM 18 hr prior to treatment with 3144 in 10% FBS in DMEM for 3 h, HRAS was immunoprecipitated and the indicated proteins examined for co-precipitation. The relative intensity of each band is indicated. See also Figure S4 and Supporting Information.
We also tested the lethality of 3144 in a panel of 11 cancer cell lines with different RAS isoform mutations and various degrees of RAS dependency—we found that the potency of 3144 correlated with the degree of dependency on the mutated isoform over a 5-fold concentration range, assessed by siRNA-mediated knockdown of the mutated allele (Figure S3); however, at higher concentrations, other lethal mechanisms may operate. In addition, consistent with the fact that RAS-dependent cells have been reported to die by apoptosis upon RAS knockdown, we found that 3144 induced caspase activity to a similar level as staurosporine, a known apoptosis inducer (Figure S3C). As further confirmation of RAS-dependent lethality, we found that the lethality of 3144 was reduced by overexpression of activated alleles of PI3K and/or BRAF in HT-1080 cells (NRASQ61K), which are downstream effectors of RAS proteins (Figure S3F).
We then evaluated 3144 in primary T-cell acute lymphoblastic leukemia (T-ALL) cells cultured in vitro. The compound was tested in two samples containing mutant NRAS (G13V and G13D) as well as in four NRAS wild-type samples (Figure 3D). Selective lethality was observed, with mutant NRAS cells retaining only 20–40% viability after 5 μM treatment, but no observable effect on viability of the four patient samples with wild-type NRAS at this concentration. We also tested whether 3144 was able to prevent growth of RAS mutant cancer cells in an anchorage-independent fashion, which is a more physiologically relevant culture condition. The activity of 3144 was assessed by seeding the breast cancer MDA-MB-231 cell line (KRASG13D) and the colorectal cancer SW480 (KRASG12V) in low-adherence plates, resulting in aggregation into tumor-like spheres. Vehicle-treated cells grew into multicellular tumor spheroids that decreased in size in a dose-dependent manner in the presence of the compound (Figure S3D). To examine the relationship between potency in cells compared to in vitro assays, we measured the accumulation of 3144 in DLD-1 cancer cells, and found that the compound accumulates between 60 and 180 fold in cells (Figure S3E), perhaps explaining its greater potency in some cell lines compared to in vitro assays; however, this effect may vary across cell lines.
Inhibition of RAS signaling pathways in cancer cells by 3144
To determine whether the inhibition of RAS-effector interactions and signaling occurs in cell culture, we examined the ability of 3144 to disrupt RAS-PI3K-AKT and RAS-RAF-MEK-ERK signaling. We found that the Hras−/−; Nras−/−; Krasflox/flox MEFs showed moderately decreased pERK and pAKT abundance after 3144 treatment for 0.6 h, 1 h or 16 h and that BRAF-CAAX-containing MEFs were more resistant to this effect (Fig. 4A); BJeLR (with HRASV12) engineered tumor cells and HT-1080 fibrosarcoma cells (with NRASQ61K) exhibited somewhat decreased pERK and pAKT abundance upon treatment with 3144 (Figure 4B); 3144 also suppressed to a degree EGF-induced pAKT and pERK abundance in these cell lines (Figure 4B). We found decreased CRAF-bound RAS and RALA-GTP (a marker of the RAL-GDS pathway downstream of RAS proteins, Figure 4C, D) upon 3144 treatment of BJeLR cells. These observation suggested that within a range of concentrations in at least several cell lines, 3144 can partially inhibit RAS signaling and cause a degree of RAS-dependent lethality.
3144 has suitable ADME properties for in vivo testing
We sought to test whether compound 3144 would have an acceptable therapeutic index in vivo. Initially, to test whether the compound was sufficiently metabolically stable for in vivo testing, 3144 was incubated with purified mouse and human liver microsomes and its degradation was followed by LC-MS; 3144 was relatively stable over 120 minutes in both human and mouse liver microsomes (Figure 5A). The pharmacokinetics of compound 3144 were measured by analyzing plasma samples from male C57BL6 adult mice after the compound was administered orally (PO), intraperitoneally (IP) or intravenously (IV). After monitoring the concentration of 3144 over 12 hours, we observed suitable pharmacokinetics with all three routes of administration (Figure 5B and Supporting Information), suggesting it would be feasible to test the efficacy of 3144 in mouse cancer models.
Figure 5. 3144 shows activity in a mutant RAS cell line xenograft and a patient-derived T-ALL xenograft.

(A) Stability of 3144 in human liver microsomes: 3144 and 7-ethoxycoumarin were incubated for 120 min with mouse or human liver microsomes and the amount of compound remaining at each time point was quantified by LC-MS. (B) Pharmacokinetics of 3144: male C57BL6 adult mice were dosed orally or intravenously with 3144 in 10% NMP/90% PEG-400 at 30 mg/kg. Concentration in the plasma was measured over the course of 12 h. (C) Effect of 3144 in an MDA-MB-231 xenograft. Eight week old nude female mice were injected with 7 million MDA-MB-231 cells. After tumors reached an average size of 58 cubic millimeters they were treated with vehicle orally (10 doses), 3144 orally (180 mg/kg, 10 doses), or by a combination of intravenous and intraperitoneal injections (30 mg/kg, 4 IV doses, 6 IP doses) over two weeks. (D) Effect of 3144 on a patient-derived T-ALL sample PDTALL22 as a luciferase-expressing xenograft. Mice were randomized into two treatment groups of 5 mice with equal loads of luciferase. Mice were treated with 3144 (30 mg/kg) or vehicle intraperitoneal once daily on days: 0, 1, 4, 5, 7 and 8. (E) Representative images of mice from each treatment group at days, 0, 4 and 8 (final day) of the study in (D), and bar graph representing spleen weight in grams and percentage of human CD45+ cells in the spleen of vehicle and 3144-treated mice. (F) Hematoxylin and eosin immunohistochemistry of spleen sections of mice treated with 3144 compared to vehicle. (G) Pre-treatment analysis (biopsy, Bx) and post-treatment analysis (necropsy, Nx) of tissue samples taken from KPf/fC mice by western blotting for phosphorylated ERK1/2, total ERK1/2, phosphorylated AKT (S473), and total AKT. Samples were taken prior to, or after five days of, treatment from each of three mice receiving either 3144 (30 mg/kg) or vehicle dosed once daily, intraperitoneally. (H) Analysis of phosphorylated ERK1/2 and total ERK1/2, detected by immunohistochemistry. Shown are images from representative sections of the biopsy and necropsy samples from 3144 and vehicle treated mice. See also Figure S5 and Supporting Information.
3144 prevents the growth of a RAS mutant mouse cancer xenografts
The in vivo efficacy of 3144 was initially assessed in a xenograft mouse tumor model using the MDA-MB-231 cell line (KRASG13D) in 8-week-old nude mice starting with relatively small tumors. The compound was administered either orally or via alternating IV and IP injections. Both routes of administration resulted in inhibition of tumor growth over 15 days of treatment (Figure 5C). To evaluate whether 3144 inhibited RAS signaling in vivo, we performed a pharmacodynamic study: after six days of treatment, tumors were analyzed for phosphorylated ERK levels (Figure S5E). 3144-treated mice exhibited somewhat decreased tumor pERK tumor levels compared with vehicle-treated mice.
To test the effect of 3144 in a more physiologically relevant patient-derived xenograft cancer model, we used the PDTALL22 patient T-ALL sample as a luciferase-expressing xenograft. Xenografted mice were imaged after 4 and 8 days of 3144 treatment, and a decrease in tumor burden was observed (Figure 5D). Consistent with the decrease in tumor burden, examination of the spleen revealed a decrease in size with inhibitor treatment, as well as a reduction in the percent of infiltrative human CD45+ cells (Figure 5E). Hematoxylin and eosin staining also showed decreased cellularity, consistent with these results (Figure 5F).
3144 causes inhibition of RAS signaling in the KPf/fC mouse model of pancreatic cancer
Mutations in RAS genes are found in 90% of pancreatic cancers; pancreatic ductal adenocarcinoma is particularly resistant to chemotherapy, as it is known to have a dense, desmoplastic stroma that can limit drug delivery (Oberstein and Olive, 2013). The most commonly used therapeutic agent, gemcitabine, extends patient survival by only a few weeks (Burris et al., 1997). To test whether 3144 could penetrate these difficult to access tumors, we used the KrasLSL.G12D/+Tp53fl/flPdx1-Cre (KPf/fC) mouse model (Bardeesy et al., 2006), which allows for both pancreas-specific expression of KrasG12D and the deletion of p53. This causes the mice to have one functional Kras allele in the remaining tissue in which Cre recombinase is not expressed.
Pre-treatment biopsies were acquired from each mouse by abdominal laparotomy, followed by a day of recovery and treatment with 30 mg/kg 3144 via IP injection. Toxicity was observed in the KPf/f C mice, but not in wild-type mice (Figure S5C, D). This resulted in early termination of the study and efficacy was not evaluated. We attribute the toxicity observed in these mice to the presence of only one functional Kras allele, making them more sensitive to pan-RAS inhibition. This suggests that due to this genetic manipulation, pan-RAS inhibitors cannot be evaluated for efficacy in mice containing one Kras allele.
To test whether compound 3144 inhibited RAS signaling in these mouse pancreatic tumors, we compared pre- and post-treatment tumor samples for markers of RAS inhibition. We observed a decrease for both pAKT (S473) and pERK1/2 (Figure 5G, H) after 3144 administration. A modest increase in cleaved caspase-3 was also observed, showing that in this model, 3144 has the capacity to induce caspase activation (Figure S5A, B). These data suggest that pan-RAS inhibitors developed using this approach may provide probes and candidate therapeutic agents for pancreatic cancers and other RAS-dependent cancers, although the therapeutic index needs to be evaluated more thoroughly for such an approach.
Discussion
Mutations in the RAS family of genes (NRAS, KRAS and HRAS) are common genetic alterations in many cancers; nonetheless, it has been challenging to directly target these proteins with therapeutic agents. Recently, there has been renewed enthusiasm for the potential feasibility of direct targeting of RAS proteins (Burns et al., 2014; Cox et al., 2014; Maurer et al., 2012; Ostrem et al., 2013; Shima et al., 2013; Spiegel et al., 2014; Stephen et al., 2014; Sun et al., 2012; Sun et al., 2014; van Hattum and Waldmann, 2014; Wang et al., 2012; Ward et al., 2012; Weiwer et al., 2012). We hypothesized that computational and biophysical tools would make it feasible to design and test small molecules that interact with the active, GTP-bound state of RAS proteins, blocking binding of effector proteins. It has been noted that recognizing large areas of a protein surface may require multivalent contacts (Hewitt and Wilson, 2016), and that fragment-based drug discovery provides advantages for challenging target classes (Jahnke and Erlanson, 2006). We found that by designing compounds that are predicted to bind simultaneously to two adjacent sites on RAS proteins, it was possible to generate a ligand that has pan-RAS inhibitory activity. Biophysical assays and mutagenesis suggested that this compound, 3144, binds with an affinity in the micromolar range, albeit with potential additional target binding at higher concentrations. This compound also had suitable physicochemical properties for cell penetration, metabolic stability and in vivo administration: we observed that this compound accumulates to a substantial degree in cells in culture, perhaps leading to augmented cellular activity in cells and in mice.
Despite the potential utility of compound 3144 and the approach used in its discovery, we note that we detected toxicity and off-target activity of compound 3144, in vitro, in cells and in mice, suggesting that this compound would need to be optimized to create a pan-RAS inhibitor with greater potency and specificity, or that additional scaffolds would need to be explored that achieve the same end. In addition, the water solubility of 3144 is low, making it challenging to use in some contexts. Nonetheless, the results presented here suggest a possibly useful approach to targeting RAS proteins in human cancers that is complementary to the previously reported strategies of designing covalent G12C-mutant-specific or isoform-specific inhibitors. Moreover, we found that despite the importance of Kras for normal mouse development, a pan-RAS inhibitor can have a suitable therapeutic index in cell culture and in mouse cancer models, possibly due to the varying degrees of RAS addiction of various normal tissues and cancers, upon which the biodistribution and pharmacokinetic and pharmacodynamic profile of a small molecule inhibitor is superimposed. In the case of compound 3144, this resulted in an anti-tumor effect in mice.
In summary, the results described herein suggest that structure-based design of multivalent small molecule ligands for specific proteins may be feasible. This approach resulted in the discovery of a compound with inhibitory activity in primary patient samples and in murine xenograft models. This may ultimately be a means of disrupting the oncogenic functions of proteins in human tumors.
STAR Methods
CONTACT FOR REAGENT AND RESOURCE SHARING
Further information and requests for resources and reagents should be directed to and will be fulfilled by the Lead Contact Brent R. Stockwell (bstockwell@columbia.edu). Columbia University requires that a material transfer agreement (MTA) be signed for transfer of materials. Plasmids and cell lines will be made available through such MTAs, unless precluded by existing MTAs. Small amounts of non-replicating materials (e.g., compounds) will be made available as reference standards when a sufficient supply is available.
EXPERIMENTAL MODEL AND SUBJECT DETAILS
Animal studies
The animals studies reported in this manuscript adhere to the ARRIVE guidelines. All animal study protocols were approved by the Columbia University Institutional Animal Care And Use Committee (IACUC).
Pharmacokinetic analysis in mice
C57BL/6 male mice of 6–7 weeks of age and ~25 g weight (Charles River, strain 027) were acclimated after shipping for >3 days. Mice were weighed before injection to confirm that all mice were 23–25 g and divided into groups of 3 mice per cage. 30 mg of 3144 was dissolved in 6 mL 10% NMP/90% PEG to create a 5 mg/mL solution. The solution was then sterilized using a 0.2 μm syringe filter. Mice were dosed at 20 mg/kg using three different routes, IP, IV, and PO, and samples were collected at 0.5, 2, 4, 8, 12 h, time points, with three mice per time point. At the appropriate time, mice were sacrificed by CO2 asphyxiation for 3 min and ~0.5 mL of blood was collected via cardiac puncture. Blood was immediately put into tubes with K2 EDTA anticoagulant and placed on ice. Samples were centrifuged for 10 min at 4 °C and 2,100 × g, then plasma was transferred to a clean microfuge tube. Plasma samples were flash frozen in liquid nitrogen and stored at −80°C. Additionally, six mice were used as a control and not treated with compound. Plasma from control mice was used to calibrate LC-MS and correct for matrix affects. 3144 concentration was determined in mouse plasma samples using Ultra High Performance Liquid Chromatography-Tandem Mass Spectrometry (UPLC-MS-MS). 3144 was extracted from plasma by mixing 100 μL of plasma samples with 900 μL of acetonitrile. After mixing for 5 min, the mixture was centrifuged for 10 min, the organic layer was transferred to an UPLC-MS vial, dried under a nitrogen stream and reconstituted in 100 μL of 75% methanol with 5 mm ammonium formate. Calibration standards and quality control samples were prepared spanning a range of 10 ng/ml to 250 ng/ml and extracted in the same manner as the samples. UPLC-MS/MS analysis was performed on a platform comprising a triple quadrupole Waters Xevo TQ-S (Waters, Milford, MA) equipped with an electrospray ionization source and integrated with a Waters Acquity UPLC controlled by Mass Lynx Software 4.1. Chromatographic separation was performed by injecting 5 μL of the extract onto a Waters C18 BEH column (2.1 × 50 mm, 1.7 μm, 130 Å) maintained at 50 °C. The flow rate was maintained at 500 μL/min. The initial flow conditions were 90% solvent A (water containing 5mm ammonium formate) and 10% solvent B (methanol containing 5 mm ammonium formate). Solvent B was raised to 50% over 3 min and to 98% by 4 min, lowered to 50% by 5 min and back to initial conditions by 6 min with a total run time of 6.5 min. The retention time for 3144 was 4.26 min. The mass spectrometer was operated under multiple reaction monitoring (MRM) mode with positive electrospray ionization with the following parameters: Capillary voltage: 0.8 Kv, cone gas flow: 150 L/h; desolvation gas: 1000 L/h; and gas temperature: 500 °C. For MRM, following transitions were utilized for quantitation: 717.23>456.21 (quantifier ion) and 717.23>330.29 (qualifier ion). Peak integration and data analysis were performed with Target Lynx 4.1. Lower limit of quantification (LLOQ), defined as the lowest concentration with an accuracy and precision of <20% was determined to be 25 ng/ml. The intra-assay precision for the assay was 9.55%. Non-compartmental pharmacokinetics of compound 3144 were assessed using WinNonlin Pharmacokinetics software (Certara, Princeton, NJ). HL_Lambda_z = terminal half-life (h); Tmax = Time to reach the maximum plasma concentration (h); Cmax = maximum plasma concentration reached (ng/mL); Tlast = last observed concentration (h); Clast = last measured concentration (ng/mL); AUClast = Area under the plasma concentration time curve from t = 0 h until the last measured concentration (h*ng/mL); AUCINFobs = Area under the plasma concentration time curve from t = 0 h until infinity, calculated using the calculated half-life and the last measured concentration (h*ng/mL).
| HL_Lambda_z | Tmax | Cmax | Tlast | Clast | AUClast | AUCINF_obs | |
|---|---|---|---|---|---|---|---|
| h | h | ng/mL | h | ng/mL | h*ng/mL | h*ng/mL | |
| IP | 3.6 +− 1.0 | 0.5 +− 0.9 | 3500 +− 390 | 12 | 81 +− 11 | 9100 +− 3100 | 9700 +− 3000 |
| IV | 6.9 +− 5.0 | 0.5 +− 0.0 | 970 +− 660 | 12 | 86 +− 90 | 2600 +− 1000 | 3400 +− 3200 |
| PO | >12 | 4 +− 2 | 93 +− 37 | 12 | 26 +− 9.1 | 710 +− 2900 | 5649 |
Xenograft therapeutic study in mice
Athymic nude Nu/Nu Crl:NU-Foxn1nu, hairless, albino mice (eight weeks old; Charles River Laboratories, Strain 088) were injected with 7 million MDA-MB-231 cells subcutaneously. After 3 d, mice were separated randomly into treatment groups of roughly equal tumor size (58 mm3) and dosed with 180 mg/kg 3144 orally (12 mg/mL, 10% DMSO, pH 4), vehicle orally, or by a combination of intraperitoneal and intravenous injections at 30 mg/kg (4 mg/mL, 5% DMSO in HBSS at pH 4). Over 14 d, mice received a total of 10 doses of 3144 or vehicle orally, or six intraperitoneal injections and 4 intravenous injections. Tumor size was measured by electronic caliper every 2 d and calculated using the formula: 0.523 × length × width2.
Pharmacodynamic study using MDA-MB-231 cells
Athymic nude mice (eight weeks old; Charles River Laboratories) were injected with 8 million MDA-MB-231 cells subcutaneously. After 4 d, mice were separated into treatment groups of roughly equal tumor size (128 mm3) and population, and dosed with 30 mg/kg 3144 in 5% DMSO HBSS at pH 4 or vehicle (5% DMSO HBSS at pH 4) intraperitoneal, once per day for 6 d. Tumor size was measured by electronic caliper every 2 d and calculated using the formula: 0.523 × length × width2. Mice were euthanized using a CO2 gas chamber before xenograft dissection. Tumors were then weighed, frozen and stored at −80°C. Segments of the tumor (~60 mg) were suspended in 120 uL lysis buffer. Xengrafts were then lysed by sonication (40 amp for 10–15 seconds) and samples were centrifuged at 14,000 rpm at 4°C for 30 min to remove unlysed cells and debris. The supernatant was then analyzed by western blotting.
Patient-derived xenograft study
For this study, animals were maintained in the animal facility at the Irving Cancer Center at Columbia University Medical Campus. Species: Mus musculus (mouse); Strain: Rag2- γc-; Sex: Female; Age: 4 weeks; Weight: 22–24g; Genotype:Il2rgtm1.1Flv Rag2tm1.1Flv; Vendor: Jackson Laboratories; Catalog number: 014593 | Rag2- γc-; Housing: 5 animals per cage. To generate primary xenografts, cells from T-ALL sample PD22, harboring a mutated allele of NRAS, were transplanted via intravenous injection into lethally irradiated primary recipient mice (Chiang et al., 2008). Upon detection of human lymphoblasts (human CD45+ cells) in peripheral blood, mice were sacrificed; lymphoblasts isolated from the spleens were transduced with retroviral particles expressing a fusion protein between the red cherry fluorescent protein and luciferase (MigR1 CherryLUC), and re-injected in sublethally irradiated mice (Piovan et al., 2013). Mice transplanted with retrovirally transduced cells were imaged regularly until luciferase activity was detected. Tumor cells were harvested from the spleens of these mice, and injected into secondary recipient mice. Secondary recipients were randomized into two groups of 5 mice with equal load of luciferase. Animals were treated intraperitoneally with vehicle or 3144 at 30 mg/kg in 5% DMSO in HBSS at pH 4., once daily on days 0, 1, 4, 5, 7 and 8, and imaged at day 0 (before treatment), at day 4 and at day 8. Mice were sacrificed at day 8; spleen weight and presence of human CD45+ cells in the spleen (lymphoblasts) were documented together with changes in luciferase signal over treatment.
KPf/fC mouse pharmacodynamic study
KRASLSL G12D; p53fl/fl; Pdx1-Cre (KPf/fC) mice have been previously described (Bardeesy et al., 2006). Animals were housed in a barrier facility and monitored daily prior to enrollment on studies. KPf/fC were palpated twice weekly to assess for tumor formation. Upon discovery of a palpable mass deemed amenable to surgery, tumors were accessed by abdominal laparotomy as previously described for biopsy procedures (Sastra and Olive, 2014). In short, mice were anesthetized with isofluorane, prepared for aseptic surgery, and injected with buprenorphine intra-operatively to initiate post-operative analgesia. Following visual identification, tumors were held in place with a pair of biopsy forceps while a small-diameter biopsy punch (2-mm diameter, Zivic Instruments PUN2000) was used to cleanly remove a tissue sample. The resultant wound was filled with an absorbable, gelatin-compressed sponge to staunch possible bleeding. Incisions were sutured closed and the mouse was allowed to recover from 24–48 h prior to study initiation. Biopsy samples derived from small animal surgery were divided in two specimens. The first was stored in 10% buffered formalin phosphate overnight at 4 °C and then placed in 70% ethanol for extended storage prior to processing and embedding in paraffin wax blocks. The second was embedded in O.C.T. compound and subsequently frozen atop a bath of liquid N2 prior to long-term storage at −80°C. Tumor samples taken at necropsy were processed and stored identically to those described above. Paraffin embedded samples were sectioned at 5 μM thickness and mounted on positively charged sample slides. These slides were heated at 60 °C for 15–30 minutes and subsequently rehydrated by standard protocols. Unmasking was performed in 10 mM citrate buffer, pH 6.0 for 5 minutes in a pressure cooker at high temperature, followed by peroxidase quench in 3% hydrogen peroxide for 20 minutes. Blocking was carried out using 1.5% horse serum and 2% animal free blocker (Vector Labs) in TBS-T for 1 hour at room temperature. Slides were incubated with primary antibody (cleaved caspase-3, catalog no. 9664; ERK, catalog no. 4695; pERK, catalog no. 4376; all antibodies from Cell Signaling) overnight at 4 °C. Slides were then allowed to equilibrate to room temperature prior to washing with TBS-T and incubation with secondary antibody (ImmPress polymer reagent, Vector Labs). Signal was developed with ImmPACT DAB Peroxidase Substrate (Vector Labs). Slides were counterstained with hematoxylin for 30 seconds. For quantification of cleaved-caspase 3 staining, all available 40× fields on three separate sections of biopsy samples and 20 different 40× fields from two separate sections of necropsy samples were analyzed for each study mouse. Mice were dosed once daily with 40 mg/kg of 3144 in 5% DMSO in Hanks’ Balanced Salt Solution at pH 4.0, via IP injection. Mice were monitored for changes in health and were sacrificed after 5 d on study or once they met endpoint criteria in keeping with IACUC standards.
| WT mouse weights | |||||
|---|---|---|---|---|---|
| days on study | M205 | M206 | M207 | M208 | M287 |
| 1 | 21.36 | 20.39 | 22.08 | 23.6 | 25 |
| 2 | 20 | 18.8 | 20.6 | 22.7 | 23.38 |
| 3 | 20 | 18.4 | 20.1 | 21.87 | 22.16 |
| 4 | 20.77 | 17.4 | 19 | 21.08 | 23 |
| 5 | 20.78 | 17.27 | 18.6 | 21.4 | 22.18 |
| K mouse weights | |||||
|---|---|---|---|---|---|
| days on study | K8225 | K8279 | K8266 | K8267 | K8282 |
| 1 | 19.1 | 14.5 | 22.9 | 26.1 | 18.5 |
| 2 | 18.4 | 14.1 | 21.6 | 24.7 | 17.4 |
| 3 | 18.6 | 14.2 | 20.7 | 23.6 | 17 |
| 4 | 17.5 | 14.2 | 20.1 | 23.27 | 17.7 |
| 5 | 17.5 | 13.63 | 19.8 | 22.7-x | 16.5 |
| KC mouse weights | |||||
|---|---|---|---|---|---|
| days on study | K8072 | K8069 | K8073 | K7923 | K7916 |
| 1 | 33 | 30.5 | 30.7 | 33.5 | 35.8 |
| 2 | 32.2 | 28.1-x | 27.8 | 33.5 | 34.5 |
| 3 | 29.9 | 24.84 | 32 | 26.86-x | |
| 4 | 28.8 | 23.6-x | 30.5 | ||
| 5 | 28.5 | 30.2 | |||
x indicated day on which animal was sacrificed due to reaching endpoint criteria
Human patient T-ALL samples
T-ALL samples were provided by Columbia Presbyterian Hospital, the Eastern Cooperative Oncology Group (ECOG), University of Padova, and Hospital Central de Asturias with informed consent and analyzed under the supervision of the Columbia University Medical Center Institutional Review Board committee. For the analysis of 3144 on primary T-ALL patient samples, cells were cultured medium supplemented with 10% FBS, 10% human heat-inactivated serum, 1% penicillin/streptomycin, 1% GlutaMAX, human IL-7 (10 ng/mL), human SCF (50 ng/mL), human FLT3-ligand (20 ng/mL), and insulin (20 nmol/L) on a feeder layer of MS5 stromal cells overexpressing the NOTCH ligand Delta-like 1. In these experiments, 250,000 T-ALL lymphoblasts were cultured in each well of a 24-well plate in triplicate and treated with either vehicle (DMSO), or 3144 (ranging from 1 to 5 μM). We harvested the cells 72 h after treatment and analyzed cell viability using the BD cell viability kit with liquid counting beads (BD Bioscience), gating out stromal cells (GFP+), dead cells and particles (defined as PI+). We acquired data using a FACSCanto II flow cytometer (BD Bioscience) and analyzed it using FlowJo software (Tree Star, Inc.). Viability data are represented as percent relative to vehicle treatment. A region of 124 bp from coding exon 1 of the human NRAS gene, including G12–G13 mutation hotspot, was amplified from the genomic DNA of six primary T-ALL samples by polymerase chain reaction and was analyzed by direct dideoxynucleotide sequencing using primers FW: 5′-GCTGGTGTGAAATGACT-3′ and. RV: 5′-GCTACCACTGGGCCTCACCT-3′. PDTALL 22 synonymous variants GCA/GCT (A); GGT/GTT (G13) (G13V). PDTALL26 missense variant GGT/GAT (G13) (G13D).
Cell lines and bacterial strains
Sources of cell lines
Phoenix-AMPHO cells were from ATCC (catalog number CRL-3213). Kraslox/lox, Hras−/−, Nras−/− RERTnert/ert mouse embryo fibroblasts (MEFs) were from the laboratory of Mariano Barbacid (#DU315–6) and were authenticated by blotting for RAS proteins. Hras−/−; Nras−/−; Kraslox/lox BRAF(V600E)-CAAX MEFs were generated as described below. DLD-1 colon cancer cells were from ATCC (catalog number CCL-221). MDA-MB-231 cells were from ATCC (catalog number HTB-26). BL21-Gold (DE3) competent E. coli cells were from Stratagene (catalog number 230132). Cell lines obtained from ATCC were not further authenticated.
Generation of RAS-less Mouse Embryo Fibroblasts expressing BRAFV600E-CAAX
A BRAFCAAX plasmid was created by inserting a CAAX motif (cloned from pLL7.0: Venus-iLID-CAAX, Addgene, Plasmid #60411) into pBabe-Puro-BRAF-V600E plasmid (Addgene, Plasmid #15269). pBABE-puro plasmid was obtained from Addgene, Plasmid #1764. Retroviruses were generated by transfection of plasmids into Phoenix-AMPHO (ATCC: CRL-3213) cells using Lipofectamine 2000. The retroviruses were transfected into Hras−/−; Nras−/−; Kraslox/lox MEFs (from Mariano Barbacid) followed by 2 weeks of puromycin (1 ug/mL) selection. MEFs transfected with empty pBABE-puro were used in Presto blue assays and western blotting. To generate BRAFCAAX MEFs, the MEFs were then cultured in the presence of (Z)-4-hydroxytamoxifen (4OHT) (Sigma, 600 nM) for another 2 weeks to remove the endogenous Kras. The obtained BRAFCAAX MEFs were then used in Presto blue assays and western blotting. Phoenix-AMPHO (ATCC: CRL-3213) cells were seeded in a 6-well plate at 800,000 cells/well in 10% fetal bovine serum (FBS), 1% PS, and 2 mM L-glutamine in DMEM. After 20 h, the medium was changed to 800 uL Opti-mem in each well. A solution of Lipofectamine 2000 (6 μL) in 100 μL Opti-mem media (reduced serum media) and the plasmid (2.5 μg) in 100 μL Opti-mem media were combined and incubated 20 min at 25 °C, then added to each well. After 4 h, 1 mL Opti-mem with 20% FBS was added to each well. 24 h later, the medium was replaced with 10% FBS, 1% P/S, 2 mM L-glutamine in DMEM. The next day the supernatant was collected three times spaced 4 h apart and polybrene was added (1/1000). The supernatant was filtered (0.45 μm filters) and added to MEFs seeded at 160,000 cells per well (6-well dish) in 2 mL portions spaced 4 h apart. After 48 h, the cells were trypsinized and re-seeded in medium containing puromycin (1 μg/mL). After 2 weeks of selection with puromycin, the MEFs were cultured in the presence of (Z)-4-hydroxytaoxifen (4OHT) (Sigma, 600nM) for another 2 weeks to ablate the endogenous Kras. The MEFs were then used in Presto-blue assay and western blot. CAAX motif sequence: CATAATTACACACTTTGTCTTTGACTTCTTTTTCTTCTTTTTGCTCCCACTCCCGCTTCC
METHOD DETAILS
Viability assay in Mouse Embryo Fibroblasts
Mouse embryo fibroblasts in which Nras and Hras had been deleted and only one floxed allele of Kras remained (DU315–6, gift from Mariano Barbacid) were transfected with either empty vector or a BRAFV600E expression vector and 4-OHT selection to eliminate Kras, as described above. Cells were trypsinized, counted, and seeded into 384-well plates at 30,000 cells/well in serum-free medium. After 16 h, compounds (from 10 mM stocks in DMSO) were arrayed in a 10-point 2-fold dilution series in 384-well polypropylene plates. Compound solutions were transferred at a 1:5 dilution into assay plates. After 48 h, a 50% Presto blue solution was added to a final concentration of 10% Presto blue. After 6 h of incubation, fluorescence intensity was determined using a Victor3 plate reader (Perkin Elmer) with a 535 nm excitation filter and a 590 nm emission filter. All compound measurements were performed in duplicate.
Western blots of Mouse Embryo Fibroblasts
0.25 million cells/well were seeded in DMEM with 1× Glutamax, 10% heat-inactivated FBS, and 1% P/S. After the cells grew to 80% confluence, the medium was changed to serum-free medium, and the cells incubated for 24 h. The medium was changed to serum-free medium with compounds (5 μM 3144 for 35 min, 1 h or 2 μM 3144 for 16 h to prevent the cells from dying before protein could be extracted at 16h). The cells were stimulated with human EGF (10 ng/ml) for 15 min to stimulate RAS-dependent pERK and pAKT signaling. Then the cells were washed with cold PBS and lysed. For quantitation, the background value of the scanned gel was subtracted, and the relative abundance was determined by:
pErk = (pErk/Tubulin)/(total Erk/Tubulin)
pAkt = (pAkt/Tubullin)/(totalAkt/Tubulin)
which was then normalized to the DMSO control.
Pan-RAS siRNA knockdown and treatment with 3144
DLD-1 cells were reverse transfected with siRNA pools targeting three RAS isoforms (HRAS, KRAS, NRAS) following manufacturer’s instructions. In brief: for each well of a 6 well plate, 3.33 μL each of SMARTpool: ON-TARGETplus siRNAs (10mM; Dharmacon) targeting HRAS, KRAS, and NRAS were combined into 250 μL of Opti-mem serum-free media in a 1.5 mL Eppendorf microfuge tube. In a separate tube, 6 μL of Lipofectamine RNAi/MAX was added to 250 μL of Opti-mem media, and both tubes were allowed to equilibrate at RT for 5 min. The contents of the two tubes were combined, and dispensed into wells of a 6-well plate and incubated for 20 min at 37 °C. To evaluate whether siRNAs affect cell viability or the response to 3144, a control group of DLD-1 cells was transfected with an equivalent volume of ON-TARGETplus Non-targeting Pool siRNAs (Dharmacon), following the same method. After incubation, 2 mL of DLD-1 cells growing in RPMI media (10% FBS, 1% P/S) were added to each well at a concentration of 0.125 × 10⁶ cells/mL. The plate was incubated for 72 h, after which the cells were washed with PBS, trypsinized, resuspended in RPMI media (10% FBS, 1% P/S), and counted on a Vi-Cell XR Cell Viability Analyzer (Beckman Coulter). At this time, approximately 1×10⁶ cells were sampled to evaluate RAS knockdown via western blot. Remaining cells were spun down at 125 × g for 5 min, after which the pellet was re-suspended in serum-free RPMI medium at 0.277 × 10⁶ cells/mL. From this, 36 μL was added to each well in a 384-well plate, totaling 10,000 cells/well, and plates were incubated overnight. The following day, dilution series of 3144 and MG132 were created in Opti-mem serum-free media at a 10× concentrated stock solution. 4 μL was then added to each well of the 384-well plate, totaling 40 μL final volume in each well. The 384-well plate was incubated for 24 h, after which cell viability was measured using the CellTiter-Glo® Luminescent Cell Viability Assay (Promega).
Microsomal Stability Assay
To an Eppendorf microfuge tube was added phosphate buffer (182.2 μL, pH 7.4, 100 mM) followed by addition of NADPH-regenerating system system solution A (10 μL), and NADPH regenerating system solution B (2 μL) (Corning Gentest 3P NADPH regenerating system solution A (#451220) and B (#451200)). A stock solution of 3144 (0.8 μL. 5 mM) or 7-ethoxycoumarin (positive control, 0.8 μL, 5 mM) was added and the mixture was warmed to 37 °C for 5 minutes. Mouse microsomes (CD-1, 20 mg/mL, Life Technologies) or human microsomes (pooled 50 donors, 20 mg/mL, Thermo Fisher Scientific) (5 μL, thawed in 37 °C water bath before use) were added. At selected time points (0, 15, 30, 45, 60 and 120 minutes) aliquots (15 μL) were withdrawn from the tube and quenched upon addition to cold acetonitrile (60 μL), containing an internal standard (5 μM) in an Eppendorf microfuge tube. The samples were centrifuged at 13,000 rpm for 10 minutes at 4 °C. The supernatant (40 μL) was withdrawn and transferred to a sample vial with insert. The samples were analyzed by LC-MS. LC-MS analysis was performed on a platform comprising a Thermo Scientific Dionex Ultimate 3000 and a Bruker amaZon SL equipped with an electrospray ionization source controlled by Bruker Hystar 3.2. Chromatographic separation was performed by injecting 5 μL of the sample onto an Agilent Eclipse Plus C18 column (2.1 × 50 mm, 3.5 μm) maintained at 20 °C. The flow rate was maintained at 400 μL/min. The initial flow conditions were 60% solvent A (water containing 0.1% acetic acid) and 40% solvent B (methanol containing 0.1% acetic acid). Solvent B was raised to 60% over 0.25 minutes and to 70% by 6.75 minutes. Solvent B was raised to 95% by 7.00 minutes and lowered back to initial conditions (40%) by 8.00 minutes with a total run time of 9.00 minutes. The retention time for 3144 was 1.7 minutes.
Software and Computational Methods
Molecular docking and modeling was performed using Glide (versions 2012–2016, Schrödinger, Inc.) and Molecular Operating Environment [MOE] (Chemical Computing Group). All chemical structures were drawn using ChemDraw Ultra version 10.0 (Perkin Elmer). All statistical analyses, potency determinations, and viability curves were produced using Prism 5.0c (GraphPad Software). Libraries of commercially available compounds were compiled from the inventories of Asinex, Enamine, Chembridge, ChemDiv, IBS, Life, Maybridge and TimTec. A fragment subset of ~60,000 compounds was selected using the following filter criteria: LogP <3, hydrogen bond acceptors ≤ 3, hydrogen bond donors ≤ 3, molecular weight <300, aqueous solubility > 0.5 mM. Chemical descriptors were calculated using MOE (Chemical Computing Group). Designed libraries of synthetically accessible compounds were compiled using selected commercially available reagents from the inventory of Sigma-Aldrich and Chem-Impex using the Combigen application in MOE (Chemical Computing Group).
Solubility of compound 3144
We saw no visible precipitation of compound 3144 up to 250 μM in aqueous buffers (e.g., phosphate buffered saline) at room temperature with 1.5% DMSO. However, solubility in aqueous solutions was often less than anticipated based on measured concentrations in solution, sometimes as low as 5 μM.
Cell viability assays
Cell culture assays were incubated at 37°C with 5% CO2, using media recipes specified by ATCC. For 384-well cancer cell viability assays, cells were trypsinized, counted, and seeded into 384-well plates at 1,000 cells/well, unless otherwise specified. After 16 h, compounds (from 10 mM stocks in DMSO) were arrayed in an 8-point or 16-point dilution series in 384-well polypropylene plates. Compound solutions were transferred at a 1:5 dilution into the assay plates. After 48 h, a 50% Alamar blue solution was added to a final concentration of 10% Alamar blue. After 6 h of incubation, fluorescence intensity was determined using a Victor3 plate reader (Perkin Elmer) with a 535 nm excitation filter and a 590 nm emission filter. All 384w measurements were performed in triplicate. For 6 well format, cells were trypsinized, counted, and seeded into 6-well plates at 200,000 cells per well 16 h prior to use. Medium was then aspirated and replaced with 2 mL of media containing compounds at the indicated concentrations (from 10 mM stocks in DMSO). After 24 h, cells were trypsinized and viability was determined using Trypan Blue exclusion (Vi-Cell).
Western blots
Cells were seeded in DMEM and 10% FBS with 1% penicillin and streptomycin (PS) or DMEM and 2% FBS with 1% penicillin and streptomycin (P/S), 16 h prior to use. The medium was then aspirated and compounds added as solutions in serum free medium (DMEM with 1% PS) or DMEM and 2% FBS with 1% penicillin and streptomycin (PS) to the dishes and treated at the indicated time points. Following treatment, the medium was aspirated from each dish and cells washed twice with PBS. Cells were lysed with 60 μl buffer (50 mM HEPES, 40 mM NaCl, 2 mM EDTA, 0.5% Triton-X, 1.5 mM sodium orthovanadate, 50 mM NaF, 10 mM sodium pyrophosphate, 10 mM sodium β-glycerophosphate and protease inhibitor tablet (Roche), pH 7.4). Unlysed cells and debris were pelleted for 12 min at 12,000 rpm at 4° C. Samples were separated using SDS-PAGE and transferred to a polyvinylidene difluoride membrane. Transfer was performed using the iBlot system (Invitrogen). Membranes were treated with Li-COR Odyssey blocking buffer for 1 h at 25°C, then incubated with primary antibody (1:1000) in a 1:1 solution of PBS-T and Li-COR odyssey blocking buffer overnight at 4°C. Following three 5 min washes in PBS-T, the membrane was incubated with secondary antibodies (1:2000) in a 1:1 solution of PBS-T and Li-COR Odyssey blocking buffer for 45 min at 25 °C. Following three 5 min washes in PBS-T, the membrane was scanned using the Li-COR Odyssey Imaging System. Antibodies for pERK1/2, ERK1/2, pAKT ser473, AKT, pan-RAS, Technology, PI3Kgamma (Cell Signaling), and RAF-1 (Santa Cruz) were detected using a goat anti-rabbit or goat anti-mouse IgG antibody conjugated to an IRdye at 800CW and 680CW conjugated, respectively (Li-COR Biosciences).
Molecular cloning, protein expression, and purification
Human KRAS4B sequence containing the oncogenic Q61H mutation in pENTR221 vector was purchased from Invitrogen (Ultimate ORF Clone IOH9852). To generate the wild-type KRAS sequence, H61Q back mutation was introduced using QuikChange II site-directed mutagenesis (Agilent Technologies) and confirmed by DNA sequencing (GeneWiz, Inc.). Wild-type KRAS4B sequence encoding the catalytic domain (amino acids 1–169 in KRAS) was amplified by PCR and cloned into Nde I-BamH I sites of pET-15b vector (Novagen) containing the N-terminal His6 tag. A G12D point mutation was introduced using QuikChange II site-directed mutagenesis (Agilent Technologies). DNA sequencing was performed to confirm the correct amino acid sequence of the construct (GeneWiz, Inc.). Mutagenesis of the KRASG12D plasmid was performed using a QuikChange XL site-directed mutagenesis kit. Primers were designed using the Agilent QuikChange Primer Design application and purchased from Integrated DNA Technologies. KRASG12D D38A forward primer 5′ ATA TGA TCC AAC AAT AGA GGC TTC CTA CAG GAA GCA AGT AG 3′, KRASG12D D38A reverse primer 5′ CTA CTT GCT TCC TGT AGG AAG CCT CTA TTG TTG GAT CAT AT 3′, KRASG12D I36N forward primer 5′ CAT TTT GTG GAC GAA TAT GAT CCA ACA AAT GAG GAT TCC TAC AGG 3′, KRASG12D I36N reverse primer 5′ CCT GTA GGA ATC CTC ATT TGT TGG ATC ATA TTC GTC CAC AAA ATG 3′. DNA sequencing was performed to confirm the correct amino acid sequence of the construct (GeneWiz, Inc.).
Nucleotide exchange
Nucleotides in endogenous recombinant KRAS were exchanged with GDP, GTP or GppNHp using an EDTA-loading procedure. KRASG12D protein (250 μM final) was incubated with 40-fold molar excess of EDTA (10 mM final), and 75-fold molar excess of new nucleotide (18.75 mM final) for 2 h at 30 °C. After incubation, the sample was put on ice for two min and then MgCl2 was added (65 mM final) to stop the reaction. To remove excess unbound nucleotide, the sample was added to a NAP-5 column (GE Life Sciences) equilibrated with Buffer A (25 mM HEPES, 100 mM NaCl, 2 mM TCEP, pH 7.5) and eluted with Buffer A at three drops per fraction. Eluted fractions were evaluated using a Bradford dye-binding method for the presence of protein and those containing protein were concentrated. For NMR studies, the samples were buffer exchanged into NMR Buffer (50 mM HEPES, 50 mM NaCl, 2 mM TCEP, 2 mM MgCl2, pH 7.4) using a Millipore spin column (13,900 × g for seven min at 4 °C, repeated six times, each time adding fresh buffer and discarding the flow-through). Protein concentration was determined using absorbance at 280 nm with extinction coefficient of 11920 M−1 cm−1 (calculated using ExPASy ProtParam tool).
Cell-based RAS pulldown
BJeLR cells were seeded 16 h prior to use in 10% FBS in DMEM. The medium was then aspirated and replaced with serum-free medium containing the inhibitors (from 10 mM DMSO stocks) and cells were incubated for 24 h. The medium was removed, washed with cold PBS, lysed and spun down at 13,000 rpm at 4 °C to remove unlysed cells and debris. The lysate was incubated with Raf-1 RBD agarose beads (EMD Millipore) for 2 h with rotation at 4°C. The solution was then spun down at 1500 × g and the supernatant removed. The beads were washed 2× with PBS, resuspended in 2.5 × SDS, and then analyzed by western blotting procedure.
Determining cellular concentrations of compound 3144
DLD-1 cells were grown in RPMI media containing 10% FBS and seeded in 6-well plates at a density of 0.4 × 10⁶ cells/well, followed by overnight incubation. On the following day, the growth medium was removed and the cells were rinsed twice with PBS, then RPMI growth medium was added, either with or without 10% FBS. Cells were treated for 4 h with 3144 (0.5 μM or 5 μM). After treatment, the growth medium was removed and cells rinsed with PBS, trypsinized and suspended in serum-free RPMI medium. Cells were counted on a Vi-Cell XR Cell Viability Analyzer (Beckman Coulter), and the average diameter was recorded. An aliquot of the appropriate volume of cell suspension (1.0 × 10⁶ cells per sample) was transferred to a 15 mL Falcon tube (3 samples each). The cells were pelleted at 1,000 × g for 5 min. The cells were washed twice with PBS and transferred to a 1.5 mL Eppendorf microfuge tube. The cells were pelleted at 3,000 rpm for 3 min, after which the PBS was removed and the pellet frozen at −80°C.
The cell pellet was defrosted and 150 μL of methanol/acetonitrile (1:1) was added, the suspension sonicated for 10 sec, and the compound extracted overnight at 4°C. The samples were spun at 1,400 × g for 75 min at 4°C, and the supernatant (75 μL) was withdrawn and transferred to a sample vial with insert. The samples were analyzed by liquid chromatography mass spectrometry (LC-MS). LC-MS analysis was performed on a platform comprising a Thermo Scientific Dionex Ultimate 3000 and a Bruker amaZon SL equipped with an electrospray ionization source controlled by Bruker Hystar 3.2. Chromatographic separation was performed by injecting the sample on an Agilent Eclipse Plus C18 column (2.1 × 50 mm, 3.5 μm) at 20 °C. The flow rate was maintained at 400 μL/min. The initial flow conditions were 60% solvent A (water containing 0.1% acetic acid) and 40% solvent B (methanol containing 0.1% acetic acid). Solvent B was raised to 60% over 0.25 minutes and to 70% by 6.75 minutes. Solvent B was raised to 95% by 7.00 minutes and lowered back to initial conditions (40%) by 8.00 minutes with a total run time of 9.00 minutes. The retention time for 3144 was 1.7 minutes. The peak area was converted to a concentration using a standard curve and the intracellular concentration was determined using the formula (Colletti et al., 2008):
Microscale thermophoresis (MST) with KRASG12D
KRASG12D (250 μM) in 25 mM HEPES, 100 mM sodium chloride, 20 mM EDTA and 1 mM GppNHp was shaken at 220 rpm at 30 °C to remove the endogenous nucleotide. The solution was placed on ice for 2 min prior to the addition of 65 mM MgCl2. After an additional 10 min incubation on ice, 200 μL of a 10 μM solution of KRASG12D was combined with 200 μL of a 20 μM solution of NT-647-NHS-ester dye (from a 652.4 μM stock). The protein/dye mixture was rotated at 4°C for 30 min, before being separated from the excess dye and buffer exchanged into 25 mM Tris, 100 mM sodium chloride, 2 mM TCEP, and 5 mM MgCl2 via a NAP-5 column. The compounds were arrayed across a 16-point dilution series consisting of 1.5% DMSO with 25 mM Tris, 100 mM NaCl, 2 mM TCEP, 5 mM MgCl2 and 0.05% Tween-20. Thermophoretic movement of the fluorescently labeled protein with the inhibitors was performed using a Monolith NT.115 (Nanotemper Technologies). It is formally possible that ligands such as 3144 induce the formation of an inactive GDP conformation of RAS proteins, resulting in the loss of effector binding.
MST experiments with RAS GTPases
RALA and RHOA were obtained from Abcam (RALA CN:ab102555, RHOA CN:ab101594). RRAS, RRAS2, and RAP1A were purchased from ProSpecBio. KRASWT and NRASWT were purchased from Cell Biolabs. HRASWT was acquired from Enzo Life Sciences. To load GppNHp nucleotide, each GTPase (10 μM final) was incubated with 100-fold molar excess of EDTA (1 mM final), and 1000-fold molar excess of GppNHp (10 mM final) for 2 h at 30 °C. After incubation, the sample was put on ice for 2 min and then MgCl2 was added (65 mM final concentration) to stop the reaction. Excess nucleotide and TCEP was removed using 10 kDa Millipore spin column (13,900 × g for 7 min at 4°C, repeated six times) and buffer exchanged into Buffer C (25 mM HEPES pH 7.5, 100 mM NaCl). Protein concentration was determined using absorbance at 280 nm and extinction coefficient determined for each protein based on its sequence. For fluorescence labeling of proteins, a cysteine-reactive dye, NT-647-Red-Maleimide (Nanotemper Technologies), was dissolved in PBS+T buffer (PBS with 0.05% Tween-20) to make a 705 μM stock and added at five molar excess to protein solution. The protein/dye mixture was rotated at 4 °C for 24 h. To remove excess unbound dye, the sample was added to a NAP-5 column (GE Life Sciences) equilibrated with PBS+D buffer (PBS with 3 mM DTT) and eluted with PBS+D buffer at three drops per fraction. The first four eluted fractions were combined and further washed with PBS+D buffer using Millipore spin column (13,900 × g for 7 min at 4°C, repeated three times). The binding affinity between 3144 and GTPases-labeled with NT647 was analyzed on a Monolith NT.115 instrument (Nanotemper Technologies). 16-point serial dilutions of compound 3144 were prepared in MST buffer (PBS with 3 mM DTT, 0.05% Tween-20, and 0.2% Prionex) supplemented with 1.5% DMSO and mixed 1:1 with GTPase solution in final volume of 20 μL. Reaction mixture were loaded into standard treated capillaries and analyzed by MST at 40% MST power and 95% LED power with a laser-on time of 5 sec. The KD was calculated by taking the average of triplicate Fnorm measurements at each concentration and fitting the data to a sigmoidal four parameter fitting function in Prism (GraphPad Software).
Differential Scanning Fluorimetry
A fluorescent thermal shift assay was used to confirm the success of nucleotide exchange procedure of all GTPases used in the study. The assay was carried out in triplicate in Fast 96-well optical plates containing 5 μM protein and 5× SYPRO Orange dye (Invitrogen) in 20 μL total volume/well. Samples were heated at 3°C/min from 25°C to 95°C and protein unfolding was observed by monitoring the fluorescence of SYPRO Orange dye at 470 nm excitation and 623 nm emission using ViiA7 real-time PCR machine (Applied Biosystems). Each GTPase with endogenous nucleotide was used on the same plate as a reference for the shift in melting temperature (Tm) with the new nucleotide. All experiments were performed in triplicate. Data were analyzed using Protein Thermal Shift™ Software (Applied Biosystems) to determine the Tm of each well.
19F NMR Spectroscopy
19F NMR experiments were performed on Bruker Avance III 400 (400 MHz) spectrometer (Columbia University) at 300°K in FPLC buffer (25 mM Tris-HCl pH 8, 100 mM NaCl, 5 mM MgCl2, and 1 mM TCEP) with 10% D2O. Potassium fluoride (KF) and trifluoroacetic acid (TFA) were used as internal standards in all samples.
Isothermal titration calorimetry (ITC)
All ITC experiments were carried out at 25°C on MicroCal Auto-ITC200 system (GE Healthcare). Due to low solubility of 3144 in aqueous buffers, the compound was loaded into a cell and the KRASG12D•GppNHp protein was loaded into a syringe. Working stocks of compound 3144 were prepared in 100% DMSO at 20 mM. 450 μL of the compound solution was loaded into cell at 200 μM in ITC buffer (25 mM Tris pH 8.0, 1 mM TCEP, 100 mM NaCl, 5 mM MgCl2, 0.05% Tween-20) with final DMSO concentration at 1.25% (v/v). KRASG12D•GppNHp was buffer exchanged into same ITC buffer using Amicon Ultra 10 kDa size exclusion filter spin columns (buffer replaced with ITC buffer four times). Prior to loading 130 μL of KRASG12D•GppNHp into the syringe at 2.0 mM, DMSO was added to match the amount of DMSO present in the cell. ITC titration experiments were carried out at 25°C with 19 injections, 2 μl per injection, and 180 seconds between each injection. Reference cell power was set to 5 μcal/sec. Control experiments were performed in which ITC buffer was titrated into compound 3144 alone to account for heat released due to dilution. This background was subtracted from test data before final dissociation constant was calculated. Data were analyzed using a one-site binding model in Origin 7.1 software. The dissociation constant, KD, was calculated according to equation KD = 1/KA. Gibbs free energy, ΔG, was calculated from equation ΔG = −RTlnKA. In addition, −TΔS was calculated from equation ΔG = ΔH−TΔS. All other parameters, KA, n, ΔH, were determined from the titration data.
Protein NMR Spectroscopy
Uniformly 15N-labeled KRASG12D protein with N-terminal His6 tag was prepared. The KRASG12D construct was expressed in Escherichia coli BL21-Gold (DE3) cells (Stratagene) growing at 37 °C in M9 minimal medium supplemented with 100 μg/mL ampicillin, 2 mM MgSO4, 100 μM CaCl2, 1× trace metals, 1× RPMI 1640 vitamin stock (Sigma-Aldrich, cat. R7256), 10 μg/mL biotin, 10 μg/mL thiamine hydrochloride, and 3 g/L 15NH4Cl as the sole nitrogen source. When OD600nm reached 0.9, protein expression was induced with 1 mM isopropyl β-D-thiogalactoside at 15 °C overnight. Cells were pelleted and lysed by sonication in buffer containing 10 mM Tris-HCl, 500 mM NaCl, 5 mM imidazole, 5 mM MgCl2, pH 7.5, 0.5 % CHAPS (w/v), protease inhibitor tablet (Sigma-Aldrich, cat. 11836170001), and 1 mM TCEP. Cell lysate was then centrifuged at 15,000 × g for 45 min at 4 °C. KRASG12D was first purified from cell lysate using Ni Sepharose 6 Fast Flow beads (GE Life Sciences) and then using a gel filtration Superdex 100 column. The fractions containing KRASG12D were pooled together and verified by SDS-PAGE. Thrombin was added at 5 U/mg protein to cleave the N-terminal His6 tag. The reaction was allowed to proceed overnight at 4 °C. The next day, protein solution was passed over Ni-Sepharose 6 Fast Flow beads (GE Life Sciences) and flowthrough containing the 15N-labeled KRASG12D protein without histidine tag was concentrated and flash frozen. Purity was checked by SDS-PAGE gel. For biochemical studies, KRASG12D construct was expressed in Escherichia coli BL21-Gold (DE3) cells (Stratagene) growing at 37 °C in LB media with 100 μg/mL ampicillin and induced when the OD600nm reached 1.0, with 1 mM isopropyl β-D-thiogalactoside at 15 °C overnight. Protein purification was the same as for the 15N-labeled protein, except the N-terminal His6 tag was not removed.
1H-15N HSQC experiments were performed on Bruker Avance III 500 (500 MHz) and Avance III 500 Ascend (500 MHz) spectrometers (Columbia University) at 298 K. Uniformly 15N-labeled KRASG12D was dissolved at 50 μM in NMR Buffer (50 mM HEPES pH 7.4, 50 mM NaCl, 2 mM MgCl2, 2 mM TCEP, and 10% D2O). The 1H carrier frequency was positioned at the water resonance. The 15N carrier frequency was positioned at 115 ppm. The spectral width in the 1H dimension was 8,012 Hz, and the width in ω2 (15N) dimension was 4,054 Hz. Suppression of the water signal was accomplished using the WATERGATE sequence. Heteronuclear decoupling was accomplished using the GARP decoupling scheme. Assignments of wild-type KRAS loaded with GDP were previously published (Vo et al., 2013). We used the conditions reported to efficiently transfer the assignments to the peaks of our 1H-15N HSQC spectrum of the KRASG12D-GDP protein. To verify assignments, we performed 3D-1H-15N-1H-NOESY-HSQC and 3D-1H-15N-1H-TOCSY-HSQC experiments on KRASG12D. The 3D NMR experiments were performed on Bruker Avance US2 800 (800 MHz) and Bruker Avance III 600 (600 MHz) spectrometers equipped with 5-mm TXI cryogenic probes (New York Structural Biology Center). The 15N-NOESY-HSQC and 15N-TOCSY-HSQC spectra were recorded at 298 K on uniformly 15N-labeled KRASG12D at 500 μM in NMR Buffer. The 1H carrier frequency was positioned at the water resonance. The 15N carrier frequency was positioned at 117 ppm. The spectral width in the 1H dimension was 8,402 Hz, the width in ω2 (15N) dimension was 2,554 Hz, and the width in ω3 was 8,389 Hz. The 15N-NOESY-HSQC was recorded with a mixing time of 150 ms. The 15N-TOCSY-HSQC spectra were recorded using DIPSI-2 mixing time of 70 ms. The TOCSY-HSQC spectrum was recorded with gradient enhancement. All data were processed and analyzed using TopSpin 3.1 (Bruker) and Sparky (Developed by T. D. Goddard and D. G. Kneller, UCSF). The mean chemical shift difference for 1H and 15N (Δ δNH) was calculated using:
Protein crystallization
In attempts to elucidate the binding mode of the compound to oncogenic KRAS, we crystallized the G12D mutant in complex with Mg-GDP or Mg-GDPNP, as well as the G12V mutant in complex with Mg-GDP, and collected X-ray diffraction data at 1.83, 1.95, and 1.5 Å resolution, respectively (Table S1). However, no electron density was observed for the compound after extensive efforts, including both co-crystallization and soaking experiments. The overall structures of the protein and the detailed binding modes of the guanine nucleotide are similar to those reported previously. For structural studies, KRASG12D construct was expressed in Escherichia coli BL21-Gold (DE3) cells growing at 37°C in LB media with 100 μg/mL ampicillin and induced when OD600nm reached 1.0, with 1 mM isopropyl β-D-thiogalactoside at 15°C overnight. Cells were pelleted and lysed by sonication in lysis buffer containing 10 mM Tris-HCl, 500 mM NaCl, 5 mM imidazole, 5 mM MgCl2, pH 7.5, 0.5 % CHAPS (w/v), 1 mM TCEP and complete EDTA-free protease inhibitor tablets (Roche). Cell lysate was then centrifuged at 15,000 x g for 45 min at 4°C and loaded onto a chromatography column packed with Ni Sepharose 6 Fast Flow beads (GE Life Sciences) in buffer containing 10 mM Tris-HCl, 500 mM NaCl, 5 mM imidazole, 5 mM MgCl2, pH 7.5, and 1mM TCEP. KRASG12D was eluted with 250 mM imidazole in the same buffer. The eluted KRASG12D was further purified using gel filtration Superdex 100 column in FPLC buffer (25 mM Tris-HCl pH 8, 100 mM NaCl, 5 mM MgCl2, and 1 mM TCEP). The fractions containing KRASG12D were pooled together and verified by SDS-PAGE. Protein concentration was determined using absorbance at 280 nm with extinction coefficient of 11,920 M−1 cm−1. To generate the GppNHp-protein crystals, KRASG12D was treated with ten molar excess of EDTA for 1 h at room temperature and then buffer exchanged into buffer B (25 mM Tris-HCl pH 8, 100 mM NaCl, 0.1 mM ZnCl2, 5 mM MgCl2, 1mM TCEP), supplemented with 10 mM GppNHp and treated with 250 UN alkaline phosphatase on agar beads (Sigma-Aldrich, cat P0762) for 18 h at 4 °C. The next day, the alkaline phosphatase beads were removed and KRASG12D dialyzed into FPLC buffer. Diffraction quality crystals were grown at 20 °C from 0.5 + 0.5 μL sitting drops for vapor diffusion. For the G12V-Mg-GDP crystal, the drop contained 70 mg/mL KRASG12V in 0.1M Bis-Tris pH 6.5, 25% w/v PEG3350. For the G12D-Mg-GppNHp crystal, the drop contained 70 mg/mL KRASG12D in 0.1M Bis-Tris pH 5.5, 25% w/v PEG3350. For the G12D-Mg-GDP crystal, the drop contained 100 mg/mL KRASG12D, 10 mM small-molecule ligand, 4% DMSO, in 0.2 M sodium phosphate dibasic dihydrate, 20% w/v PEG 3350, pH 9.1 reservoir buffer. X-ray diffraction data for G12V-Mg-GDP and G12D-Mg-GppNHp were collected at 100 K at the X29 beamline of the National Synchrotron Light Source, and the X-ray diffraction data for G12D-Mg-GDP were collected using a Saturn 944HG charge-coupled device (CCD) detector mounted on a Rigaku MicroMax-003 microfocus X-ray generator. The diffraction images were processed with the program HKL2000 (Otwinowski and Minor, 1997). The structures were determined by the molecular replacement method with the program Phaser (McCoy et al., 2007), and refined with the programs Refmac (Murshudov et al., 1997) and PHENIX (Adams et al., 2002). Twinned refinement was used for the G12V-Mg-GDP structure. The crystallographic statistics are summarized in Table S1.
In vitro RAS pulldown assay
A 20 μM solution of KRASG12D in 50 mM HEPES, 200 mM sodium chloride, 2 mM TCEP with 1 mM EDTA and 1 mM GTP was gently rotated at 25 °C to remove the endogenous nucleotide. Magnesium chloride was then added to 5 mM and the resulting solution was rotated at 4°C for 4 h. The GTP-loaded KRASG12D was then diluted to 20 nM and incubated with the inhibitors and 10 μL of RAF1-RBD agarose beads (EMD Millipore, CN: 14-278) or 100 nM recombinant GST-tagged human RALGDS protein (Abcam, CN: ab132590) with 20 μL of glutathione beads for 2 h. The beads were separated from solution by centrifuging at 1,500 × g. They were then washed twice with PBS before the addition of 1X SDS buffer. The quantity of RAS in the samples was then analyzed using the western blotting procedure.
Determining RAS isoform dependency using siRNAs
Small interfering RNAs (siRNAs) targeting each RAS isoform were purchased from Dharmacon Technologies. siRNA Catalog numbers:
siDEATH: AllStars Hs Cell Death Control siRNA; Cat # 1027299 from QIAGEN
siHRAS: ON-TARGETplus SMARTpool human HRAS siRNA; Cat # L-004142-00-0005 from GE Dharmacon
siKRAS: ON-TARGETplus SMARTpool human KRAS siRNA; Cat # L-005069-00-0010 from GE Dharmacon
siNRAS: ON-TARGETplus SMARTpool human NRAS siRNA; Cat # L-003919-00-0005 from GE Dharmacon
siNonTargetting: ON-TARGETplus Non-targeting Pool siRNA; Cat # D-001810-10-20 from GE Dharmacon
Reverse transfection was performed by preparing a solutions of 1 mL of Opti-MEM (Invitrogen) with 6 μL of Lipofectamine RNAiMAX (Invitrogen) and 5 μL of RNAi solution (10 μM stock), and by incubating the mixture (1 mL/well) in a 6-well plate for 30 min at 37°C. While the siRNA complex was forming, 0.2 million cells were suspended in 1 mL of 2X serum-containing media. The cell solution (1 mL) was transferred to each well of the 6-well plate containing siRNA complex (1 mL), and the 6-well plate was returned to the culture incubator. At 24, 48, 72 and 96 h post transfection cells were trypsinized and viability was determined using Trypan blue exclusion assay.
Confirming RAS knockdown using RT-qPCR experiment
Cells were detached from the 6-well plate, and 0.5 million cells were collected as a pellet by centrifuging 1,000 rpm for 5 min. Total cellular RNA sample was prepared using RNAeasy extraction kits (QIAgen) according to manufacturer’s instruction. The resulting RNA sample was reverse-transcribed using a High Capacity cDNA Reverse Transcription kit (Life Technologies). The cDNA samples were mixed with TaqMan® probes for each RAS isoform gene, and arrayed on 96-well plate in triplicates. The plate was loaded onto viiA7 Real-Time PCR system (Life Technologies) for qPCR reaction. Comparative analysis (ΔΔCt analysis) was performed with ACTB (human actin b), an internal reference gene.
Gene expression analysis by RT-qPCR
Cells from six-well plates were trypsinized and centrifuged at 3,000 rpm for 3 min. The cell pellet was then lysed and the RNA was extracted using the QIAshredder and RNAeasy extraction kits (Qiagen) according to the manufacturer’s protocol. 2 μg of RNA from each sample was then converted to cDNA using the TaqMan RT Kit (Applied Biosystems). Primers for Quantitative PCR (qPCR) were designed with Primer Express. qPCR was performed using Power SYBR Green Master Mix (Applied Biosystems) in a 96-well format, in triplicate, using an Applied Biosystems 7300 Cycler set to absolute internal reference gene.
RAS, PI3K and BRAF overexpression
Phoenix-AMPHO (ATCC: CRL-3213) cells were seeded in a 6-well plate at 600,000 cells/well in 10% FBS and 1% P/S in DMEM 24 h prior to use. A solution of Lipofectamine 2000 (6 μL) in 100 μL Opti-mem media (reduced serum media) and the plasmid (2.5 μg) in 100 μL Opti-mem media were combined and incubated 5 min at 25 °C, then added to 1.8 mL of Opti-mem in each well. After 12 h, the medium was replaced with 10% FBS and 1% P/S in DMEM. The next day the supernatant was collected three times spaced 4 h apart and polybrene was added (1/1000). The supernatant was filtered (0.45 μm) and added to HT-1080 cells seeded at 100,000 cells per well (6-well dish) in 2 mL portions spaced 4 h apart. After 48 h, the cells were trypsinized and re-seeded in medium containing puromycin (2 μg/mL). After 6 d of selection, the cells were analyzed for expression using the qPCR procedure. 2 mL solutions of the inhibitors were added to a 6-well plate of the transfected HT-1080 cells (100,000 cells/well) and treated for 24 h. The cells were then trypsinized, re-suspended in 1 mL of medium and viability was measured by Vi-Cell (Beckman Coulter) through mixing with Trypan blue. pBABE-puro was from Addgene (plasmid # 1764). pBABE puro KRAS G12V was from Addgene (plasmid # 9052). pBabe-Puro-BRAF-V600E was from Addgene (plasmid # 15269). pBabe puro HA PIK3CA E545K was from Addgene (plasmid # 12525). pBABEbleo-Flag-BRAFV600E was from Addgene (plasmid # 53156).
Multicellular tumor spheroids
Multicellular tumor spheroids (MCTSs) were grown in 96-well Corningware Ultra Low Attachment (ULA) Plates (CLS 3474). 100 μL of cell suspension containing 2 X 10⁴ cells/ml was added to each well of the ULA plate containing 100 μL of a 2X solution of the desired concentration of compounds. Cells were incubated at 37 °C, 5% CO2 for 72 h to allow for MCTS formation. After 72 h, 50 uL of a 50% solution of Alamar blue and medium were added and incubated for 12 h prior to measurements on a Victor3 plate reader as previously above.
RALA activation assay
BJeLR cells were seeded 16 h prior to use in 2% FBS in DMEM. Medium was aspirated and replaced with medium containing 3144 (from a 10 mM DMSO stock). After 6 h, cells were washed 2X with ice-cold buffer (25 mM Tris, 100 mM NaCl, 1 mM TCEP, 5 mM MgCl2, 0.1% Tween-20 and 1 protease inhibitor per 25 mL). Cells were scraped, pelleted at 13,000 rpm for 10 min at 4 °C, then passed through a 26 gauge needle several times. The solution was spun down a second time at 13,000 rpm for 15 min at 4 °C, to remove unlysed cell and debris. RALBP1 agarose beads (EMD Millipore) were then added to the lysate and the solution was rotated at 4 °C for 2 h. The solutions were spun down at 1,500 x g for 2 min and the supernatant was removed by syringe. The beads were washed twice with this process with buffer, then re-suspended in 2.5X SDS.
Immunoprecipitations
BJeLR cells were seeded 16 h prior to use in 10% FBS in DMEM. Medium was aspirated and replaced with medium containing 3144 (from a 10 mM DMSO stock). After 6 h cells were washed 2X with ice-cold buffer (25 mM tris, 100 mM NaCl, 1 mM TCEP, 5 mM MgCl2, 0.1% Tween-20 and 1 protease inhibitor per 25 mL). Cells were scrapped, pelleted at 13,000 rpm for 10 min at 4 °C, then passed through a 26 gauge needle several times. The solution was spun down a second time at 13,000 rpm for 15 min at 4 °C, to remove unlysed cells and debris. HRAS antibody (Santa Cruz, SC-520) was then added to the lysate (1:100) and the solution was rocked at 4 °C for 16 h. Protein A agarose beads were then added and the solution was rotated at 4 °C for an additional 6 h. The solutions were spun down at 1,500 x g for 2 min and the supernatant was removed by syringe. The beads were washed 2X by this process with buffer, then re-suspended in 2.5X SDS.
Caspase 3/7 activation assay
HT-1080 cells were seeded into 384-well plates, 1,000 cells per well. After 16 h, compounds (as 50 mM stocks in DMSO) were arrayed in a dilution series in 384-well polypropylene plates. Compound solutions were transferred at a 1:5 dilution into the assay plates for a total volume of 40 μL. After 24 h, 8 μL of a 1:100 solution of rhodamine 110 bis-(N-CBZ-L-aspartyl-L-glutamyl-L-valyl-L-aspartic acid amide) to lysis buffer (APO-1, Promega) was added and the plate was wrapped in aluminum foil and incubated at room temperature for 16 h. Fluorescence intensity was then determined using a Victor3 plate reader (Perkin Elmer) with a 490 nm excitation filter and a 535 nm emission filter.
Mass Spectrometry Analysis of Nucleotide-Binding
Recombinant KRASG12D with N-terminal His-tag with the following sequence was used in these experiments (calculated monoisotopic mass = 21322.59 Da): GSSHHHHHHSSGLVPRGSHMTEYKLVVVGADGVGKSALTIQLIQNHFVDEYDPTIEDSYRKQVVIDGETCLLDILDTAGQEEYSAMRDQYMRTGEGFLCVFAINNTKSFEDIHHYREQIKRVKDSEDVPMVLVGNKCDLPSRTVDTKQAQDLARSYGIPFIETSAKTRQGVDDAFYTLVREIRKHKEK
Nucleotide exchange and sample preparation
Nucleotides in endogenous recombinant KRAS were exchanged with GDP, GTP or GppNHp using EDTA. Endogenous KRASG12D protein (250 μM final) was incubated with 40-fold molar excess of EDTA (10 mM final), and 75-fold molar excess of new nucleotide (18.75 mM final) for 2 h at 30°C. After incubation, the sample was put on ice for 2 min and then MgCl2 was added (65 mM final concentration) to stop the reaction. To remove excess unbound nucleotide, the sample was added to a NAP-5 column (GE Life Sciences) equilibrated with Buffer A (25 mM HEPES, 100 mM NaCl, 2 mM TCEP, pH 7.5) and eluted with Buffer A at three drops per fraction. Eluted fractions were examined using Bradford dye-binding method for the presence of protein and those containing protein were concentrated, and buffer exchanged into water using Millipore spin column (13,900 x g for 7 min at 4°C, repeated six times, each time adding fresh MilliQ water and discarding the flow-through). Protein concentration was determined using absorbance at 280 nm with extinction coefficient of 11920 M−1 cm−1. To check for success of nucleotide loading procedure, differential scanning fluorimetry was performed (see above). Protein sample in water was then diluted to 50 μM into a denaturing buffer (50% MeOH with 0.05% formic acid) or a native mode buffer (10 mM ammonium acetate) for mass spectrometry analysis.
Mass spectrometry
A 6 μL aliquot of each 50 μM protein solution was loaded into a fresh EconoTip Emitter, 1.2 mm OD with standard coating (New Objective, Woburn, MA). Emitters were mounted on a Nanospray Flex Ion Source fitted with a NanoES off-Line kit ES259, and spectra were collected on Orbitrap Q Exactive HF mass spectrometer (Thermo Fisher Scientific, Bremen, Germany). Direct infusion of sample into the instrument was effected without any applied hydrostatic pressure, but solely by the spray voltage of 1.5–1.7 kV in positive ion mode. Flow rate was estimated to be 20 – 80 nL/min. Heated capillary was set at 250°C and the S-Lens RF level was 55%. Scan range was 400 – 2000 m/z for samples added to 50% MeOH with 0.05% formic acid or 400 – 5000 m/z for samples in 10 mM ammonium acetate, resolution was 60,000, AGC target 1e6, and maximum inject time was 30 ms.
Protein Deconvolution
Mass spectra were processed in Qual Browser of Thermo Xcalibur (Thermo Scientific) to signal average spectra from 1–2 min into a single summed spectrum for each analysis. Spectra were analyzed using Thermo Scientific Protein Deconvolution software (Version 3.0.99.7). The DefaultMethodXtract under Manual Xtract (Isotopically Resolved) algorithm was used for deconvolution. Analysis parameters were set at m/z range 400 – 2000 m/z for samples in 50% MeOH with 0.05% formic acid or 400 – 5000 m/z for samples in 10 mM ammonium acetate. Charge carrier was set to H+, output mass to M, resolution at 400 m/z at 60,000, S/N threshold to 3, minimum detected charge to 3, and isotope table as protein. The deconvoluted results were exported to Microsoft Excel for further analysis. Theoretical modification and adduct masses are derived from Unimod (http://www.unimod.org) and Delta Mass https://abrf.org/delta-mass. Some ligand masses were found on the Chemical Entities of Biological Interest (ChEBI) website (https://www.ebi.ac.uk/chebi/. Raw mass spectrometry files have been deposited in an international data repository for proteomics https://chorusproject.org/ at the URL https://chorusproject.org/anonymous/download/experiment/3708034170230406717
Analysis of Mass Spectra
Spectra were successfully recorded for denatured samples in methanol and the native mode samples in ammonium acetate (see Table S4 and Supporting Information). Mean measured mass deviation from theoretical was +/− 0.04 Da for both native and denatured samples. Mean charge state was +23 for proteins under denaturing conditions and +11 for proteins under native mode conditions. Lower mean charge state observed in native mode suggested that the protein retained much of its secondary structure and consequently fewer charged groups were available to hold a charge. The apoprotein (KRASG12D) was the predominant species in all of the methanol experiments (see Table S4 and Supporting Information), but none of the ammonium acetate experiments (see Table S4 and Supporting Information), suggesting that ammonium acetate under the conditions used was effective in retaining much of the native structure of the protein. However, even in methanol, the GDP ligand was retained at some level in the endogenous protein, in the protein exchanged with GDP and in the protein exchanged with GppNHp. GTP was retained at low levels by the protein in the GTP-exchanged sample. Both GDP and GppNHp were also retained at low levels in the GppNHp-exchanged sample in methanol. The results suggest that these nucleotides are bound with high affinity and survive, at least to some extent, denaturing conditions in methanol. For native mode spectra recorded in ammonium acetate, the endogenous protein appeared as a mixture of the GDP and GTP ligands. However, exchange was 100% effective for both GDP and GTP (Table S3). No contaminating GTP was detected in the GDP-exchanged samples, and no contaminating GDP was detected in the GTP-exchanged samples. In contrast, the GppNHp exchange resulted in a mixture of KRAS contained either the GppNHp or the GDP ligands. GTP, which started out as less abundant in the endogenous samples, was completely displaced by GppNHp.
Synthesis of chemical materials
All reactions were carried out under a nitrogen atmosphere under anhydrous conditions unless indicated otherwise. Anhydrous methylene chloride (DCM), tetrahydrofuran (THF) and N,N-dimethylformamide (DMF) were purchased from Sigma-Aldrich. Reactions were magnetically stirred and monitored by thin layer chromatography carried out by Merck pre-coated 0.25 mm silica plates containing a 254 nm fluorescence indicator. Flash chromatography was performed on a Teledyne combiflash companion automatic flash chromatography system. Preparative thin layer chromatography was performed on 1 mm. Proton nuclear magnetic resonance spectra (1H NMR, 300 MHz, 400 MHz, 500 MHz) and proton decoupled carbon nuclear magnetic resonance spectra (13C NMR, 100 MHz, 125 MHz) were obtained on a Bruker DPX 300, 400, or 500 MHz instruments in deuterochloroform (CDCl3) with residual chloroform as internal standard. Other deuterated solvents that were used include d4-MeOD and d6-DMSO. Abbreviations: DIPEA = diisopropylethyl amine, DCE = 1,2-dichloroethane, EtOAc = ethyl acetate, HBTU = O-(Benzotriazol-1-yl)-N,N,N′,N′-tetramethyluronium hexafluorophosphate, HCl = hydrochloric acid, MeOH = methanol, MgSO4= magnesium sulfate, NaHCO3 = sodium bicarbonate, Na2SO4 = sodium sulfate, NH4Cl = ammonium chloride, Pd(PPh3)4 = Tetrakis(triphenylphosphine)palladium(0), RT = room temperature, TFA = trifluoroacetic acid, THF = tetrahydrofuran. See also Table S2 for reagents and Method S1 Synthesis of Chemical Materials.
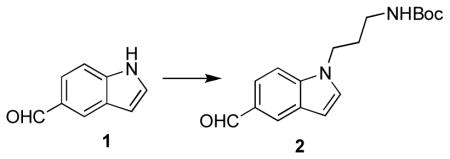
tert-butyl 3-(5-formyl-1H-indol-1-yl)propylcarbamate (2)
To a solution of 1H-indole-5-carbaldehyde (1) (2.72 g, 18.8 mmol) in DMF (80 mL) at 0 °C, sodium hydride (60% in mineral oil) (0.69 g, 28.5 mmol, 1.5 equiv) was added in several portions over about 5 min. The mixture was stirred for 1 h at 0 °C before the sequential addition of 3-(Boc-amino)propyl bromide (8 g, 33.6 mmol). The solution was warmed to 80 °C and stirred for 48 h. Upon completion, the reaction was diluted with saturated aqueous NaHCO3 and extracted three times with EtOAc. The combined organic layers were washed with brine, dried (Na2SO4), concentrated, and the crude material was purified by combiflash 0→50% EtOAc in hexanes to yield tert-butyl 3-(5-formyl-1H-indol-1-yl)propylcarbamate (2) (4.73 g, 83% yield). 1H NMR (400 MHz, CDCl3) δ 10.05 (s, 1H), 8.18 (d, J = 1.5 Hz, 1H), 7.81 (dd, J = 8.7, 1.6 Hz, 1H), 7.26 (d, J = 3.1 Hz, 1H), 6.75-6.60 (m, 1H), 4.54 (s, 1H), 4.25 (t, J = 6.9 Hz, 2H), 3.17 (d, J = 7.2 Hz, 2H), 2.08 (p, J = 6.9 Hz, 2H), 1.47 (s, 9H). 13C NMR (100 MHz, CDCl3) δ 192.4, 156.1, 139.2, 129.8, 129.3, 128.4, 126.6, 121.8, 109.8, 103.6, 79.5, 44.1, 38.0, 30.6, 28.4. HRMS (m/z): [M]+ cald for C17H22N2O3, 302.1630, found 302.1633
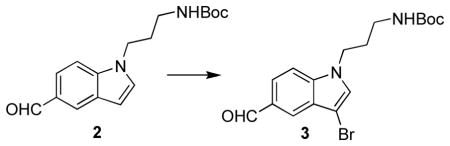
tert-butyl 3-(3-bromo-5-formyl-1H-indol-1-yl)propylcarbamate (3)
To a solution of tert-butyl 3-(5-formyl-1H-indol-1-yl)propylcarbamate (2) (4.73 g, 15.63 mmol) in dry THF (300 mL) at −78 °C, Br2 (0.9 mL, 17.48 mmol, 1.1 equiv) was added dropwise over about 5 min. The resulting mixture was stirred at −78°C for 2.5 h. Upon completion, the reaction contents were poured onto a solution of ice (~300 g), water (200 mL), ammonium hydroxide (1 mL, 12 M), and sodium thiosultate pentahydrate (1 mL, saturated solution in water). The crude material was extracted three times with EtOAc, the combined organic layers were washed with brine, dried (Na2SO4), concentrated, and the crude material was purified by combiflash 0→50% EtOAc in hexanes to yield tert-butyl 3-(3-bromo-5-formyl-1H-indol-1-yl)propylcarbamate (3) (5.49 g, 92% yield).1H NMR (400 MHz, CDCl3) δ 10.09 (s, 1H), 8.12 (d, J = 1.5 Hz, 1H), 7.86 (dd, J = 8.7, 1.5 Hz, 1H), 7.43 (d, J = 8.6 Hz, 1H), 7.30 (s, 1H), 4.57 (s, 1H), 4.23 (t, J = 6.9 Hz, 2H), 3.18 (d, J = 6.8 Hz, 2H), 2.08 (p, J = 6.7 Hz, 2H), 1.47 (s, 9H). 13C NMR (100 MHz, CDCl3) δ 191.2, 155.3, 137.9, 129.0, 127.9, 126.5, 124.1, 121.6, 109.4, 91.2, 43.5, 37.1, 29.8, 27.6, 27.5. HRMS (m/z): [M]+ cald for C17H21BrN2O3, 380.0736, found 380.0729.
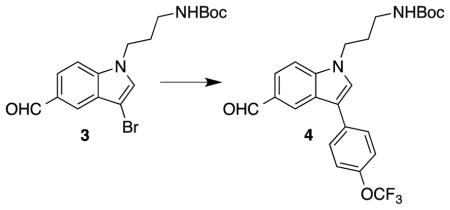
tert-butyl 3-(5-formyl-3-(4-(trifluoromethoxy)phenyl)-1H-indol-1-yl)propylcarbamate (4)
To a solution of tert-butyl 3-(3-bromo-5-formyl-1H-indol-1-yl)propylcarbamate (3) (5.49 g, 14.39 mmol) in 1,4-dioxane (110 mL), 4-(trifluoromethoxy)phenylboronic acid (4.45 g, 21.59 mmol, 1.5 equiv), Pd(PPh3)4 (0.891 g, 0.77 mmol, 0.05 equiv), and a solution of potassium carbonate (14.4 mL, 2.0 M in H2O) were added sequentially. The resulting mixture was heated to 100 °C in a thick walled high pressure sealed flask and stirred for 16 h. Upon completion, the reaction was cooled to rt and diluted with saturated aqueous NaHCO3 and extracted three times with EtOAc. The combined organic layers were dried (Na2SO4), concentrated, and the crude material was purified by combiflash 0→40% EtOAc in hexanes to yield tert-butyl 3-(5-formyl-3-(4-(trifluoromethoxy)phenyl)-1H-indol-1-yl)propylcarbamate (4) (5.52 g, 84%). 1H NMR (500 MHz, CDCl3) δ 10.03 (s, 1H), 8.35 (s, 1H), 7.81 (d, J = 8.6 Hz, 1H), 7.64 (d,J = 8.4 Hz, 2H), 7.44 (d, J = 8.6 Hz, 1H), 7.40 (brs, 1H), 7.30 (d, J = 8.4 Hz, 2H), 4.25 (t, J = 6.9 Hz, 2H), 3.20-3.16 (m, 2H), 2.08 (p, J = 6.8 Hz, 2H), 1.43 (s, 9H). 13C NMR δ (125 MHz, CDCl3) 192.3, 156.2, 147.9, 140.0, 133.3, 130.0, 128.8, 127.5, 126.2, 125.1, 122.7, 121.6, 117.9, 110.3, 79.7, 44.3, 38.1, 30.7, 28.4. HRMS (m/z): [M+H]+ cald for C24H26F3N2O4, 463.1845, found 463.1848.
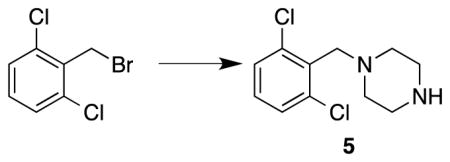
1-(2,6-dichlorobenzyl)piperazine (5)
To a solution of piperazine (9.66 g, 112.1 mmol) in THF (180 mL) at 0 °C, a solution of 2,6-dichlorobenzyl bromide (4.52 g, 18.8 mmol) in THF (20 mL) was added dropwise over 10 min. The resulting mixture was slowly allowed to warm to RT and stirred for 24 h. Upon completion, the THF was removed, the crude material was re-suspended in CH2Cl2 and water, and extracted two additional times with CH2Cl2. The combined organic layers were dried (Na2SO4), filtered, and concentrated. The crude material was purified by combiflash 0→20% MeOH in CH2Cl2 to provide 1-(2,6-dichlorobenzyl)piperazine (5) (4.1 g, 88% yield). 1H NMR (500 MHz, d4-MeOD) δ 7.37 (d, J = 8.2 Hz, 2H), 7.24 (dd, J = 8.4, 8.3 Hz, 1H), 3.76 (s, 2H), 2.82 (dd, J = 5.0, 4.9 Hz, 4H), 2.59 (dd, J = 5.0, 4.9 Hz, 4H). 13C NMR (125 MHz, d4-MeOD) δ 138.1, 135.0, 130.6, 129.6, 57.8, 54.4, 46.2. HRMS (m/z): [M+H]+ cald for C11H15N2Cl2, 245.0612, found 245.0607.
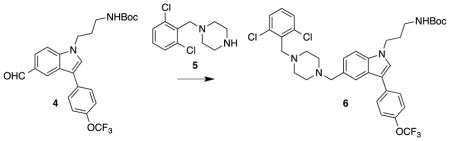
tert-butyl 3-(5-((4-(2,6-dichlorobenzyl)piperazin-1-yl)methyl)-3-(4-(trifluoromethoxy)phenyl)-1H-indol-1-yl)propylcarbamate (6)
To a solution of tert-butyl 3-(5-formyl-3-(4-(trifluoromethoxy)phenyl)-1H-indol-1-yl)propylcarbamate (4) (324.4 mg, 0.7 mmol) and 1-(2,6-dichlorobenzyl)piperazine (5) (267.4 mg, 1.1 mmol) in CH2Cl2 (4.5 mL) was added sodium triacetoxyborohydride (442.5 mg, 2.1 mmol). The resulting mixture was stirred at 25 °C for 6 h. Upon completion, the reaction was diluted with water and extracted three times with CH2Cl2. The combined organic layers were dried (Na2SO4), concentrated, and the crude material was purified by combiflash 0→5% MeOH in DCM to yield tert-butyl 3-(5-((4-(2,6-dichlorobenzyl)piperazin-1-yl)methyl)-3-(4-(trifluoromethoxy)phenyl)-1H-indol-1-yl)propylcarbamate (454.5 mg, 94% yield). 1H NMR (400 MHz, d4-MeOD) δ 7.93 (d, J = 1.0 Hz, 1H), 7.72 (d, J = 8.7 Hz, 2H), 7.54 (s, 1H), 7.45 (d, J = 8.5 Hz, 1H), 7.32 (d, J = 8.1 Hz, 2H), 7.30 (d, J = 8.8 Hz, 2H), 7.23 (dd, J = 8.5, 1.2 Hz, 1H), 7.20 (dd, J = 8.6, 7.5 Hz, 1H), 4.22 (t, J = 6.9 Hz, 2H), 4.01 (s, 2H), 3.75 (s, 2H), 3.05 (t, J = 6.6 Hz, 2H), 2.86 brs, 4H), 2.69 (brs, 4H), 1.99 (p, J = 6.8 Hz, 2H), 1.42 (s, 9H). 13C NMR (125 MHz, d4-MeOD) δ 178.1, 158.5, 148.4, 138.4, 138.0, 136.0, 134.5, 130.8, 129.6, 129.5, 128.7, 127.5, 125.6, 123.2, 122.5, 116.5, 111.3, 80.0, 62.9, 56.7, 53.0, 51.7, 44.8, 38.8, 31.3, 28.8, 22.9. HRMS (m/z): [M+H]+ cald for C35H40Cl2F3N4O3, 691.2430, found 691.2449.
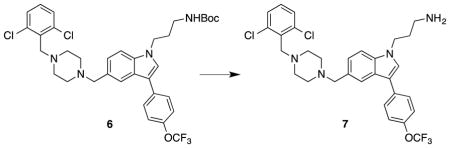
3-(5-((4-(2,6-dichlorobenzyl)piperazin-1-yl)methyl)-3-(4-(trifluoromethoxy)phenyl)-1H-indol-1-yl)propan-1-amine (7)
To a solution of tert-butyl 3-(5-((4-(2,6-dichlorobenzyl)piperazin-1-yl)methyl)-3-(4-(trifluoromethoxy)phenyl)-1H-indol-1-yl)propylcarbamate (6) (1.88 g, 2.72 mmol) in 1,4-dioxane (50 mL) a solution of HCl (20 mL, 4.0 M in 1,4-dioxane) was added and the resulting solution was stirred at 25 °C for 16 h. Upon completion, the 1,4-dioxane was removed and the crude material was re-suspended in methanol and an excess of potassium carbonate was added. The slurry was stirred at RT until basic, filtered over celite and concentrated. The crude product was purified by preparative TLC (20% MeOH in CH2Cl2) to provide 3-(5-((4-(2,6-dichlorobenzyl)piperazin-1-yl)methyl)-3-(4-(trifluoromethoxy)phenyl)-1H-indol-1-yl)propan-1-amine (7) (1.61 g, 100% yield).
1H NMR (400 MHz, d4-MeOD) δ 7.80 (s, 1H), 7.71 (d, J = 8.5 Hz, 2H), 7.50 (s, 1H), 7.41 (d, J = 8.4 Hz, 1H), 7.30 (dd, J = 8.2, 8.2 Hz, 4H), 7.19-7.15 (m, 2H), 4.26 (t, J = 6.8 Hz, 2H), 3.70 (s, 2H), 3.56 (s, 2H), 2.71 (t, J = 7.1 Hz, 2H), 2.57 (brs, 4H), 2.43 (brs, 4H), 2.05 (p, J = 7.1 Hz, 2H). 13C NMR (125 MHz, d4-MeOD) δ 148.3, 138.1, 137.8, 136.4, 135.1, 130.5, 129.64, 129.56, 129.3, 127.8, 127.3, 125.4, 122.4, 121.9, 121.0, 116.4, 110.7, 64.5, 57.2, 53.9, 53.7, 44.7, 39.4, 32.7. HRMS (m/z): [M+H]+ cald for C30H32Cl2F3N4O, 591.1900, found 591.1906
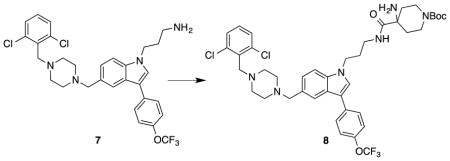
tert-butyl 4-amino-4-(3-(5-((4-(2,6-dichlorobenzyl)piperazin-1-yl)methyl)-3-(4-(trifluoromethoxy)phenyl)-1H-indol-1-yl)propylcarbamoyl)piperidine-1-carboxylate (8)
HBTU (1.22 g, 5.43 mmol) was added to a solution of 4-amino-1-(tert-butoxycarbonyl)piperidine-4-carboxylic acid (0.99 g, 4.05 mmol) and DIPEA (0.70 mL, 4.01 mmol) in dry DMF (25 mL) at 0 °C and stirred for 1 h. A solution of 3-(5-((4-(2,6-dichlorobenzyl)piperazin-1-yl)methyl)-3-(4-(trifluoromethoxy)phenyl)-1H-indol-1-yl)propan-1-amine (7) (1.6 g, 2.70 mmol) in dry DMF (10 mL) was added. The reaction was stirred for an additional 48 h and allowed to warm to 25 °C. Upon completion, the reaction was quenched with saturated aqueous NaHCO3 and extracted three times with EtOAc. The combined organic layers were washed with water and brine, dried (Na2SO4), filtered and concentrated. The crude material was purified by combiflash 0→5% MeOH in CH2Cl2 to yield tert-butyl 4-amino-4-(3-(5-((4-(2,6-dichlorobenzyl)piperazin-1-yl)methyl)-3-(4-(trifluoromethoxy)phenyl)-1H-indol-1-yl)propylcarbamoyl)piperidine-1-carboxylate (8) (1.59 g, 72% yield). 1H NMR (400 MHz, CDCl3) δ 7.75 (s, 1H), 7.62 (d, J = 8.7 Hz, 3H), 7.33-7.28 (m, 6H), 7.11 (t, J = 8.0 Hz, 1H), 4.21 (t, J = 6.6 Hz, 2H), 3.90 (brd, J = 11.6 Hz, 2H), 3.75 (s, 2H), 3.68 (s, 2H), 3.30 (q, J = 6.5 Hz, 2H), 2.94 (m, 2H), 2.80 (m, 3H), 2.63 (brs, 4H), 2.54 (brs, 4H), 2.14-2.01 (m, 5H), 1.45 (s, 9H), 1.18 (brd, J = 13.6 Hz, 1H). 13C NMR (100 MHz, CDCl3) δ176.9, 154.7, 147.4, 137.1, 136.2, 134.4, 134.3, 128.9 128.5, 128.4, 126.2, 124.4, 121.7, 121.6, 120.8, 119.7, 115.8, 109.7, 79.8, 63.5, 56.4, 55.5, 53.1, 52.7, 44.7, 38.7, 37.2, 34.6, 30.1, 28.5. HRMS (m/z): [M+H]+ cald for C41H50Cl2F3N6O4, 817.3223, found 817.3185
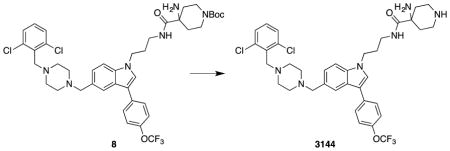
4-amino-N-(3-(5-((4-(2,6-dichlorobenzyl)piperazin-1-yl)methyl)-3-(4-(trifluoromethoxy)phenyl)-1H-indol-1-yl)propyl)piperidine-4-carboxamide: 3144
tert-butyl-4-amino-4-(3-(5-((4-(2,6-dichlorobenzyl)piperazin-1-yl)methyl)-3-(4-(trifluoromethoxy)phenyl)-1H-indol-1-yl)propylcarbamoyl)piperidine-1-carboxylate (8) (40 mg, 0.049 mmol) was dissolved in 1,4-dioxane (0.5 mL) before the addition of HCl in 1,4-dioxane (0.1 mL of a 4.0 M solution). The resulting mixture was stirred for 6 h at 25 °C. Upon completion the 1,4-dioxane was removed and the residue was re-suspended in MeOH and solid K2CO3 (100 mg, XS) was added. The crude material was purified by preparative TLC (15% MeOH in DCM) to provide 3144 (18 mg, 51%). 1H NMR (400 MHz, d4-MeOD) δ 7.82 (s, 1H), 7.74 (d, J = 8.7 Hz, 2H), 7.55 (s, 1H), 7.42 (d, J = 8.4 Hz, 1H), 7.34 (d, J = 8.0 Hz, 2H), 7.31 (d, J = 8.2 Hz, 2H), 7.21 (dd, J = 8.5, 7.5 Hz, 2H), 4.26 (t, J = 6.7 Hz, 2H), 3.75 (s, 2H), 3.60 (s, 2H), 3.24 (t, J = 6.6 Hz, 2H), 2.99-2.89 (m, 4H), 2.60 (brs, 4H), 2.49 (brs, 4H), 2.11-1.97 (m, 4H), 1.35 (brd, J = 13.9 Hz, 2H). 13C NMR (100 MHz, d4-MeOD) δ 179.4, 148.3, 138.1, 137.8, 136.4, 135.1, 130.5, 129.7, 129.6, 128.1, 127.4, 125.4, 122.5, 121.9, 116.3, 110.8, 64.5, 57.2, 56.2, 53.9, 53.7, 49.8, 45.2, 41.8, 38.3, 34.8, 30.8. HRMS (m/z): [M+H]+ cald for C36H42Cl2F3N6O2, 717.2698, found 717.2675
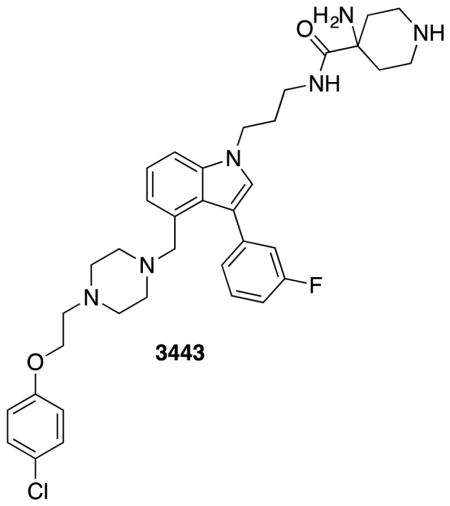
4-amino-N-(3-(4-((4-(2-(4-chlorophenoxy)ethyl)piperazin-1-yl)methyl)-3-(3-fluorophenyl)-1H-indol-1-yl)propyl)piperidine-4-carboxamide: 3443
The compound prepared according to the protocols for 3144. 1H NMR (400 MHz, d4-MeOD) δ 7.44 (dd, J = 8.4, 1.0 Hz, 1H), 7.38 (td, J = 8.0, 6.1 Hz, 1H), 7.34-7.22 (m, 5H), 7.22-7.15 (m, 1H), 7.08-6.98 (m, 2H), 6.94-6.87 (m, 2H), 4.34-4.21 (m, 2H), 4.06 (t, J = 5.5 Hz, 2H), 3.56 (s, 2H), 2.73 (t, J = 5.5 Hz, 2H), 2.43 (s, 3H), 2.25-2.08 (m, 7H). 13C NMR (100 MHz, d -MeOD) δ4 177.3, 163.6, 161.1, 136.9, 128.9, 127.8, 126.2, 125.4, 122.2, 121.1, 117.0, 116.8, 115.7, 112.6, 109.3, 59.5, 56.4, 53.7, 52.7, 51.3, 43.5, 39.7, 36.9, 31.1, 29.3. HRMS (m/z): [M+H]+ cald for C36H45ClFN6O2, 647.3271, found 647.3400
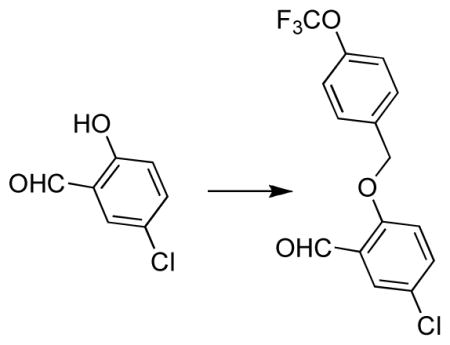
5-chloro-2-(4-(trifluoromethoxy)benzyloxy)benzaldehyde
To a solution of 5-chlorosalicyladehyde (82 mg, 0.56 mmol) in DMF (1 mL), K2CO3 (87 mg, 0.63 mmol) was added and stirred for 10 min at 25 °C before the addition of 4-(trifluoromethoxy)benzyl bromide (126 uL, 0.788 mmol). The resulting mixture was stirred at 25 °C for 12 h. Upon completion, the reaction contents were diluted with saturated NaHCO3 and extracted with EtOAc (3X). The combined organic layers were washed once with brine, dried (Na2SO4), concentrated and purified by combiflash 0→ 30% EtOAc to provide 5-chloro-2-(4-(trifluoromethoxy)benzyloxy)benzaldehyde (99 mg, 53% yield). 1H NMR (400 MHz, CDCl3) δ 10.49 (s, 1H), 7.84 (d, J = 2.8 Hz, 1H), 7.55-7.45 (m, 3H), 7.34-7.23 (m, 2H), 7.01 (d, J = 8.9 Hz, 1H), 5.20 (s, 2H). 13C NMR (100 MHz, CDCl3) δ 188.1, 135.4, 134.23, 128.8, 128.3, 126.1, 121.3, 114.5, 70.04. HRMS (m/z): [M-H]+ cald for C15H9ClF3O3, 329.0187, found 329.0180
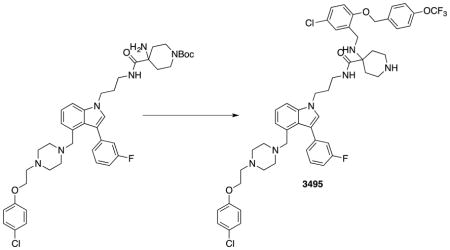
4-((5-chloro-2-((4-(trifluoromethoxy)benzyl)oxy)benzyl)amino)-N-(3-(4-((4-(2-(4-chlorophenoxy)ethyl)piperazin-1-yl)methyl)-3-(3-fluorophenyl)-1H-indol-1-yl)propyl)piperidine-4-carboxamide: 3495
To a solution of tert-butyl-4-amino-4-(3-(4-((4-(2-(4-chlorophenoxy)ethyl)piperazin-1-yl)methyl)-3-(3-fluorophenyl)-1H-indol-1-yl)propylcarbamoyl)piperidine-1-carboxylate (29 mg, 0.0443 mmol) in dichloroethane (1 mL), 5-chloro-2-(4-(trifluoromethoxy)benzyloxy)benzaldehyde (44 mg, 0.133 mmol), and MgSO4 (10 mg) were added and stirred at 40 °C for 1 h prior to the addition of sodium triacetoxyborohydride (19 mg, 0.0886 mmol). The resulting mixture was stirred for an additional 8 h at 40 °C before being concentrated and purified directly by preparative TLC (2% MeOH in DCM). The Boc group of the product was then removed (using the protocol for 3144) to provide compound 3495 (14 mg, 33% yield over two steps). 1H NMR (400 MHz, d4-MeOD) δ 7.41-7.29 (m, 5H), 7.29-7.13 (m, 8H), 7.12-6.97 (m, 4H), 6.92-6.86 (m, 2H), 5.71 (s, 1H), 4.95 (q, J = 11.1 Hz, 2H), 4.14 (q, J = 7.1 Hz, 2H), 4.05 (t, J = 5.5 Hz, 2H), 3.53 (s, 2H), 3.44 (ddd, J = 14.7, 9.1, 6.3 Hz, 1H), 3.16 (dtd, J = 27.2, 13.1, 11.7, 4.3 Hz, 3H), 3.00-2.80 (m, 2H), 2.72 (t, J = 5.5 Hz, 2H), 2.09-1.79 (m, 5H), 1.71 (d, J = 14.1 Hz, 1H). 13C NMR (100 MHz, d4-MeOD) δ 175.6, 157.5, 155.8, 136.8, 135.2, 130.4, 130.2, 129.7, 129.3, 128.9, 128.8, 128.7, 127.5, 126.2, 126.1, 126.0, 125.4, 125.3, 122.2, 121.1, 120.8, 117.0, 116.9, 116.7, 115.6, 114.0, 112.4, 112.2, 108.9, 69.5, 65.2, 59.7, 58.8, 56.7, 53.0, 51.8, 43.3, 40.5, 40.4, 38.4, 31.2, 29.7, 27.3. HRMS (m/z): [M+H]+ cald for C51H55Cl2F4N6O4, 961.3592, found 961.3020
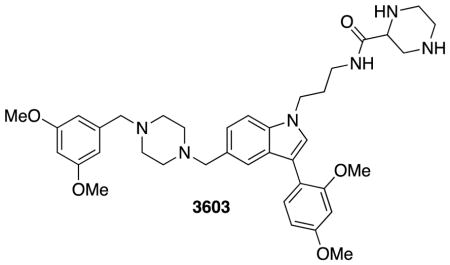
N-(3-(5-((4-(3,5-dimethoxybenzyl)piperazin-1-yl)methyl)-3-(2,4-dimethoxyphenyl)-1H-indol-1-yl)propyl)piperazine-2-carboxamide: 3603
3603 was synthesized according to the analogous procedure as 3144.
1H NMR (400 MHz, Methanol-d4) δ 7.62 (s, 1H), 7.50 – 7.40 (m, 3H), 7.20 (d, J = 9.8 Hz, 1H), 6.68 (d, J = 2.5 Hz, 1H), 6.64 (dd, J = 8.3, 2.5 Hz, 1H), 6.52 (d, J = 2.3 Hz, 2H), 6.40 (t, J = 2.3 Hz, 1H), 4.55 (s, 3H), 4.29 (t, J = 6.8 Hz, 2H), 3.87 (s, 3H), 3.82 (s, 3H), 3.77 (s, 6H), 3.73 (s, 2H), 3.53 – 3.48 (m, 3H), 3.16 (p, J = 1.7 Hz, 1H), 2.77 – 2.48 (m, 11H), 2.36 (d, J = 7.5 Hz, 1H), 2.11 (t, J = 6.7 Hz, 2H), 0.95 – 0.84 (m, 4H).
4-amino-N-(3-(4-((4-(2-(4-chlorophenoxy)ethyl)piperazin-1-yl)methyl)-3-(2-methoxyphenyl)-1H-indol-1-yl)propyl)piperidine-4-carboxamide: 3445
3445 was synthesized according to the analogous procedure as 3144.
1H NMR (400 MHz, Methanol-d4) δ 7.66 (d, J = 1.5 Hz, 1H), 7.58 (dd, J = 7.5, 1.7 Hz, 1H), 7.54 (s, 1H), 7.46 (d, J = 8.4 Hz, 1H), 7.32 – 7.20 (m, 4H), 7.11 (dd, J = 8.3, 1.1 Hz, 1H), 7.05 (td, J = 7.5, 1.2 Hz, 1H), 6.96 – 6.88 (m, 2H), 4.32 (t, J = 6.6 Hz, 2H), 4.12 (t, J = 5.5 Hz, 2H), 3.86 (s, 3H), 3.71 (s, 2H), 3.25 – 3.17 (m, 4H), 2.83 (t, J = 5.5 Hz, 2H), 2.66 (s, 7H), 2.20 – 2.07 (m, 4H), 1.49 (d, J = 14.4 Hz, 2H).
N-(3-(5-((4-(3,5-bis(trifluoromethyl)benzyl)piperazin-1-yl)methyl)-3-(2,6-bis(trifluoromethyl)phenyl)-1H-indol-1-yl)propyl)piperazine-2-carboxamide: 3256
3256 was synthesized according to the same procedure as 3144.
1H NMR (400 MHz, Methanol-d4) δ 8.20 (d, J = 1.6 Hz, 2H), 7.94 (s, 2H), 7.87 (d, J = 13.8 Hz, 2H), 7.83 (s, 1H), 7.79 (s, 1H), 7.53 (d, J = 8.5 Hz, 1H), 7.30 (dd, J = 8.5, 1.5 Hz, 1H), 4.32 (t, J = 6.8 Hz, 2H), 3.84 (s, 2H), 3.71 (s, 2H), 3.58 – 3.45 (m, 1H), 3.36 – 3.33 (m, 2H), 3.28 – 3.17 (m, 2H), 3.11 – 3.00 (m, 2H), 2.97 – 2.81 (m, 3H), 2.72 (brs, 4H), 2.58 (brs, 4H), 2.12 (p, J = 6.6 Hz, 2H), 0.94 – 0.81 (m, 2H).
N-(3-(5-((4-(2,6-dichlorobenzyl)piperazin-1-yl)methyl)-3-(4-(trifluoromethoxy)phenyl)-1H-indol-1-yl)propyl)-4-((4-((3,5-dimethoxybenzyl)oxy)-3-methoxybenzyl)amino)piperidine-4-carboxamide: 4363
4363 was synthesized using the same procedures as 3495.
1H NMR (400 MHz, Methanol-d4) δ 7.84 (s, 1H), 7.74 (d, J = 8.7 Hz, 2H), 7.49 (s, 1H), 7.43 – 7.29 (m, 5H), 7.29 – 7.17 (m, 2H), 6.96 (s, 1H), 6.90 – 6.80 (m, 2H), 6.59 (d, J = 2.3 Hz, 2H), 6.40 (d, J = 2.4 Hz, 1H), 5.00 (s, 2H), 4.25 (t, J = 6.9 Hz, 2H), 3.81 (s, 3H), 3.79 (s, 2H), 3.75 (s, 6 H), 3.62 (s, 2H), 3.53 – 3.47 (m, 3H), 3.19 – 2.91 (m, 6H), 2.63 (s, 4H), 2.50 (s, 4H), 2.16 – 1.96 (m, 5H), 1.75 (d, J = 14.2 Hz, 2H).
4-((3-chloro-4-((4-fluorobenzyl)oxy)benzyl)amino)-N-(3-(4-((4-(2-(4-chlorophenoxy)ethyl)piperazin-1-yl)methyl)-3-(3-fluorophenyl)-1H-indol-1-yl)propyl)piperidine-4-carboxamide: 3512
3512 was synthesized according to the same procedures as 3495.1H NMR (400 MHz, Methanol-d4) δ 7.51 – 7.41 (m, 3H), 7.41 – 7.28 (m, 3H), 7.28 – 7.20 (m, 4H), 7.20 – 7.13 (m, 2H), 7.13 – 7.06 (m, 2H), 7.06 – 6.98 (m, 3H), 6.93 – 6.86 (m, 2H), 5.11 (s, 2H), 4.26 (t, J = 6.9 Hz, 2H), 4.06 (t, J = 5.5 Hz, 2H), 3.56 – 3.49 (m, 4H), 3.33 – 3.08 (m, 10H), 2.72 (t, J = 5.5 Hz, 2H), 2.41 (s, 3H), 2.12 (td, J = 15.9, 13.5, 7.6 Hz, 8H), 1.89 (d, J = 14.7 Hz, 2H).
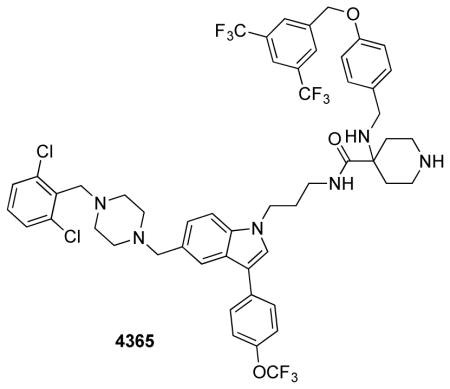
4-((4-((3,5-bis(trifluoromethyl)benzyl)oxy)benzyl)amino)-N-(3-(5-((4-(2,6-dichlorobenzyl)piperazin-1-yl)methyl)-3-(4-(trifluoromethoxy)phenyl)-1H-indol-1-yl)propyl)piperidine-4-carboxamide: 4365
4365 was synthesized using the same procedures as 3495.
1H NMR (400 MHz, Methanol-d4) δ 8.03 (s, 2H), 7.93 (s, 1H), 7.86 – 7.81 (m, 1H), 7.77 – 7.70 (m, 2H), 7.51 (s, 1H), 7.43 (d, J = 8.5 Hz, 1H), 7.40 – 7.34 (m, 2H), 7.26 (dddd, J = 23.7, 16.0, 8.2, 1.3 Hz, 7H), 7.00 – 6.93 (m, 2H), 5.20 (s, 2H), 4.27 (t, J = 6.8 Hz, 2H), 3.78 (s, 2H), 3.62 (s, 2H), 3.48 (s, 3H), 3.11 – 2.99 (m, 2H), 2.99 – 2.89 (m, 2H), 2.63 (s, 4H), 2.50 (s, 4H), 2.11 (t, J = 6.7 Hz, 2H), 1.99 (ddd, J = 13.9, 9.7, 4.0 Hz, 2H), 1.70 (d, J = 14.5 Hz, 2H).
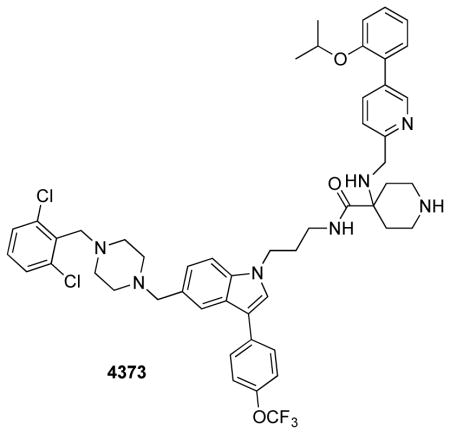
N-(3-(5-((4-(2,6-dichlorobenzyl)piperazin-1-yl)methyl)-3-(4-(trifluoromethoxy)phenyl)-1H-indol-1-yl)propyl)-4-(((5-(2-isopropoxyphenyl)pyridin-2-yl)methyl)amino)piperidine-4-carboxamide: 4373
4373 was synthesized using the same procedures as 3495.
1H NMR (400 MHz, Methanol-d4) δ 8.65 (d, J = 2.2 Hz, 1H), 7.91 (dd, J = 8.1, 2.2 Hz, 1H), 7.85 (s, 1H), 7.76 – 7.69 (m, 2H), 7.53 (s, 1H), 7.47 (d, J = 8.0 Hz, 1H), 7.42 – 7.33 (m, 4H), 7.33 – 7.22 (m, 4H), 7.21 – 6.99 (m, 4H), 4.59 (p, J = 6.3 Hz, 1H), 4.30 (t, J = 6.9 Hz, 2H), 3.79 (d, J = 7.6 Hz, 4H), 3.69 (s, 2H), 2.61 (d, J = 29.0 Hz, 8H), 2.28 – 2.08 (m, 4H), 1.94 (d, J = 15.8 Hz, 3H), 1.31 – 1.21 (m, 3H), 1.20 (d, J = 6.0 Hz, 5H).
QUANTIFICATION AND STATISTICAL ANALYSIS
All statistical analyses, potency determinations, and viability curves were produced using Prism 5.0c (GraphPad Software). Number of samples and statistical tests used are provided in the STAR Methods.
DATA AND SOFTWARE AVAILABILITY
PDB files of structures generated and docked pose of 3144 are provided as Supplementary Materials. Raw mass spectrometry files have been deposited in an international data repository for proteomics https://chorusproject.org/. The URL is: https://chorusproject.org/anonymous/download/experiment/3708034170230406717
KEY RESOURCES TABLE
| REAGENT or RESOURCE | SOURCE | IDENTIFIER |
|---|---|---|
| Antibodies | ||
| Phospho-p44/42 MAPK (Erk1/2) (Thr202/Tyr204) Antibody | Cell Signaling Technology | Cat. No. 9101S; RRID:AB_331646 |
| p44/42 MAPK (Erk1/2) Antibody | Cell Signaling Technology | Cat. No. 9102S; RRID:AB_330744 |
| Anti-Phospho-Akt (Ser473) (D9E) XP(R) Rabbit mAb antibody | Cell Signaling Technology | Cat. No. 4060S; RRID:AB_2315049 |
| Anti-AKT antibody | Cell Signaling Technology | Cat. No. 9272S; RRID:AB_329827 |
| Anti-panRAS antibody | Cell Signaling Technology | Cat. No. 3965S; RRID:AB_10695608 |
| Anti-HRAS antibody | Santa Cruz | Cat. No. SC-520; RRID:AB_631670 |
| Anti-RalA antibody | Cell Signaling Technology | Cat. No. 4799S; RRID:AB_10612771 |
| Anti-PI3Kgamma antibody | Cell Signaling Technology | Cat. No. 5405S; RRID:AB_1904087 |
| c-Raf Antibody | Cell Signaling Technology | Cat. No. #9422; RRID:AB_390808 |
| Anti-cleaved caspase-3 antibody | Cell Signaling Technology | Cat. No. 9664; RRID:AB_2070042 |
| Goat anti-rabbit antibody conjugated to an IRdye at 800CW | Li-COR Biosciences | Cat. No. 926-32211; RRID:AB_621843 |
| Donkey anti-mouse antibody conjugated to an IRdye at 680RD | Li-COR Biosciences | Cat. No. 926-68072; RRID:AB_10953628 |
| Biological Samples | ||
| T-ALL patient samples | University of Padova (Italy) | N/A |
| Chemicals, Peptides, and Recombinant Proteins | ||
| (Z)-4-hydroxytamoxifen (4OHT) | Sigma | Cat. No. H7904 |
| Recombinant Human EGF | PeproTech | Cat. No. AF-100-15 |
| MG-132 | Sigma Aldrich | Cat. No. M7449 |
| 7-ethoxycoumarin | Sigma Aldrich | Cat. No. E1379 |
| Guanosine 5′-diphosphate sodium salt, Type I, >=96% | Sigma Aldrich | Cat. No. G7127 |
| Guanosine 5′-triphosphate sodium salt hydrate,>=95% | Sigma Aldrich | Cat. No. G8877 |
| Guanosine 5′-[beta,gamma-imido]triphosphate trisodium salt hydrate | Sigma Aldrich | Cat. No. G0635 |
| RALA protein | Abcam | Cat. No. ab102555 |
| RHOA protein | Abcam | Cat. No. ab101594 |
| RRAS2 Human 50ug | ProSpecBio | Cat. No. PRO-728 |
| RRAS Human 10ug | ProSpecBio | Cat. No. PRO-808 |
| RAP1A Human 10ug | ProSpecBio | Cat. No. PRO-848 |
| H-Ras (wild-type) (human), (recombinant) | Enzo Life Sciences | Cat. No. BML-SE131-0100 |
| Recombinant Human K-Ras 25ug | Cell Biolabs | Cat. No. STA-748 |
| Recombinant GST-tagged human RALGDS protein | Abcam | Cat. No. ab132590 |
| Methylene chloride | Fisher Scientific | Cat. No. D37-20 |
| Tetrahydrofuran, anydrous, 1L | Sigma-Aldrich | Cat. No. 186562-1L |
| 4-amino-N-(3-(5-((4-(2,6-dichlorobenzyl)piperazin-1-yl)methyl)-3-(4-(trifluoromethoxy)phenyl)-1H-indol-1-yl)propyl)piperidine-4-carboxamide (3144) | This study | N/A |
| tert-butyl 3-(5-formyl-1H-indol-1-yl)propylcarbamate (2) | This study | N/A |
| tert-butyl 3-(3-bromo-5-formyl-1H-indol-1-yl)propylcarbamate (3) | This study | N/A |
| tert-butyl 3-(5-formyl-3-(4-(trifluoromethoxy)phenyl)-1H-indol-1-yl)propylcarbamate (4) | This study | N/A |
| 1-(2,6-dichlorobenzyl)piperazine (5) | This study | N/A |
| tert-butyl 3-(5-((4-(2,6-dichlorobenzyl)piperazin-1-yl)methyl)-3-(4-(trifluoromethoxy)phenyl)-1H-indol-1-yl)propylcarbamate (6) | This study | N/A |
| 3-(5-((4-(2,6-dichlorobenzyl)piperazin-1-yl)methyl)-3-(4-(trifluoromethoxy)phenyl)-1H-indol-1-yl)propan-1-amine (7) | This study | N/A |
| tert-butyl 4-amino-4-(3-(5-((4-(2,6-dichlorobenzyl)piperazin-1-yl)methyl)-3-(4-(trifluoromethoxy)phenyl)-1H-indol-1-yl)propylcarbamoyl)piperidine-1-carboxylate (8) | This study | N/A |
| 4-amino-N-(3-(4-((4-(2-(4-chlorophenoxy)ethyl)piperazin-1-yl)methyl)-3-(3-fluorophenyl)-1H-indol-1-yl)propyl)piperidine-4-carboxamide: 3443 | This study | N/A |
| 5-chloro-2-(4-(trifluoromethoxy)benzyloxy)benzaldehyde | This study | N/A |
| 4-((5-chloro-2-((4-(trifluoromethoxy)benzyl)oxy)benzyl)amino)-N-(3-(4-((4-(2-(4-chlorophenoxy)ethyl)piperazin-1-yl)methyl)-3-(3-fluorophenyl)-1H-indol-1-yl)propyl)piperidine-4-carboxamide (3495) | This study | N/A |
| N-(3-(5-((4-(3,5-dimethoxybenzyl)piperazin-1-yl)methyl)-3-(2,4-dimethoxyphenyl)-1H-indol-1-yl)propyl)piperazine-2-carboxamide (3603) | This study | N/A |
| 4-amino-N-(3-(4-((4-(2-(4-chlorophenoxy)ethyl)piperazin-1-yl)methyl)-3-(2-methoxyphenyl)-1H-indol-1-yl)propyl)piperidine-4-carboxamide (3445) | This study | N/A |
| N-(3-(5-((4-(3,5-bis(trifluoromethyl)benzyl)piperazin-1-yl)methyl)-3-(2,6-bis(trifluoromethyl)phenyl)-1H-indol-1-yl)propyl)piperazine-2-carboxamide (3256) | This study | N/A |
| N-(3-(5-((4-(2,6-dichlorobenzyl)piperazin-1-yl)methyl)-3-(4-(trifluoromethoxy)phenyl)-1H-indol-1-yl)propyl)-4-((4-((3,5-dimethoxybenzyl)oxy)-3-methoxybenzyl)amino)piperidine-4-carboxamide (4363) | This study | N/A |
| 4-((3-chloro-4-((4-fluorobenzyl)oxy)benzyl)amino)-N-(3-(4-((4-(2-(4-chlorophenoxy)ethyl)piperazin-1-yl)methyl)-3-(3-fluorophenyl)-1H-indol-1-yl)propyl)piperidine-4-carboxamide (3512) | This study | N/A |
| 4-((4-((3,5-bis(trifluoromethyl)benzyl)oxy)benzyl)amino)-N-(3-(5-((4-(2,6-dichlorobenzyl)piperazin-1-yl)methyl)-3-(4-(trifluoromethoxy)phenyl)-1H-indol-1-yl)propyl)piperidine-4-carboxamide (4365) | This study | N/A |
| N-(3-(5-((4-(2,6-dichlorobenzyl)piperazin-1-yl)methyl)-3-(4-(trifluoromethoxy)phenyl)-1H-indol-1-yl)propyl)-4-(((5-(2-isopropoxyphenyl)pyridin-2-yl)methyl)amino)piperidine-4-carboxamide (4373) | This study | N/A |
| Critical Commercial Assays | ||
| Lipofectamine 2000 | ThermoFisher Scientific | Cat. No. 11668019 |
| Lipofectamine RNAiMAX Transfection Reagent | Life Technologies | Cat. No. 13778-150 |
| Mouse microsomes (CD-1) | Life Technologies | Cat. No. MSMCPL |
| Human microsomes (pooled 50 donors, 20 mg/mL) | ThermoFisher Scientific | Cat. No. HMMCPL |
| QIAshredder | Qiagen | Cat. No. 79656 |
| RNAeasy extraction kit | Qiagen | Cat. No. 74106 |
| TaqMan Reverse Transcription Reagents | Applied Biosystems | Cat. No. N8080234 |
| Power SYBR Green PCR Master Mix | Thermo Fisher Scientific | Cat. No. 4368702 |
| ImmPACT DAB Peroxidase Substrate Kit | Vector Labs | Cat. No. SK-4105 |
| ImmPRESS HRP Anti-Rabbit IgG Peroxidase Polymer Detection Kit | Vector Labs | Cat. No. MP-7401 |
| CellTiter-Glo Luminescent Cell Viability Assay | Promega | Cat. No. G7573 |
| Apo-One Caspase 3/7 assay | Promega | Cat. No. G7790 |
| Deposited Data | ||
| Raw mass spectrometry files https://chorusproject.org/anonymous/download/experiment/3708034170230406717 | This paper | https://chorusproject.org/ |
| Experimental Models: Cell Lines | ||
| Phoenix-AMPHO | ATCC | Cat. No. CRL-3213 |
| Kraslox/lox, Hras−/−, Nras−/− RERTnert/ert mouse embryo fibroblasts (MEFs) | Laboratory of Mariano Barbacid | Cat. No. DU315-6 |
| Hras−/−; Nras−/−; Kraslox/lox BRAF(V600E)-CAAX MEFs | This paper | N/A |
| DLD-1 | ATCC | Cat. No. CCL-221 |
| BL21-Gold (DE3) Competent Cells | Stratagene | Cat. No. 230132 |
| MDA-MB-231 | ATCC | Cat. No. HTB-26 |
| Experimental Models: Organisms/Strains | ||
| C57 male Mus musculus (mouse), 6–7 weeks of age, ~25g weight, black coat color, MHC Haplotype H2b | Charles River Laboratories | Strain: 027 (C57BL/6) |
| Nu/Nu athymic nude Mus musculus (mouse), Crl:NU-Foxn1nu, hairless, albino | Charles River Laboratories | Strain:088 (Homozygous) |
| KRASLSLG12D; p53fl/fl; Pdx1-Cre (KPf/fC) mice | Laboratory of Ken Olive | N/A |
| Mus musculus (mouse), Strain: Rag2-γc-, female, 4 weeks old, weight 22–24g, Genotype:Il2rgtm1.1Flv Rag2tm1.1Flv | Jackson Laboratories | Cat. No. 014593 | Rag2-γc- |
| Recombinant DNA | ||
| BRAF(V600E)CAAX plasmid | This paper | N/A |
| pBABE-puro plasmid | Addgene | Plasmid # 1764 |
| pBABE puro KRAS G12V | Addgene | Plasmid # 9052 |
| pBabe puro BRAF-V600E | Addgene | Plasmid # 15269 |
| pBabe puro HA PIK3CA E545K | Addgene | Plasmid # 12525 |
| pBABEbleo-Flag-BRAF V600E | Addgene | Plasmid # 53156 |
| pLL7.0: Venus-iLID-CAAX plasmid | Addgene | Plasmid # 60411 |
| Human KRAS4B sequence containing the oncogenic Q61H mutation in pENTR221 vector | Invitrogen | Ultimate ORF Clone IOH9852 |
| Wild-type human KRAS4B sequence in pENTR221 vector | This study | N/A |
| G12D KRAS4B encoding the catalytic domain (amino acids 1-169) cloned into Nde I-BamH I sites of pET-15b vector (Novagen) containing N-terminal His6 tag. | This study | N/A |
| Sequence-Based Reagents | ||
| ON-TARGETplus siRNA SMARTpool targeting HRAS | GE Dharmacon | Cat No. L-004142-00-0005 |
| ON-TARGETplus siRNA SMARTpool targeting NRAS | GE Dharmacon | Cat No. L-003919-00-0005 |
| ON-TARGETplus siRNA SMARTpool targeting KRAS | GE Dharmacon | Cat No. L-005069-00-0010 |
| ON-TARGETplus Non-targeting Pool siRNAs | GE Dharmacon | Cat No. D-001810-10-20 |
| siDEATH: AllStars Hs Cell Death Control siRNA | QIAGEN | Cat No. 1027299 |
| Software and Algorithms | ||
| Glide version 2012–2016 (Schrödinger Suite) | Schrödinger, Inc. | N/A |
| Molecular Operating Environment | Chemical Computing Group | N/A |
| ChemDraw Ultra | Perkin Elmer | version 10.0 |
| Prism 5.0c | GraphPad Software | N/A |
| Other | ||
| PrestoBlue Cell Viability Reagent | Life Technologies | Cat. No. A13262 |
| Fetal Bovine Serum | Thermo Fisher Scientific | Cat. No. 10437-028 |
| Heat inactivated fetal bovine serum | ||
| Penicillin-Streptomycin, liquid | Thermo Fisher Scientific | Cat. No. 15140163 |
| Dulbecco’s Modified Eagle Medium | Fisher Scientific | Cat. No. 10-013-CM |
| Opti-mem | Invitrogen | |
| Polybrene | Santa Cruz Biotechnology | Cat. No. sc-134220 |
| 1X RPMI 1640 vitamin stock | Sigma-Aldrich | Cat. No. R7256 |
| GlutaMAX | Life Technologies | Cat. No. 35050-061 |
| CellTiter-Glo® Luminescent Cell Viability Assay | Promega | Cat. No. G7573 |
| Corning Gentest 3P NADPH regenerating system solution A | Fisher Scientific | Cat. No. NC1096251 |
| Corning Gentest 3P NADPH regenerating system system B | Fisher Scientific | Cat. No. NC1095811 |
| QuikChange II Site-Directed Mutagenesis Kit, 10 Rxn | Agilent Technologies | Cat. No. 200523 |
| Protease inhibitor tablet | Sigma-Aldrich | Cat. No. 11836170001 |
| Ni Sepharose 6 Fast Flow beads | GE Life Sciences | Cat. No. 17-5318-01 |
| NAP-5 Columns (GE Healthcare), 20 P | GE Life Sciences | Cat. No. 17-0853-01 |
| Raf-1 RBD agarose beads | EMD Millipore | Cat. No. 14-278 |
| Ral Assay Reagent (Ral BP1, agarose) | EMD Millipore | Cat. No. 14-415 |
| Protein Labeling Kit RED-MALEIMIDE Monolith NT.115 (Cysteine Reactive) | NanoTemper Technologies GmbH | Cat. No. MO-L004 |
| Standard Treated Capillaries Monolith NT.115 | NanoTemper Technologies GmbH | Cat. No. MO-K002 |
| NT-647-NHS-ester dye | NanoTemper Technologies GmbH | Cat. No. MO-L001 |
| SYPRO® Orange Protein Gel Stain (5,000X Concentrate in DMSO) | Thermo Fisher Scientific | Cat. No. S6650 |
| 250 UN alkaline phosphatase on agar beads | Sigma-Aldrich | Cat. No. P0762 |
| Corningware Ultra Low Attachment (ULA) Plates | Corning | Cat. No. CLS 3474 |
Supplementary Material
(A) Structure of best-scoring ionization state of compound 3144 when docked into KRASG12D-GTP using Glide (Schrödinger). (B) Glide scores of compound 3144 docked into the indicated structures. The docking score is in kcal/mol: the difference in binding for two compounds is ΔΔG= ΔG2- ΔG1= RT * ln (KD2/KD1); at 25 °C, a difference in binding score of 1.36 kcal/mol corresponds to a 10-fold difference in KD; more negative values indicate a higher predicted affinity. (C) Calculated properties of compound 3144 (Schrödinger Suite).
(A) 1H-15N HSQC (Heteronuclear Single Quantum Coherence) spectrum of 15N-labeled KRASG12D. (B) 3D-1H-15N-1H-NOESY (Nuclear Overhauser Effect Spectroscopy)-HSQC and 3D-1H-15N-1H-TOCSY (Total Correlation Spectroscopy)-HSQC experiments were performed to confirm assignments. Representative strips for residues T35-E37 in KRASG12D from 15N-NOESY-HSQC spectrum (blue) and 15N TOCSY-HSQC spectrum (purple). The 15N TOCSY-HSQC spectrum helped identify the spin system and the 15N NOESY-HSQC spectrum was used for sequential assignments. The path in red shows the sequential NOEs of HN-HN or HN-Hα. (C) Chemical shift changes in KRASG12D upon binding to compound 3144. Shown is a superimposed 1H-15N HSQC spectrum of KRASG12D alone (blue) and in the presence of five-fold excess of 3144 (red). A magnified view of the residues in the switch I and switch II region that are affected by the presence of 3144 is shown. Chemical shift differences (Δ δNH) for each residue in the KRASG12D sequence upon binding to 3144 are summarized in the lower panel; the weighted mean of 1H and 15N chemical shift changes is plotted as a red line; the mean shift change + 1 SD is plotted as a dashed line. The bottom right panel shows the residues showing significant shifts mapped onto the docked structure of 3144 on KRASG12D. (D) Crystals of the indicated proteins used to solve the structures by x-ray crystallography. KRASG12D-GppNHp in 0.1 M Bis-Tris 25% (w/v) PEG-3350 pH 5; KRASG12D-GDP 0.2 M sodium phosphate dibasic 20% (w/v) PEG-3350 pH 9.1; KRASG12V-GDP 0.1 M Bis-Tris 25% (w/v) PEG-3350 pH 6.5. (E) Detection of nucleotides bound to 50 μM KRASG12D using nano-electrospray mass spectrometry. Samples were diluted in 50% MeOH with 0.05% formic acid (MeOH, mostly denaturing conditions) or 10 mM ammonium acetate (AA, native conditions). +++ represents high abundance, ++ represents medium abundance and + represents low abundance of each species.
(A) Correlation of sensitivity of a panel of cell lines to mutant RAS knockdown with 2.5 μM 3144 treatment. Viability was measured 72 h after reverse transfection with siRNA reagents targeting only the mutated RAS isoform, or targeting only KRAS when no isoform was mutated. siDeath control resulted in neary complete loss of viability. The effect of 3144 on viability was measured after treatment in 6-well format for 24 h with 2.5 μM 3144. (B) Summary of cell lines tested for sensitivity to 3144 and RAS knockdown. The IC50 (concentrated required for 50% inhibition of viable cell number) values for 3144, and viability after transfection of the indicated siRNA reagents were determined in each cell line using Alamar Blue and Trypan Blue exclusion (Vi-Cell). The degree of remaining target mRNA after siRNA transfection was measured by qPCR and is indicated. (C) Induction of caspase 3/7 activity by 3144. HT-1080 cells were treated with 3144 or staurosporine for 24 h. Cells were lysed and treated with a pro-fluorescent caspase 3/7 substrate (rhodamine 110 bis-N-CBZ-L-aspartyl-L-glutamyl-L-valyl-L-aspartic acid amide) for 16 h and fluorescence measured as an indication of executioner caspase activity, which is induced after loss of RAS expression. (D) Ability of 3144 to prevent anchorage-independent growth. Images of MDA-MB-231 cells after 72 h in low adherence plates forming 3D multicellular spheroids when untreated or treated with 3144. Dose-response curves of the effect of 3144 on viability in MDA-MB-231 and SW480 cells grown in low adherence plates, expressed as growth inhibition. (E) Measurement of cellular concentrations of 3144. DLD-1 cells were treated for 4 h with 0.5 μM or 5 μM 3144 under the serum conditions indicated, cells were washed, counted, average cell diameter recorded, and the amount of 3144 associated with cells determined by LC-MS. (F) Effect of transfection of mutant KRAS, PI3K, and BRAF on 3144 lethality. HT-1080 cells were retrovirally transfected with a pBABE-puro empty vector or vector containing KRASG12V, PI3KE545K, or BRAFV600E. Following selection with puromycin, a population of the PI3KE545K-transfected cells were transfected a second time with a pBABE-neo-BRAFV600E vector and selected a second time with geneticin. Stable cell lines were treated with 3144 for 24 h in 6-well format. Cell lysates were analyzed by western blot of phosphorylated ERK1/2 and AKT (S473) compared to total ERK1/2 and AKT, in transfected cell lines. Immediately preceding the evaluation of 3144 lethality, a sample of cells from each transfection condition was lysed and analyzed. (G) qPCR analysis of KRAS, PI3K, and BRAF after transfections. Each transfected population was analyzed for expression of each targeted gene.
(A) Effect of cell density on the lethality of the indicated concentrations of 3144 after 48 h treatment in 96-well plates in triplicate, with mean value indicated. Viability was measured using Alamar Blue. Error bars indicate one SD. Note that complete knockdown of all RAS isoforms causes cell death in DLD-1 cells, which were used in this experiment; we hypothesized that an incomplete knockdown of pan-RAS mediated by siRNA could maintain viability at the time point in this experiment, but due to the lower RAS expression, would increase sensitivity to 3144 (which would in turn support the hypothesis that 3144 lethality can be mediated through RAS inhibition). With these points in mind, we chose siRNA treatment conditions that resulted in a ~70% reduction in panRAS protein level, leaving 30% remaining that supports viability. In addition, the fact that low concentrations of 3144 did not affect viability in siRAS-treated cells does not mean that siRAS did not affect viability by itself. In this experiment, DLD1 cells were treated with si-panRAS for 72 h, after which they were dissociated, and counted. At this point there was inhibition of viability (75% remaining viable cells). These cells were then reseeded in 384-well plates, to ensure that there as an equal number of cells in the siNT and siRAS wells, controlling for any differential effect of cell number on 3144 sensitivity. The 100% viability in the low concentration 3144 si-panRAS-treated samples indicates 100% viability relative to the non-3144-treated si-panRAS wells – it does not indicate that si-panRAS was 100% viable compared to siNT. (B) The effect of 3144 and tamoxifen at the indicated concentrations on growth inhibition of Kraslox/lox, Hras−/−, Nras−/− RERTnert/ert MEFs. Cells were treated in 6-well format with 2.5 μM or 5 μM 3144 or DMSO for 24 h. In parallel, cells were treated with DMSO or 600 nM 4OH-tamoxifen for 6 d. Relative growth inhibition compared to DMSO is plotted. Error bars indicate 1 SD. When these MEFs are fully devoid of HRAS, NRAS and KRAS, they are viable, but do not proliferate, unless an activated and membrane-targeted BRAF allele is expressed. We examined the effect of 3144 vs 4-OHT on viability of these cells, and found that they both leave a number of non-proliferating cells. (C) DU315-6 cells (Kraslox/lox, Hras−/−, Nras−/− RERTnert/ert mouse embryo fibroblasts (MEFs)) were seeded at 0.2 million/well in 6 well plates (indicated by the red line). After 16 h incubation, the cells were treated with different concentration of 3144 to determine which concentrations were cytostatic. The cell density was measured after 24 h treatment using Trypan Blue exclusion (Vi-cell). The experiment was done in duplicate and the mean +/− 1 SD is indicated. (D) The activity of 3144 in a variety of radioligand binding assays against other targets was measured at a concentration of 2.5 μM 3144. The degree of inhibition of the radioligand in each case is indicated.
(A) Analysis of cleaved caspase-3 in KPf/fC mice tumor sections Immunohistochemistry of tumor sections taken before and after 3144 treatment were stained with an anti-cleaved-caspase-3 antibody. (B) Quantification of the levels of cleaved caspase-3. Levels are expressed as cleaved caspase-3 positive cells per 40X field. Shown is average of 3 sections taken from 3 separate mice ± 1 standard deviation. (C) 3144 displays genotype-selective toxicity. Survival curve of KPf/fC and wild-type mice receiving 30 mg/kg 3144 once daily for five days. (D) Measurement of wild-type mouse weight each day of the five day study described in (C). (E) The effect of 3144 on the levels of phosphorylated ERK in an MDA-MB-231 xenograft. Mice were injected with 8 million MDA-MB-231 cells, grown to an average size of 128 cubic millimeters, and treated with either vehicle or 3144 (30 mg/kg) intraperitoneally once per day for 6 days. The tumors were then dissected, lysed and the lysate analyzed by western blotting for total ERK1/2 and phosphorylated ERK1/2 (pERK1/2).
Table S1. Summary of crystallographic information. Related to Figure 1. This table summarizes the crystallographic parameters. 1. The numbers in parentheses are for the highest resolution shell. 2. 5% of the reflections were selected for free R calculation.
Table S2. List of sequence-based reagents (see separate Excel file). Related to STAR Methods.
Table S3. Detection of nucleotide ligands bound to 50 μM KRAS by nano-electrospray mass spectrometry. Related to Figure 2. Samples were diluted in 50% MeOH with 0.05% formic acid or 10 mM ammonium acetate. See supporting detailed data below. Key: +++ represents high abundance, ++ represents medium abundance and + represents low abundance of each detected species.
Table S4. Mass spectrometry data showing nucleotide binding of KRASG12D. Related to Figure 2. *Occurrence of gluconoylation and phosphogluconoylation are an artifact of His-tags as applied in E. coli (Geoghegan et al., 1999).
Acknowledgments
We thank Neil Whalen, Stuart Myers and Howard Robinson for setting up the X29 beamline at the NSLS. The in-house X-ray diffraction instrument was purchased with an NIH grant to L.T. (S10OD012018). This research was supported by grants to BRS (NIH 5R01CA097061, 5R01GM085081, and R01CA161061). We thank Dr. John Decatur and the Columbia Chemistry NMR core facility (NSF grant CHE 0840451 and NIH grant 1S10RR025431-01A1) for assistance in compound characterization, Michael Gaschler for providing the RHEB protein used for microscale thermophoresis, Dr. Michael Goger from New York Structural Biology Center (NYSBC) for assistance with 3D-NMR data acquisition. We thank Neil Whalen, Stuart Myers and Howard Robinson for setting up the X29 beamline at the NSLS. The in-house X-ray diffraction instrument was purchased with an NIH grant to LT (S10OD012018). B.R.S. is a member of the New York Structural Biology Center. The data collected at NYSBC was made possible by a grant from NYSTAR. AK was supported by the Training Program in Molecular Biophysics T32GM008281. BRS is a founder, consultant and shareholder of Kyras Therapeutics, which has licensed intellectual property described in this manuscript; BRS and MEW are recipients of royalty payments from this license. All animal studies were approved by the Columbia University IACUC.
Footnotes
Author Contributions
M.E.W., B.R.S. and J.M.C. designed, performed and analyzed the results of computational analyses and synthetic chemistry. A.K. and B.R.S. designed, performed and analyzed the results of molecular cloning, protein expression, purification, ITC, and protein NMR analyses. M.E.W., A.K., J.M.C. and B.R.S. designed, performed and analyzed MST experiments. A.K., C.H., T.T. and L.T. generated x-ray crystal structures. M.E.S., Y.Z., M.E.W. and B.R.S. designed, performed and analyzed cell culture studies. M.S.-M. and A.F. performed and analyzed in vitro and in vivo studies with T-ALL patient samples. P.B., A.Z. and B.R.S. designed, performed and analyzed cell accumulation and metabolic stability in liver microsomes. M.E.W., W.S.Y., and B.R.S. designed, performed and analyzed the cell-line xenograft study. M.A.B., M.E.W., B.R.S. and K.P.O. designed, performed and analyzed the KPC mouse study. J.M.C., B.R.S., R.N. and S.C. designed, performed and analyzed in vivo pharmacokinetics. B.R.S. supervised the overall project. B.R.S. and M.E.W. wrote the manuscript, with input from other authors.
Publisher's Disclaimer: This is a PDF file of an unedited manuscript that has been accepted for publication. As a service to our customers we are providing this early version of the manuscript. The manuscript will undergo copyediting, typesetting, and review of the resulting proof before it is published in its final citable form. Please note that during the production process errors may be discovered which could affect the content, and all legal disclaimers that apply to the journal pertain.
References
- Adams PD, Grosse-Kunstleve RW, Hung L-W, Ioerger TR, McCoy AJ, Moriarty NW, Read RJ, Sacchettini JC, Sauter NK, Terwilliger TC. PHENIX: building a new software for automated crystallographic structure determination. Acta Cryst. 2002;D58:1948–1954. doi: 10.1107/s0907444902016657. [DOI] [PubMed] [Google Scholar]
- Arkin MR, Tang Y, Wells JA. Small-molecule inhibitors of protein-protein interactions: progressing toward the reality. Chem Biol. 2014;21:1102–1114. doi: 10.1016/j.chembiol.2014.09.001. [DOI] [PMC free article] [PubMed] [Google Scholar]
- Arkin MR, Wells JA. Small-molecule inhibitors of protein-protein interactions: progressing towards the dream. Nat Rev Drug Discov. 2004;3:301–317. doi: 10.1038/nrd1343. [DOI] [PubMed] [Google Scholar]
- Bardeesy N, Aguirre AJ, Chu GC, Cheng KH, Lopez LV, Hezel AF, Feng B, Brennan C, Weissleder R, Mahmood U, et al. Both p16(Ink4a) and the p19(Arf)-p53 pathway constrain progression of pancreatic adenocarcinoma in the mouse. Proc Natl Acad Sci USA. 2006;103:5947–5952. doi: 10.1073/pnas.0601273103. [DOI] [PMC free article] [PubMed] [Google Scholar]
- Block C, Janknecht R, Herrmann C, Nassar N, Wittinghofer A. Quantitative structure-activity analysis correlating Ras/Raf interaction in vitro to Raf activation in vivo. Nature structural biology. 1996;3:244–251. doi: 10.1038/nsb0396-244. [DOI] [PubMed] [Google Scholar]
- Burns MC, Sun Q, Daniels RN, Camper D, Kennedy JP, Phan J, Olejniczak ET, Lee T, Waterson AG, Rossanese OW, et al. Approach for targeting Ras with small molecules that activate SOS-mediated nucleotide exchange. Proc Natl Acad Sci USA. 2014;111:3401–3406. doi: 10.1073/pnas.1315798111. [DOI] [PMC free article] [PubMed] [Google Scholar]
- Burris HA, 3rd, Moore MJ, Andersen J, Green MR, Rothenberg ML, Modiano MR, Cripps MC, Portenoy RK, Storniolo AM, Tarassoff P, et al. Improvements in survival and clinical benefit with gemcitabine as first-line therapy for patients with advanced pancreas cancer: a randomized trial. J Clin Oncol. 1997;15:2403–2413. doi: 10.1200/JCO.1997.15.6.2403. [DOI] [PubMed] [Google Scholar]
- Chiang MY, Xu L, Shestova O, Histen G, L’Heureux S, Romany C, Childs ME, Gimotty PA, Aster JC, Pear WS. Leukemia-associated NOTCH1 alleles are weak tumor initiators but accelerate K-ras-initiated leukemia. The Journal of clinical investigation. 2008;118:3181–3194. doi: 10.1172/JCI35090. [DOI] [PMC free article] [PubMed] [Google Scholar]
- Colletti LM, Liu Y, Koev G, Richardson PL, Chen CM, Kati W. Anal Biochem. 2008;383(2):186. doi: 10.1016/j.ab.2008.08.012. [DOI] [PubMed] [Google Scholar]
- Colicelli J. Human RAS superfamily proteins and related GTPases. Sci STKE. 2004;2004:RE13. doi: 10.1126/stke.2502004re13. [DOI] [PMC free article] [PubMed] [Google Scholar]
- Cox AD, Fesik SW, Kimmelman AC, Luo J, Der CJ. Drugging the undruggable RAS: Mission possible? Nat Rev Drug Discov. 2014;13:828–851. doi: 10.1038/nrd4389. [DOI] [PMC free article] [PubMed] [Google Scholar]
- Dolma S, Lessnick SL, Hahn WC, Stockwell BR. Identification of genotype-selective antitumor agents using synthetic lethal chemical screening in engineered human tumor cells. Cancer Cell. 2003;3:285–296. doi: 10.1016/s1535-6108(03)00050-3. [DOI] [PubMed] [Google Scholar]
- Downward J. Targeting RAS signalling pathways in cancer therapy. Nat Rev Cancer. 2003;3:11–22. doi: 10.1038/nrc969. [DOI] [PubMed] [Google Scholar]
- Geoghegan KF, Dixon HBF, Rosner PJ, Hoth LR, Lanzetti AJ, Borzilleri KA, Marr ES, Pezzullo LH, Martin LB, LeMotte PK, et al. Spontaneous alpha-N-6-phosphogluconoylation of a “His tag” in Escherichia coli: The cause of extra mass of 258 or 178 Da in fusion proteins. Analytical Biochemistry. 1999;267:169–184. doi: 10.1006/abio.1998.2990. [DOI] [PubMed] [Google Scholar]
- Gysin S, Salt M, Young A, McCormick F. Therapeutic strategies for targeting ras proteins. Genes & cancer. 2011;2:359–372. doi: 10.1177/1947601911412376. [DOI] [PMC free article] [PubMed] [Google Scholar]
- Hall BE, Bar-Sagi D, Nassar N. The structural basis for the transition from Ras-GTP to Ras-GDP. PNAS. 2002;99:12138–12142. doi: 10.1073/pnas.192453199. [DOI] [PMC free article] [PubMed] [Google Scholar]
- Hewitt SH, Wilson AJ. Metal complexes as “protein surface mimetics”. Chem Commun (Camb) 2016;52:9745–9756. doi: 10.1039/c6cc03457h. [DOI] [PubMed] [Google Scholar]
- Hopkins AL, Groom CR. The druggable genome. Nat Rev Drug Discov. 2002;1:727–730. doi: 10.1038/nrd892. [DOI] [PubMed] [Google Scholar]
- Huang L, Hofer F, Martin GS, Kim SH. Structural basis for the interaction of Ras with RalGDS. Nature structural biology. 1998;5:422–426. doi: 10.1038/nsb0698-422. [DOI] [PubMed] [Google Scholar]
- Huang L, Weng X, Hofer F, Martin GS, Kim SH. Three-dimensional structure of the Ras-interacting domain of RalGDS. Nature structural biology. 1997;4:609–615. doi: 10.1038/nsb0897-609. [DOI] [PubMed] [Google Scholar]
- Jahnke W, Erlanson DA. Fragment-based approaches in drug discovery. Weinheim Chichester: Wiley-VCH ; John Wiley, distributor; 2006. [Google Scholar]
- Johnson L, Greenbaum D, Cichowski K, Mercer K, Murphy E, Schmitt E, Bronson RT, Umanoff H, Edelmann W, Kucherlapati R, et al. K-ras is an essential gene in the mouse with partial functional overlap with N-ras. Genes Dev. 1997;11:2468–2481. doi: 10.1101/gad.11.19.2468. [DOI] [PMC free article] [PubMed] [Google Scholar]
- Kaelin WG., Jr The concept of synthetic lethality in the context of anticancer therapy. Nat Rev Cancer. 2005;5:689–698. doi: 10.1038/nrc1691. [DOI] [PubMed] [Google Scholar]
- Karnoub AE, Weinberg RA. Ras oncogenes: split personalities. Nat Rev Mol Cell Biol. 2008;9:517–531. doi: 10.1038/nrm2438. [DOI] [PMC free article] [PubMed] [Google Scholar]
- Malumbres M, Barbacid M. RAS oncogenes: the first 30 years. Nat Rev Cancer. 2003;3:459–465. doi: 10.1038/nrc1097. [DOI] [PubMed] [Google Scholar]
- Maurer T, Garrenton LS, Oh A, Pitts K, Anderson DJ, Skelton NJ, Fauber BP, Pan B, Malek S, Stokoe D, et al. Small-molecule ligands bind to a distinct pocket in Ras and inhibit SOS-mediated nucleotide exchange activity. Proc Natl Acad Sci USA. 2012;109:5299–5304. doi: 10.1073/pnas.1116510109. [DOI] [PMC free article] [PubMed] [Google Scholar]
- McCormick F. Cancer therapy based on oncogene addiction. J Surg Oncol. 2011;103:464–467. doi: 10.1002/jso.21749. [DOI] [PubMed] [Google Scholar]
- McCoy AJ, Grosse-Kunstleve RW, Adams PD, Winn MD, Storoni LC, Read RJ. Phaser crystallographic software. J Appl Cryst. 2007;40:658–674. doi: 10.1107/S0021889807021206. [DOI] [PMC free article] [PubMed] [Google Scholar]
- Murshudov GN, Vagin AA, Dodson EJ. Refinement of macromolecular structures by the maximum-likelihood method. Acta Cryst. 1997;D53:240–255. doi: 10.1107/S0907444996012255. [DOI] [PubMed] [Google Scholar]
- Oberstein PE, Olive KP. Pancreatic cancer: why is it so hard to treat? Therap Adv Gastroenterol. 2013;6:321–337. doi: 10.1177/1756283X13478680. [DOI] [PMC free article] [PubMed] [Google Scholar]
- Ostrem JM, Peters U, Sos ML, Wells JA, Shokat KM. K-Ras(G12C) inhibitors allosterically control GTP affinity and effector interactions. Nature. 2013;503:548–551. doi: 10.1038/nature12796. [DOI] [PMC free article] [PubMed] [Google Scholar]
- Ostrem JM, Shokat KM. Direct small-molecule inhibitors of KRAS: from structural insights to mechanism-based design. Nat Rev Drug Discov. 2016 doi: 10.1038/nrd.2016.139. [DOI] [PubMed] [Google Scholar]
- Otwinowski Z, Minor W. Processing of X-ray diffraction data collected in oscillation mode. Method Enzymol. 1997;276:307–326. doi: 10.1016/S0076-6879(97)76066-X. [DOI] [PubMed] [Google Scholar]
- Pacold ME, Suire S, Perisic O, Lara-Gonzalez S, Davis CT, Walker EH, Hawkins PT, Stephens L, Eccleston JF, Williams RL. Crystal structure and functional analysis of Ras binding to its effector phosphoinositide 3-kinase gamma. Cell. 2000;103:931–943. doi: 10.1016/s0092-8674(00)00196-3. [DOI] [PubMed] [Google Scholar]
- Piovan E, Yu J, Tosello V, Herranz D, Ambesi-Impiombato A, Da Silva AC, Sanchez-Martin M, Perez-Garcia A, Rigo I, Castillo M, et al. Direct reversal of glucocorticoid resistance by AKT inhibition in acute lymphoblastic leukemia. Cancer cell. 2013;24:766–776. doi: 10.1016/j.ccr.2013.10.022. [DOI] [PMC free article] [PubMed] [Google Scholar]
- Prior IA, Hancock JF. Ras trafficking, localization and compartmentalized signalling. Seminars in cell & developmental biology. 2012;23:145–153. doi: 10.1016/j.semcdb.2011.09.002. [DOI] [PMC free article] [PubMed] [Google Scholar]
- Prior IA, Lewis PD, Mattos C. A comprehensive survey of ras mutations in cancer. Cancer Res. 2012;72:2457–2467. doi: 10.1158/0008-5472.CAN-11-2612. [DOI] [PMC free article] [PubMed] [Google Scholar]
- Sastra SA, Olive KP. Acquisition of Mouse Tumor Biopsies through Abdominal Laparotomy. Cold Spring Harb Protoc. 2014 Jan 1;(1):47–56. doi: 10.1101/pdb.prot077834. [DOI] [PMC free article] [PubMed] [Google Scholar]
- Scheffzek K, Ahmadian MR, Kabsch W, Wiesmuller L, Lautwein A, Schmitz F, Wittinghofer A. The Ras-RasGAP complex: structural basis for GTPase activation and its loss in oncogenic Ras mutants. Science. 1997;277:333–338. doi: 10.1126/science.277.5324.333. [DOI] [PubMed] [Google Scholar]
- Shaw RJ, Cantley LC. Ras, PI(3)K and mTOR signalling controls tumour cell growth. Nature. 2006;441:424–430. doi: 10.1038/nature04869. [DOI] [PubMed] [Google Scholar]
- Shima F, Yoshikawa Y, Ye M, Araki M, Matsumoto S, Liao J, Hu L, Sugimoto T, Ijiri Y, Takeda A, et al. In silico discovery of small-molecule Ras inhibitors that display antitumor activity by blocking the Ras-effector interaction. Proc Natl Acad Sci USA. 2013;110:8182–8187. doi: 10.1073/pnas.1217730110. [DOI] [PMC free article] [PubMed] [Google Scholar]
- Spiegel J, Cromm PM, Zimmermann G, Grossmann TN, Waldmann H. Small-molecule modulation of Ras signaling. Nat Chem Biol. 2014;10:613–622. doi: 10.1038/nchembio.1560. [DOI] [PubMed] [Google Scholar]
- Stephen AG, Esposito D, Bagni RK, McCormick F. Dragging ras back in the ring. Cancer Cell. 2014;25:272–281. doi: 10.1016/j.ccr.2014.02.017. [DOI] [PubMed] [Google Scholar]
- Sun Q, Burke JP, Phan J, Burns MC, Olejniczak ET, Waterson AG, Lee T, Rossanese OW, Fesik SW. Discovery of small molecules that bind to K-Ras and inhibit Sos-mediated activation. Angew Chem Int Ed Engl. 2012;51:6140–6143. doi: 10.1002/anie.201201358. [DOI] [PMC free article] [PubMed] [Google Scholar]
- Sun Q, Phan J, Friberg AR, Camper DV, Olejniczak ET, Fesik SW. A method for the second-site screening of K-Ras in the presence of a covalently attached first-site ligand. J Biomol NMR. 2014;60:11–14. doi: 10.1007/s10858-014-9849-8. [DOI] [PMC free article] [PubMed] [Google Scholar]
- Tanaka T, Rabbitts TH. Interfering with RAS-effector protein interactions prevent RAS-dependent tumour initiation and causes stop-start control of cancer growth. Onco. 2010;29:6064–6070. doi: 10.1038/onc.2010.346. [DOI] [PubMed] [Google Scholar]
- Tsutsumi K, Fujioka Y, Tsuda M, Kawaguchi H, Ohba Y. Visualization of Ras-PI3K interaction in the endosome using BiFC. Cell Signal. 2009;21:1672–1679. doi: 10.1016/j.cellsig.2009.07.004. [DOI] [PubMed] [Google Scholar]
- Urosevic J, Sum EY, Moneo V, Drosten M, Dhawahir A, Becerra M, Carnero A, Barbacid M. Using cells devoid of RAS proteins as tools for drug discovery. Mol Carcinog. 2009;48:1038–1047. doi: 10.1002/mc.20555. [DOI] [PubMed] [Google Scholar]
- van Hattum H, Waldmann H. Chemical biology tools for regulating RAS signaling complexity in space and time. Chem Biol. 2014;21:1185–1195. doi: 10.1016/j.chembiol.2014.08.001. [DOI] [PubMed] [Google Scholar]
- Vassilev LT, Vu BT, Graves B, Carvajal D, Podlaski F, Filipovic Z, Kong N, Kammlott U, Lukacs C, Klein C, et al. In vivo activation of the p53 pathway by small-molecule antagonists of MDM2. Science. 2004;303:844–848. doi: 10.1126/science.1092472. [DOI] [PubMed] [Google Scholar]
- Vigil D, Cherfils J, Rossman KL, Der CJ. Ras superfamily GEFs and GAPs: validated and tractable targets for cancer therapy? Nature reviews Cancer. 2010;10:842–857. doi: 10.1038/nrc2960. [DOI] [PMC free article] [PubMed] [Google Scholar]
- Vo U, Embrey KJ, Breeze AL, Golovanov AP. 1H, 13C and 15N resonance assignment for the human K-Ras at physiological pH. Biomol NMR Assign. 2013;7:215–219. doi: 10.1007/s12104-012-9413-y. [DOI] [PubMed] [Google Scholar]
- Walker K, Olson MF. Targeting Ras and Rho GTPases as opportunities for cancer therapeutics. Curr Opin Genet Dev. 2005;15:62–68. doi: 10.1016/j.gde.2004.11.001. [DOI] [PubMed] [Google Scholar]
- Wang W, Fang G, Rudolph J. Ras inhibition via direct Ras binding--is there a path forward? Bioorg Med Chem Lett. 2012;22:5766–5776. doi: 10.1016/j.bmcl.2012.07.082. [DOI] [PubMed] [Google Scholar]
- Ward AF, Braun BS, Shannon KM. Targeting oncogenic Ras signaling in hematologic malignancies. Blood. 2012;120:3397–3406. doi: 10.1182/blood-2012-05-378596. [DOI] [PMC free article] [PubMed] [Google Scholar]
- Weiwer M, Bittker JA, Lewis TA, Shimada K, Yang WS, MacPherson L, Dandapani S, Palmer M, Stockwell BR, Schreiber SL, et al. Development of small-molecule probes that selectively kill cells induced to express mutant RAS. Bioorg Med Chem Lett. 2012;22:1822–1826. doi: 10.1016/j.bmcl.2011.09.047. [DOI] [PMC free article] [PubMed] [Google Scholar]
- Yang WS, Stockwell BR. Synthetic lethal screening identifies compounds activating iron-dependent, nonapoptotic cell death in oncogenic-RAS-harboring cancer cells. Chem Biol. 2008;15:234–245. doi: 10.1016/j.chembiol.2008.02.010. [DOI] [PMC free article] [PubMed] [Google Scholar]
Associated Data
This section collects any data citations, data availability statements, or supplementary materials included in this article.
Supplementary Materials
(A) Structure of best-scoring ionization state of compound 3144 when docked into KRASG12D-GTP using Glide (Schrödinger). (B) Glide scores of compound 3144 docked into the indicated structures. The docking score is in kcal/mol: the difference in binding for two compounds is ΔΔG= ΔG2- ΔG1= RT * ln (KD2/KD1); at 25 °C, a difference in binding score of 1.36 kcal/mol corresponds to a 10-fold difference in KD; more negative values indicate a higher predicted affinity. (C) Calculated properties of compound 3144 (Schrödinger Suite).
(A) 1H-15N HSQC (Heteronuclear Single Quantum Coherence) spectrum of 15N-labeled KRASG12D. (B) 3D-1H-15N-1H-NOESY (Nuclear Overhauser Effect Spectroscopy)-HSQC and 3D-1H-15N-1H-TOCSY (Total Correlation Spectroscopy)-HSQC experiments were performed to confirm assignments. Representative strips for residues T35-E37 in KRASG12D from 15N-NOESY-HSQC spectrum (blue) and 15N TOCSY-HSQC spectrum (purple). The 15N TOCSY-HSQC spectrum helped identify the spin system and the 15N NOESY-HSQC spectrum was used for sequential assignments. The path in red shows the sequential NOEs of HN-HN or HN-Hα. (C) Chemical shift changes in KRASG12D upon binding to compound 3144. Shown is a superimposed 1H-15N HSQC spectrum of KRASG12D alone (blue) and in the presence of five-fold excess of 3144 (red). A magnified view of the residues in the switch I and switch II region that are affected by the presence of 3144 is shown. Chemical shift differences (Δ δNH) for each residue in the KRASG12D sequence upon binding to 3144 are summarized in the lower panel; the weighted mean of 1H and 15N chemical shift changes is plotted as a red line; the mean shift change + 1 SD is plotted as a dashed line. The bottom right panel shows the residues showing significant shifts mapped onto the docked structure of 3144 on KRASG12D. (D) Crystals of the indicated proteins used to solve the structures by x-ray crystallography. KRASG12D-GppNHp in 0.1 M Bis-Tris 25% (w/v) PEG-3350 pH 5; KRASG12D-GDP 0.2 M sodium phosphate dibasic 20% (w/v) PEG-3350 pH 9.1; KRASG12V-GDP 0.1 M Bis-Tris 25% (w/v) PEG-3350 pH 6.5. (E) Detection of nucleotides bound to 50 μM KRASG12D using nano-electrospray mass spectrometry. Samples were diluted in 50% MeOH with 0.05% formic acid (MeOH, mostly denaturing conditions) or 10 mM ammonium acetate (AA, native conditions). +++ represents high abundance, ++ represents medium abundance and + represents low abundance of each species.
(A) Correlation of sensitivity of a panel of cell lines to mutant RAS knockdown with 2.5 μM 3144 treatment. Viability was measured 72 h after reverse transfection with siRNA reagents targeting only the mutated RAS isoform, or targeting only KRAS when no isoform was mutated. siDeath control resulted in neary complete loss of viability. The effect of 3144 on viability was measured after treatment in 6-well format for 24 h with 2.5 μM 3144. (B) Summary of cell lines tested for sensitivity to 3144 and RAS knockdown. The IC50 (concentrated required for 50% inhibition of viable cell number) values for 3144, and viability after transfection of the indicated siRNA reagents were determined in each cell line using Alamar Blue and Trypan Blue exclusion (Vi-Cell). The degree of remaining target mRNA after siRNA transfection was measured by qPCR and is indicated. (C) Induction of caspase 3/7 activity by 3144. HT-1080 cells were treated with 3144 or staurosporine for 24 h. Cells were lysed and treated with a pro-fluorescent caspase 3/7 substrate (rhodamine 110 bis-N-CBZ-L-aspartyl-L-glutamyl-L-valyl-L-aspartic acid amide) for 16 h and fluorescence measured as an indication of executioner caspase activity, which is induced after loss of RAS expression. (D) Ability of 3144 to prevent anchorage-independent growth. Images of MDA-MB-231 cells after 72 h in low adherence plates forming 3D multicellular spheroids when untreated or treated with 3144. Dose-response curves of the effect of 3144 on viability in MDA-MB-231 and SW480 cells grown in low adherence plates, expressed as growth inhibition. (E) Measurement of cellular concentrations of 3144. DLD-1 cells were treated for 4 h with 0.5 μM or 5 μM 3144 under the serum conditions indicated, cells were washed, counted, average cell diameter recorded, and the amount of 3144 associated with cells determined by LC-MS. (F) Effect of transfection of mutant KRAS, PI3K, and BRAF on 3144 lethality. HT-1080 cells were retrovirally transfected with a pBABE-puro empty vector or vector containing KRASG12V, PI3KE545K, or BRAFV600E. Following selection with puromycin, a population of the PI3KE545K-transfected cells were transfected a second time with a pBABE-neo-BRAFV600E vector and selected a second time with geneticin. Stable cell lines were treated with 3144 for 24 h in 6-well format. Cell lysates were analyzed by western blot of phosphorylated ERK1/2 and AKT (S473) compared to total ERK1/2 and AKT, in transfected cell lines. Immediately preceding the evaluation of 3144 lethality, a sample of cells from each transfection condition was lysed and analyzed. (G) qPCR analysis of KRAS, PI3K, and BRAF after transfections. Each transfected population was analyzed for expression of each targeted gene.
(A) Effect of cell density on the lethality of the indicated concentrations of 3144 after 48 h treatment in 96-well plates in triplicate, with mean value indicated. Viability was measured using Alamar Blue. Error bars indicate one SD. Note that complete knockdown of all RAS isoforms causes cell death in DLD-1 cells, which were used in this experiment; we hypothesized that an incomplete knockdown of pan-RAS mediated by siRNA could maintain viability at the time point in this experiment, but due to the lower RAS expression, would increase sensitivity to 3144 (which would in turn support the hypothesis that 3144 lethality can be mediated through RAS inhibition). With these points in mind, we chose siRNA treatment conditions that resulted in a ~70% reduction in panRAS protein level, leaving 30% remaining that supports viability. In addition, the fact that low concentrations of 3144 did not affect viability in siRAS-treated cells does not mean that siRAS did not affect viability by itself. In this experiment, DLD1 cells were treated with si-panRAS for 72 h, after which they were dissociated, and counted. At this point there was inhibition of viability (75% remaining viable cells). These cells were then reseeded in 384-well plates, to ensure that there as an equal number of cells in the siNT and siRAS wells, controlling for any differential effect of cell number on 3144 sensitivity. The 100% viability in the low concentration 3144 si-panRAS-treated samples indicates 100% viability relative to the non-3144-treated si-panRAS wells – it does not indicate that si-panRAS was 100% viable compared to siNT. (B) The effect of 3144 and tamoxifen at the indicated concentrations on growth inhibition of Kraslox/lox, Hras−/−, Nras−/− RERTnert/ert MEFs. Cells were treated in 6-well format with 2.5 μM or 5 μM 3144 or DMSO for 24 h. In parallel, cells were treated with DMSO or 600 nM 4OH-tamoxifen for 6 d. Relative growth inhibition compared to DMSO is plotted. Error bars indicate 1 SD. When these MEFs are fully devoid of HRAS, NRAS and KRAS, they are viable, but do not proliferate, unless an activated and membrane-targeted BRAF allele is expressed. We examined the effect of 3144 vs 4-OHT on viability of these cells, and found that they both leave a number of non-proliferating cells. (C) DU315-6 cells (Kraslox/lox, Hras−/−, Nras−/− RERTnert/ert mouse embryo fibroblasts (MEFs)) were seeded at 0.2 million/well in 6 well plates (indicated by the red line). After 16 h incubation, the cells were treated with different concentration of 3144 to determine which concentrations were cytostatic. The cell density was measured after 24 h treatment using Trypan Blue exclusion (Vi-cell). The experiment was done in duplicate and the mean +/− 1 SD is indicated. (D) The activity of 3144 in a variety of radioligand binding assays against other targets was measured at a concentration of 2.5 μM 3144. The degree of inhibition of the radioligand in each case is indicated.
(A) Analysis of cleaved caspase-3 in KPf/fC mice tumor sections Immunohistochemistry of tumor sections taken before and after 3144 treatment were stained with an anti-cleaved-caspase-3 antibody. (B) Quantification of the levels of cleaved caspase-3. Levels are expressed as cleaved caspase-3 positive cells per 40X field. Shown is average of 3 sections taken from 3 separate mice ± 1 standard deviation. (C) 3144 displays genotype-selective toxicity. Survival curve of KPf/fC and wild-type mice receiving 30 mg/kg 3144 once daily for five days. (D) Measurement of wild-type mouse weight each day of the five day study described in (C). (E) The effect of 3144 on the levels of phosphorylated ERK in an MDA-MB-231 xenograft. Mice were injected with 8 million MDA-MB-231 cells, grown to an average size of 128 cubic millimeters, and treated with either vehicle or 3144 (30 mg/kg) intraperitoneally once per day for 6 days. The tumors were then dissected, lysed and the lysate analyzed by western blotting for total ERK1/2 and phosphorylated ERK1/2 (pERK1/2).
Table S1. Summary of crystallographic information. Related to Figure 1. This table summarizes the crystallographic parameters. 1. The numbers in parentheses are for the highest resolution shell. 2. 5% of the reflections were selected for free R calculation.
Table S2. List of sequence-based reagents (see separate Excel file). Related to STAR Methods.
Table S3. Detection of nucleotide ligands bound to 50 μM KRAS by nano-electrospray mass spectrometry. Related to Figure 2. Samples were diluted in 50% MeOH with 0.05% formic acid or 10 mM ammonium acetate. See supporting detailed data below. Key: +++ represents high abundance, ++ represents medium abundance and + represents low abundance of each detected species.
Table S4. Mass spectrometry data showing nucleotide binding of KRASG12D. Related to Figure 2. *Occurrence of gluconoylation and phosphogluconoylation are an artifact of His-tags as applied in E. coli (Geoghegan et al., 1999).