Abstract
Background & Aims
Approximately one-third of patients who present with constipation to gastroenterology care have rectal evacuation disorders. We aimed to compare rectal gas volume, measured by computerized tomography (CT), in constipated patients with and without rectal evacuation disorders.
Method
In a retrospective study, we collected data from 1553 patients with constipation, evaluated over 20 years. We analyzed data from 141 patients evaluated by anorectal manometry, balloon expulsion tests, and colon transit tests, collecting records of abdominal and pelvic CT examinations. Patients were classified into 3 subgroups: those with rectal evacuation disorders, slow transit constipation, or normal transit constipation. Two observers used standard CT software to identify variable regions of interest on each cross-sectional CT image that contained rectum and measured areas of gas in each slice; they then summated entire volumes of rectal gas. For the 3 groups, we compared rectal gas volume, maximal rectal gas transaxial area (measured by CT), and area of rectal gas (vertical) on the 2-dimensional abdominal film (scout) using the Kruskal Wallis test.
Results
The intra-class correlation coefficient between 2 observers' measurements of rectal gas volume was 0.99 (P<.001). There were overall group differences in rectal gas volume and maximal rectal gas transaxial area (both P<.001). Median rectal gas volume was higher in patients with rectal evacuation disorders (13.84 cm3) than in patients with slow transit (2.51 cm3) or normal transit constipation (1.33 cm3, both P<0.05). Similarly, area of rectal gas, which correlated with maximal rectal gas transaxial area (Spearman correlation coefficient, 0.7; P<.001), showed overall 3-group differences (P=.033), with greater areas of rectal gas on the abdominal scout film in patients with rectal evacuation disorders than in those with normal transit constipation.
Conclusion
In an analysis of patients with constipation, we found rectal gas volume, determined by abdominal CT imaging, to be greater in patients with than without rectal evacuation disorders.
Keywords: balloon expulsion, abdominal radiograph, colonic transit
INTRODUCTION
Chronic constipation is a common disorder with a prevalence of 2–27% in western countries.1–4 After exclusion of structural diseases, there are three large categories or subgroups of patients with chronic constipation: normal transit constipation, dyssynergic defecation or rectal evacuation disorders, and slow transit constipation (STC).5
Commonly applied symptom criteria recommend identification of straining or incomplete evacuation among patients with functional constipation.6 However, these symptoms do not specifically distinguish constipation resulting from abnormal colonic function from that arising from failure of rectal evacuation, as may occur in patients with pelvic floor dyssynergia, descending perineum syndrome or anismus.7 Among patients in the community with symptoms consistent with constipation, approximately one-third report straining or sense of incomplete rectal evacuation that are suggestive of a rectal evacuation disorder. In fact, in a cohort of 1411 patients presenting with constipation to a single physician in a gastroenterology practice in secondary or tertiary care, almost 30% had evidence of a rectal evacuation disorder.8 A therapeutic trial of increased dietary fiber differentiated simple constipation from that due to slow transit, drug-induced constipation, or evacuation disorder, but could not differentiate among the latter three groups.9
Rectal evacuation disorders are the most common cause of refractory chronic constipation.3, 10 Identification of rectal evacuation disorders has required formal testing with anorectal manometry, balloon expulsion7 or defecography (e.g. with magnetic resonance imaging) to confirm the typical clinical features identified on history and rectal examination5 that suggest a rectal evacuation disorder. Magnetic resonance (MR) defecography or dynamic pelvic MRI can evaluate pelvic floor anatomy, dynamic motion, and rectal evacuation simultaneously with excellent resolution of anal sphincters, levator ani muscles and soft tissue surrounding the rectum without radiation exposure. However, the major limitations include high cost and lack of availability, suggesting that alternative radiological approaches are desirable to screen for the presence of rectal evacuation disorders among the large numbers of patients presenting with constipation.
In healthy subjects who underwent infusion of gas mixture into the jejunum, impaired propulsion and self-restrained anal evacuation increased gas retention.11 Moreover, in healthy subjects, infusion of gas into the rectum produced marked relaxation of the rectum12 and potentially collection of gas there.
Our study hypothesis was that the constipation associated with rectal evacuation disorders is associated with greater volume of gas in the rectum than in constipated patients without rectal evacuation disorders.
The aim of this study was to compare the rectal gas volume measured on CT imaging between constipated patients with and without rectal evacuation disorders.
METHODS
This medical record review study was approved by the Mayo Clinic Institutional Review Board (IRB #16-003630) for patients who had provided unrestricted consent to the use of their medical records for research purposes. The study population,13–22 criteria for rectal evacuation disorders, slow or normal transit constipation,23–26 and conduct of procedures, anorectal manometry and balloon expulsion studies8 and colonic transit measurements,15 are detailed in the Supplemental Material.
Identification of Rectum on CT Scans
After preliminarily studying several images from these patients without knowledge of the subgroup, we standardized the vertical extent of rectal gas from the transaxial slice at the lower margin on the pubic symphysis to slice at the entry to the lower pelvis, that is, the lower margin of the sacro-iliac joints. These anatomical landmarks served to standardize the comparison of rectal gas volumes in the three groups of patients and to minimize the potential of including part of the sigmoid colon, with its variable extent, shape and orientation, in the pelvis. Adopting this approach based on these bony landmarks was necessary because standard anatomical texts do not provide a clear definition of the upper extent of the rectum or any anatomical demarcation between the rectum and the sigmoid colon. Our definition of the rectum reflected the straight part (“rectum” = straight) of the distal colon in the lesser pelvis delineated by the lower margin of the sacro-iliac joints, in contrast to the more variable anatomical structure of the sigmoid (“sigmoid” = S shaped) colon located in the greater pelvis and lower abdomen. This approach was used for the transaxial CT images as well as the evaluation of the surface area of the rectal gas on the abdominal scout film of the CT.
Measurement of rectal gas volume
Previous studies have used CT assessment of intestinal gas volume by using specialized software programs.27, 28 We used the abdomen-pelvic CT obtained as close as possible to the time of the definitive diagnosis of subtype of chronic constipation (based on clinical criteria and anorectal manometry), as long as the medical record documented the presence of constipation at the time of the CT scan. We adopted the method used in the measurement of volume of solid organ using software available as a standard program on CT imaging.29, 30 This method assessed the area using a manually operated variable region of interest (ROI) tool on each cross-sectional CT slice that contained rectum to carefully outline the area of gas in the rectum in each slice, multiplied by the slice thickness. The area of ROI was automatically computed using Quick query Radiographs and photographs Electronic Analysis and Display Station (QREADs version 5.7.2). We then summated the volume of each slice for the entire gas identified in the rectum. Thus, summated rectal gas volume was expressed as cm3 using the formula:
The measurement of RGV was performed independently by 2 observers (SYP and DK) who were instructed on how to identify and measure RGVs. Before starting the study, the two observers performed measurements on 10 standard cases, and inter- and intra-observer coefficients of correlation and inter-class correlation coefficients were calculated to evaluate the inter-observer reliability.
Measurement of rectal gas area on abdomen scout film
By using abdomen scout film on abdomen CT, the surface area of rectal gas was outlined by using the same manually operated ROI approach, and the software program calculated the area.
Statistical Analysis
Comparisons between the three groups (rectal evacuation disorders, slow or normal transit constipation) were performed by Kruskal Wallis test for the descriptive characterization of the three groups. The primary analyses of interest were the comparisons between rectal gas volume and maximal rectal gas area in any transaxial slice, and rectal gas area in abdomen scout film in the three subgroups; this analysis was also conducted using Kruskal Wallis test, followed by Dunn's test for the pairwise comparisons. A secondary analysis compared the 2 groups without rectal evacuation disorder (NTC and STC groups) vs. with rectal evacuation disorder (Mann-Whitney test). Correlations between rectal gas area on abdominal scout film and rectal gas volume, and rectal gas maximum area on CT imaging were performed using non-parametric rank correlation (Spearman correlation, Rs).
We also appraised the Spearman correlation between rectal gas volumes and weight added to achieve balloon expulsion from the rectum.
To assess the ability of RGV to predict the rectal evacuation disorder, the area under the receiver operating characteristics (ROC) curve was tested for both the CT scan images of volume and maximal area as well as the scout film (surrogate for a plain abdominal radiograph). Through this analysis, we also estimated the sensitivity, specificity, positive and negative predictive values (PPV and NPV respectively) based on specific cut-offs. Given the objective to appraise the imaging method as a means to screen for rectal evacuation disorders, we selected optimizing sensitivity, with the goal of achieving >70% sensitivity; however, it was important to appraise the associated specificity, as well as the PPV and NPV.
RESULTS
Patient Demographics and Past History
Supplemental Figure 1 shows a flow chart with the patient cohort starting at 1553 medical records. Among 141 patients who had the results of anorectal manometry with balloon expulsion test, colon transit study, and conventional abdomen-pelvic CT, we excluded 23 patients who met any of the exclusion criteria. Therefore, 118 patients were included in this study. There were 63 patients with evacuation disorders and 55 without evacuation disorders (17 with STC and 38 with NTC). Seventeen patients with evacuation disorders (27.0%) had overall slow colonic transit. The mean age was 42.9 years, 102 were females, and 66 patients had undergone prior abdominal or pelvic surgery (Supplemental Table 1). Patients had undergone CT within 8 months (25%–75%, 2–16 months) before or after the assessment for constipation.
Characterization of Anorectal Manometry and Colon Transit in Three Subtypes of Chronic Constipation
The results of anorectal manometry and colon transit study in the three groups of patients are summarized in Table 1 and Supplemental Table 2. There were significant difference in maximum anal resting pressure, GC24 and GC48 among the three groups (all p<0.001). There was no significant difference in maximum anal squeeze pressure among the three groups. Maximum anal resting pressure was higher in RED (92.6 ±27.6mmHg) than in non-RED (74.2±26.7mmHg, p<0.001) (Supplemental Table 2). There was borderline reduced distal colonic content of isotope (descending, and rectosigmoid colon and stool) among the three subgroups at 24 and 48 hours; the group with slow transit constipation demonstrated lowest content of isotope in the distal colonic segments (Supplemental Table 3).
Table 1.
Comparison of anorectal manometry characteristics, added balloon weight and colon transit according to the subtype of chronic constipation in 118 patients
| Data show mean ± SD unless otherwise stated | Patients with rectal evacuation disorders (n=65) | Patients with slow colonic transit (n=17) | Patients with normal colonic transit (n=38) | p-value* |
|---|---|---|---|---|
| Age, years | 39.6±16.9 | 47.8±10.9 | 46.3±16.1 | 0.053 |
| Female, n (%) | 52 (82.8) | 17 (100) | 33 (86.8) | 0.175 |
| BMI, kg/m2 | 23.0±4.3 | 22.5±2.7 | 23.0±3.7 | 0.892 |
| Maximum anal resting pressure, mmHg | 92.6±27.6 | 47.8 | 78.8±25.6 | <0.001 |
| Maximum anal squeeze pressure, mmHg | 173.6±71.2 | 64.0±27.1 | 170.5±73.6 | 0.603 |
| GC24 (n=115)++ median (10%–90%) | n=61 1.80 (1.10–3.46) | n=17 1.20 (0.42–1.60) | n=37 1.88 (1.38–4.12) | <0.001 |
| GC48 (n=68) median (10%–90%) | n=32 2.60 (1.70–4.47) | n=14 1.70 (0.65–2.40) | n=22 2.47 (2.00–4.27) | <0.001 |
SD, standard deviation; BMI, body mass index; GC geometric center refers to colonic transit; GC24, geometric center at 24 hr; GC48, geometric center at 48 hr;
data unavailable in 3 patients, 1 without evacuation disorder;
by Kruskal Wallis test
Assessments of Observer Measurements of Rectal Gas Volume (RGV)
To assess intra-observer reliability, each observer measured each RGV for three standard cases at three different times at least 24 hours apart. The observers were blinded to the measurement performed previously. The intra-class correlation coefficient (ICC) between the two observers was 0.999 (95% confidence interval 0.997~0.999, p <0.001), indicating excellent agreement between observers (ICC approaches 1.0 if there is an excellent agreement between the observers for the measured parameters). ICC for intra-observer variability in each of the two observers was 0.999 (p<0.001).
Rectal Gas Volume, Rectal Gas Maximum Area, and Rectal Gas Area on Scout Film in Subgroups of Patients
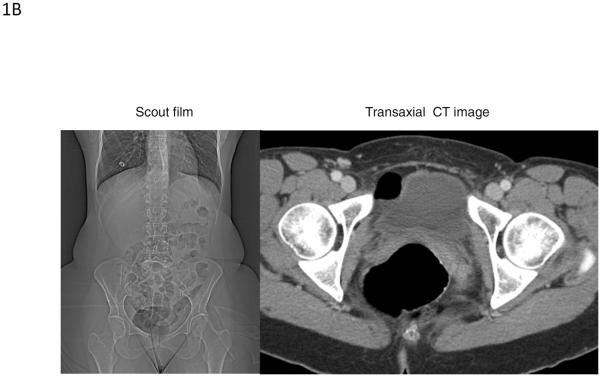
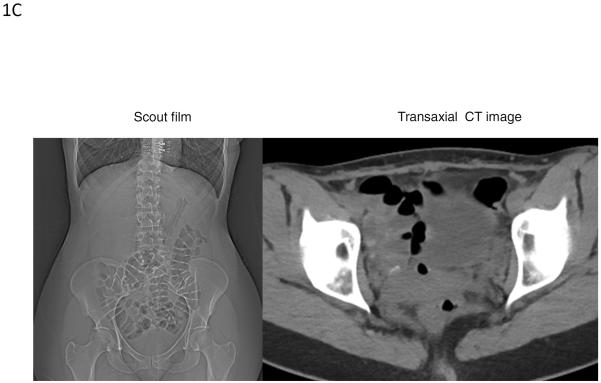
Figure 1A and B show images of two patients with rectal evacuation disorders as shown by the retained isotope in the left colon at 24 hours and in the rectum at 48 hours, as well as the gas in the rectum in the abdominal scout film, coronal and transaxial images. Figure 1C shows examples of rectal gas in a patient without a rectal evacuation disorder shown on abdominal scout film and on transaxial image through the mid-rectum.
Figure 1A.
Images from a 28 year-old female with rectal evacuation disorder as shown by the retained isotope in the left colon at 24 hours (lower middle panel) and in the rectum at 48 hours (lower right panel), as well as the gas in the rectum in the abdominal scout film (upper left panel), and coronal (upper right panel) and transaxial (lower left panel) images.
Figure 1B.
Images from a 52 year-old female with evacuation disorder demonstrating trapped gas in the rectum shown by the abdominal scout film (left panel) and cross-sectional image on CT (right panel). The measured rectal gas volume and maximum rectal gas area were 12.7 cm3 and 28.6 cm2, respectively.
Figure 1C.
Examples of rectal gas visualization in a patient without a rectal evacuation disorder. Images show the abdominal scout film (left panel) and cross-sectional image on CT (right panel) from a 34 year-old female with slow transit constipation. The rectal gas volume of 2.51cm3 and maximum rectal gas area of 1.5cm2 were considerably lower in this patient than in the patient with a rectal evacuation disorder shown in Figure 1B.
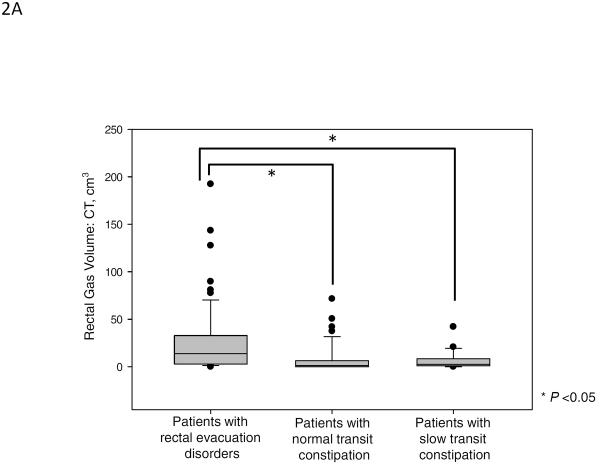
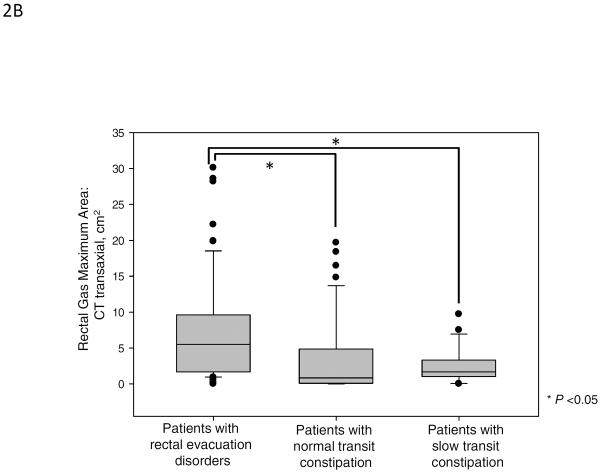
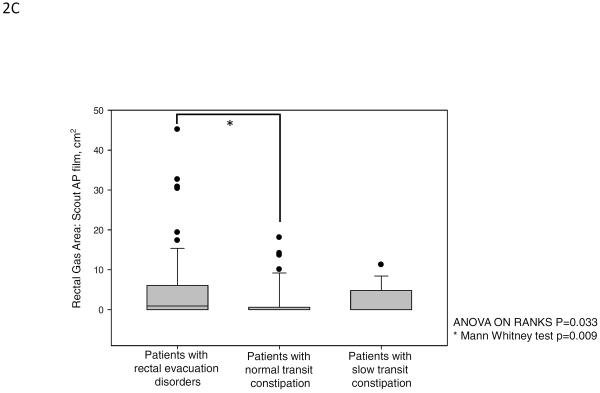
Figure 2 and Table 2A show the results of rectal gas volume, rectal gas maximum area, and rectal gas area on scout film. There were significant differences in rectal gas volume, rectal gas maximum area, and rectal gas area on scout film among the three groups. Patients with rectal evacuation disorders had higher rectal gas volume [median (10%–90%), 13.84 cm3 (1.29 cm3–73.98 cm3)] compared to patients without rectal evacuation disorder [1.88 cm3 (0.00 cm3–27.38 cm3), p<0.001]. And also, patients with rectal evacuation disorder had higher rectal gas maximum area (p<0.001) and rectal gas area on scout film (p=0.016) compared to patients without rectal evacuation disorders (Table 2B). In subgroup analysis, patients with rectal evacuation disorders had higher rectal gas volume than patients with normal transit constipation [1.33 cm3 (0.00 cm3–37.86 cm3), p<0.05]. And, patients with rectal evacuation disorder had higher rectal gas maximum area and rectal gas area on scout film than patients with normal transit constipation (all p<0.05, Figure 2). Furthermore, patients with rectal evacuation disorders had higher rectal gas volume than patients with slow transit constipation [2.51 cm3 (0.01 cm3–24.96 cm3), p<0.05]. Patients with rectal evacuation disorder had higher rectal gas maximum area than patients with slow transit constipation (p<0.05, Figure 2). However, there were no significant differences in rectal gas volume, rectal gas maximum area, and rectal gas area on scout film between patients with slow transit constipation and patients with normal transit constipation (p>0.05, Figure 2). In fact, a rectal gas maximum surface area of >5cm (noting that the median value for RED was 5.51cm2) was observed in 54.0% (34/63) of patients with an evacuation disorder, in 11.8% of slow transit constipation, and in 23.7% of normal transit constipation (p<0.001). Among the patients with rectal evacuation disorders, 28.6% (18/63) had rectal gas volumes above the 90th percentile of rectal gas volumes of patients without rectal evacuation disorders (>27.38 cm3). Among patients with rectal gas area on scout film >5cm, 61.5% (16/26) had rectal evacuation disorders.
Figure 2.
Rectal gas volume (median, IQR), maximal rectal gas area and rectal gas area on abdominal scout film in patients with rectal evacuation disorders, normal transit constipation and slow transit constipation. There were significant differences in rectal gas volume (A), rectal gas maximum area on CT (B), and rectal gas area on abdominal scout film (C) among the three groups (p<0.001, p<0.001, and p=0.033, respectively).
Table 2A.
Comparison of rectal gas volume and maximum rectal gas area according to the subtype of chronic constipation in 118 patients
| Data show mean ± SD unless otherwise stated | Patients with rectal evacuation disorders (n=63) | Patients with slow colonic transit (n=17) | Patients with normal colonic transit (n=38) | p-value* |
|---|---|---|---|---|
| RGV, cm3 median (10%–90%) | 13.84 (1.29–73.98) | 2.51 (0.01–24.96) | 1.33 (0.00–37.86) | <0.001 |
| Maximum rectal gas area, cm2 median (10%–90%) | 5.51 (0.94–19.18) | 1.67 (0.03–7.95) | 0.83 (0.00–14.98) | <0.001 |
| Rectal gas area on scout abdominal film, cm2 median (10%–90%) | 7.73 (0.00–16.22) | 0.00 (0.00–9.00) | 0.00 (0.00–10.47) | 0.050 |
SD, standard deviation; BMI, body mass index; RGV, rectal gas volume; IQR, interquartile range;
Kruskal Wallis test
Table 2B.
Comparison of rectal gas volume and maximum rectal gas area according to the presence of evacuation disorders in 118 patients
| Data show mean ± SD unless otherwise stated | Patients with rectal evacuation disorders (n=63) | Patients without rectal evacuation disorders (n=55) | p-value* |
|---|---|---|---|
| Age, years | 39.6±16.9 | 46.8±14.6 | 0.016 |
| Female, n (%) | 52 (82.5) | 50 (90.9) | 0.185 |
| BMI, kg/m2 | 23.0±4.3 | 22.8±3.4 | 0.779 |
| RGV, cm3 median (10%–90%) | 13.84 (1.29–73.98) | 1.88 (0.00–27.38) | <0.001 |
| Maximum RGA, cm2 median (10%–90%) | 5.51 (0.94–19.18) | 1.30 (0.00–10.24) | <0.001 |
| Rectal gas area on scout abdominal film, cm2 median (10%–90%) | 7.73 (0.00–16.22) | 0.00 (0.00–9.11) | 0.016 |
SD, standard deviation; BMI, body mass index; RGV, rectal gas volume; RGA, rectal gas area; IQR, interquartile range;
Mann-Whitney U test
Correlation between Rectal Gas Area on Abdominal Scout Film with Both Rectal Gas Volume and Rectal Gas Maximum Area
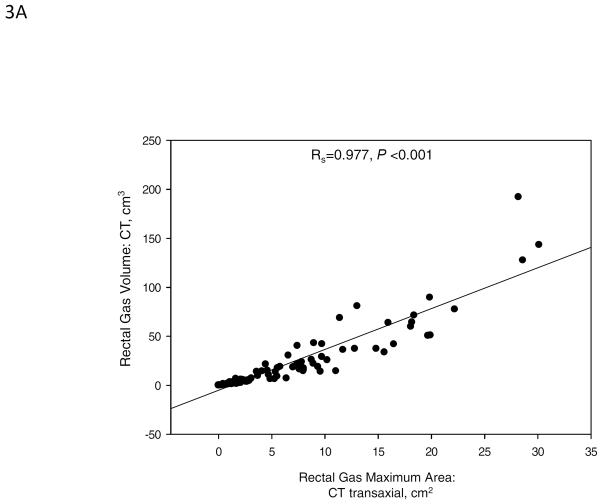
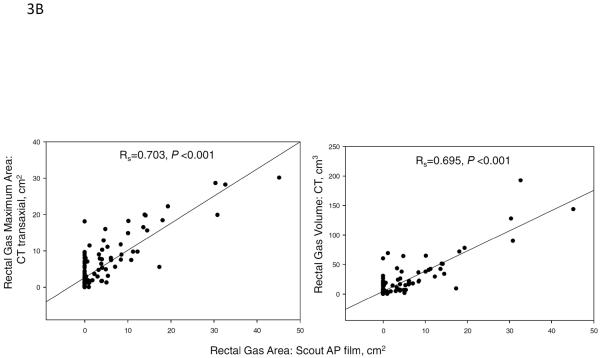
In our study, the rectal gas volume was correlated with the rectal gas maximum area on the transaxial image by CT (Spearman correlation coefficient, Rs=0.977, p<0.001, Figure 3A). In addition, there were significant correlations between rectal gas area on scout film with rectal gas volume (Rs=0.703, p<0.001) and with rectal gas maximum area on CT (Rs=0.695, p<0.001, Figure 3B).
Figure 3.
(A) Spearman correlation between total rectal gas volume and rectal gas maximum area, both measured on transaxial CT (Spearman correlation coefficient, Rs=0.977, p<0.001). (B) Spearman correlation between rectal gas area on abdominal scout film and rectal gas volume (Rs=0.703, p<0.001, right panel) and rectal gas maximum area (Rs=0.695, p<0.001, left panel) on transaxial CT.
Diagnostic Accuracy of Rectal Gas Volume, Rectal Gas Maximum Area, and Rectal Gas Area on CT Images and Scout Film for Predicting the Rectal Evacuation Disorder
To assess the ability of RGV to predict the rectal evacuation disorder, the area under the ROC curve (AUC) was tested. The ROC of the model of rectal gas volume (on CT imaging) for predicting rectal evacuation disorder showed AUC of 0.751 (p<0.001, 95% CI 0.663–0.838). Similarly, the ROC of the model of rectal gas maximal area (on CT imaging) showed AUC of 0.737 (p<0.001, 95% CI 0.651–0.831). Finally, the ROC of the model of rectal gas area on the scout film (surrogate for abdominal X-ray) showed AUC of 0.623 (p=0.029, 95% CI 0.516~0.718). Table 2C documents the sensitivity, specificity, PPV and NPV for each of the measurements using specified cut-off values. Consistent with our objective to use imaging-based measurements as a screen for rectal evacuation disorders, we wished to achieve approximately 80% sensitivity. For the CT-based measurements of volume and maximal area, we noted that sensitivities of 70–75% were associated with >60% specificity.
Table 2C.
Accuracy of Rectal Gas volume, Rectal Gas Maximum Area, and Rectal Gas Area on CT images and Scout Film for predicting the rectal evacuation disorder
| Rectal gas measurement | AUC | p-value | Cut-off value | Sensitivity | Specificity | PPV | NPV |
|---|---|---|---|---|---|---|---|
| Volume of CT | 0.751 | <0.001 | 3.80 cm3 | 71.4% | 65.5% | 70.31% | 66.67% |
| Maximal area on CT | 0.737 | <0.001 | 1.75 cm2 | 74.6% | 63.6% | 70.15% | 68.63% |
| Area on scout film | 0.617 | 0.029 | 0.70 cm2 | 50.8% | 70.9% | 66.67% | 55.71% |
Spearman Correlation between Rectal Gas Volumes and Weight Added to the Balloon Expulsion Test
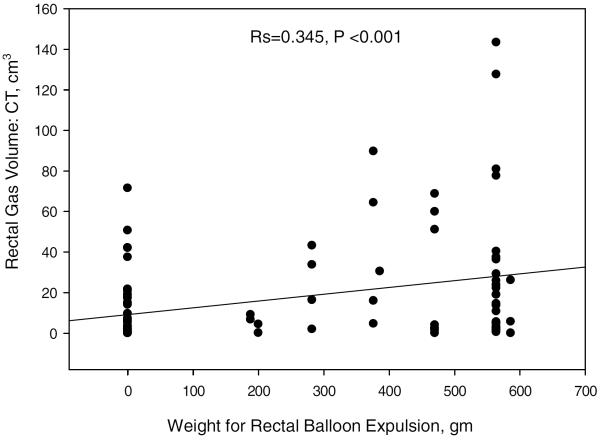
The rectal gas volume was correlated with the weight added to the balloon expulsion test to allow evacuation (Spearman correlation coefficient, Rs=0.345, p<0.001, Figure 4).
Figure 4.
Spearman correlation between total rectal gas volume and weight added to the balloon expulsion test (Spearman correlation coefficient, Rs=0.345, p<0.001).
DISCUSSION
Our study shows that the rectal gas volume and the maximal rectal area containing gas are significantly higher in constipated patients with rectal evacuation disorders compared to patients with slow transit constipation and normal transit constipation. Our ROC analysis of the CT-acquired data provides cut-off values that provide sensitivity of >70% at a reasonable specificity (>60%) and predictive values, and provides further support to our hypothesis that abdominal CT imaging, usually performed for diagnostic purposes in patients with constipation, could be used to identify patients who have features suspicious for rectal evacuation disorders and who should undergo formal testing of the evacuation functions such as anorectal manometry, balloon expulsion test and MR defecography. While the sensitivity of the scout abdominal radiograph is lower (50%), the higher specificity suggests that, with further prospective evaluation, it may be possible to use the information from the abdominal radiograph as a screen for RED.
These original observations build upon prior discussions of the role of abdominal imaging in patients with constipation. Among imaging modalities, CT is one of commonly used modalities for excluding obstructive organic lesions such as masses or strictures in patients with chronic constipation. Other radiological studies such as plain abdominal x-ray or radiopaque marker transit are performed more frequently among patients with constipation, and may demonstrate fecal loading in the colon or retardation of colonic transit. However, these tests have low specificity for identifying rectal evacuation disorders, since stool retention and marker retention (including radioisotope in scintigraphic studies) may be distributed throughout the colon, and the accumulation of markers exclusively in the distal colon is relatively uncommon in patients with proven rectal evacuation disorders. In fact, a recent analysis of patients with constipation associated with overall delay in colonic transit showed that scintigraphic evaluation over 48 hours was unable to differentiate slow transit constipation from a rectal evacuation disorder.13
Benninga et al. evaluated the potential of plain abdominal radiographs in pediatric gastroenterology practice and concluded that there was insufficient evidence for a diagnostic association between clinical symptoms of functional constipation or functional non-retentive fecal incontinence and fecal loading on an abdominal radiograph.31 However, this study did not evaluate or measure rectal gas volume or rectal fecal mass in the functional constipation group to assess the potential difference between rectal evacuation disorders and other pediatric patients with constipation.
In previously published studies, patients with rectal evacuation disorders had delayed colonic transit compared with healthy controls.8 Indeed, among patients with dyssynergic defecation, 55–64% of adults and 12% of adolescents had delayed overall colonic transit.3, 32, 33 In our current study, 26.6% of patients with rectal evacuation disorders had delayed overall colonic transit, suggesting low sensitivity of overall transit to identify rectal evacuation disorders. Similarly, rectosigmoid transit, assessed by the radiopaque marker technique, showed that, at a sensitivity of 80%, there was only 10% specificity for discriminating pelvic floor dysfunction from other subtypes of constipation.34 Therefore, an alternative approach is necessary to raise suspicion for a rectal evacuation disorder before conducting definitive confirmatory tests such as anorectal manometry and balloon expulsion test (which is not widely available) or performing MRI defecography, which requires special expertise and increases costs associated with diagnosis. We perceive that abdominal and pelvic radiological imaging provides such an alternative approach.
Previous studies document several methods for measuring intestinal gas volume in plain abdominal radiographs35–38 and abdominal CT imaging.26, 28 In our study, we measured the gas volume only in the rectum, rather than the entire bowel or colon. Thus, we adopted the method used in measurement of the volumes of solid organs or masses, based on the sum of each slice's volume (area in each slice multiplied by slice thickness).29, 30 In our study, two observers measured rectal gas volumes and maximum rectal gas area on each slice of the CT showing gas in the rectum, and the area of rectal gas on the abdominal scout film based on a manual drawing of rectal gas using a variable ROI program. Our experience shows that the method used is relatively simple and easily applicable in a clinical setting. Furthermore, given the excellent agreement (ICC) in rectal gas volume measurements by the two independent observers, the measurements are accurate.
Prior measurements of colorectal gas in patients with evacuation disorders have seldom been reported in the literature. First, in patients who had undergone anterior resection of the rectum with preservation of anal sphincters, left colon gas volume was higher in patients receiving laxatives than in patients without laxative use; moreover, patients with feeling of incomplete evacuation had higher left colon gas volume score.38 In another study, colonic gas volume score in the left colon was correlated with left colonic transit37, which may be associated with evacuation disorders.
The use of a standard imaging program using the variable ROI software typically used for estimating size of solid lesions in the abdomen enhances the feasibility of the proposed method. Further prospective validation is required using the CT imaging method as well as the use of a simple abdominal radiograph in a separate cohort. Thus, we propose that even more useful than further studies with CT would be the validation of the rectal gas area on a plain abdominal x-ray, as this would involve lower radiation exposure and lower costs, to develop a tool to screen for rectal evacuation disorders. The feasibility of the latter approach is supported by our observation that rectal gas area on the abdominal scout film of the CT scan is significantly correlated with the rectal gas volume and with the maximal surface area of the rectum on the abdominal CT, and it demonstrates significant differences between constipated patients with and without rectal evacuation disorders. The estimated total effective radiation exposure doses with abdomen CT scans are 6.9 millisievert (mSV, where 1 mSv is the dose produced by exposure to 1 milligray of radiation) in males and 7.2 mSV in females, whereas total effective radiation exposure doses with plain abdomen x-ray are 0.4 mSV in males and females. We conclude that the rectal gas volume on abdominal CT imaging is greater in constipated patients with rectal evacuation disorders than in patients without rectal evacuation disorders and should be prospectively evaluated for its utility to identify a higher pre-test probability for rectal evacuation disorders on formal anorectal testing.
Supplementary Material
Acknowledgements
The authors thank Mrs. Cindy Stanislav for excellent secretarial assistance.
Funding: Dr. Camilleri is supported by NIH grant R01-DK92179.
Abbreviations used
- ARM
anorectal manometry
- BET
balloon expulsion test
- CT
computerized tomography
- MRI
magnetic resonance imaging
- MRTGA
maximal rectal gas transaxial area
- NTC
normal transit constipation
- RED
rectal evacuation disorders
- RGV
rectal gas volume
- STC
slow transit constipation
Footnotes
Publisher's Disclaimer: This is a PDF file of an unedited manuscript that has been accepted for publication. As a service to our customers we are providing this early version of the manuscript. The manuscript will undergo copyediting, typesetting, and review of the resulting proof before it is published in its final citable form. Please note that during the production process errors may be discovered which could affect the content, and all legal disclaimers that apply to the journal pertain.
Authors' contributions: M. Camilleri: study concept and design; analysis and interpretation of data; drafting and finalizing the manuscript; study supervision
Deborah Eckert: patient recruitment and care
SeonYoung Park: Analysis of electronic medical records and measurements on CT images; drafting the manuscript
Dish Khemani: Analysis of electronic medical records and measurements on CT images
Alfred Nelson: Analysis of electronic medical records and identification of patients for analysis
Disclosures: The authors have no conflicts of interests.
References
- 1.Sethi S, Mikami S, Leclair J, Park R, Jones M, Wadhwa V, Sethi N, Cheng V, Friedlander E, Bollom A, Lembo A. Inpatient burden of constipation in the United States: an analysis of national trends in the United States from 1997 to 2010. Am J Gastroenterol. 2014;109:250–6. doi: 10.1038/ajg.2013.423. [DOI] [PubMed] [Google Scholar]
- 2.Talley NJ. Functional gastrointestinal disorders as a public health problem. Neurogastroenterol Motil. 2008;1:121–9. doi: 10.1111/j.1365-2982.2008.01097.x. [DOI] [PubMed] [Google Scholar]
- 3.Surrenti E, Rath DM, Pemberton JH, Camilleri M. Audit of constipation in a tertiary referral gastroenterology practice. Am J Gastroenterol. 1995;90:1471–5. [PubMed] [Google Scholar]
- 4.Pare P, Ferrazzi S, Thompson WG, Irvine EJ, Rance L. An epidemiological survey of constipation in canada: definitions, rates, demographics, and predictors of health care seeking. Am J Gastroenterol. 2001;96:3130–7. doi: 10.1111/j.1572-0241.2001.05259.x. [DOI] [PubMed] [Google Scholar]
- 5.Lembo A, Camilleri M. Chronic constipation. N Engl J Med. 2003;349:1360–8. doi: 10.1056/NEJMra020995. [DOI] [PubMed] [Google Scholar]
- 6.Mearin F, Lacy BE, Chang L, Chey WD, Lembo AJ, Simren M, Spiller R. Bowel Disorders. Gastroenterology. 2016;18:00222–5. doi: 10.1053/j.gastro.2016.02.031. [DOI] [PubMed] [Google Scholar]
- 7.Mearin F, Lacy BE, Chang L, Chey WD, Lembo AJ, Simren M, Spiller R. Bowel Disorders. Gastroenterology. 2016 doi: 10.1053/j.gastro.2016.02.031. [DOI] [PubMed] [Google Scholar]
- 8.Nullens S, Nelsen T, Camilleri M, Burton D, Eckert D, Iturrino J, Vazquez-Roque M, Zinsmeister AR. Regional colon transit in patients with dys-synergic defaecation or slow transit in patients with constipation. Gut. 2012;61:1132–9. doi: 10.1136/gutjnl-2011-301181. [DOI] [PMC free article] [PubMed] [Google Scholar]
- 9.Voderholzer WA, Schatke W, Muhldorfer BE, Klauser AG, Birkner B, Muller-Lissner SA. Clinical response to dietary fiber treatment of chronic constipation. Am J Gastroenterol. 1997;92:95–8. [PubMed] [Google Scholar]
- 10.Iantorno G, Cinquetti M, Mazzocchi A, Morelli A, Bassotti G. Audit of constipation in a gastroenterology referral center. Dig Dis Sci. 2007;52:317–20. doi: 10.1007/s10620-006-9486-5. [DOI] [PubMed] [Google Scholar]
- 11.Serra J, Azpiroz F, Malagelada JR. Mechanisms of intestinal gas retention in humans: impaired propulsion versus obstructed evacuation. Am J Physiol Gastrointest Liver Physiol. 2001;281:G138–43. doi: 10.1152/ajpgi.2001.281.1.G138. [DOI] [PubMed] [Google Scholar]
- 12.Harder H, Serra J, Azpiroz F, Passos MC, Aguade S, Malagelada JR. Intestinal gas distribution determines abdominal symptoms. Gut. 2003;52:1708–13. doi: 10.1136/gut.52.12.1708. [DOI] [PMC free article] [PubMed] [Google Scholar]
- 13.Park SY, Burton D, Busciglio I, Eckert D, Camilleri M. Regional colonic transit pattern does not conclusively identify evacuation disorders in constipated patients with delayed colonic transit. J Neurogastroenterol Motil. 2016 doi: 10.5056/jnm16066. submitted. [DOI] [PMC free article] [PubMed] [Google Scholar]
- 14.Shin A, Camilleri M, Nadeau A, Nullens S, Rhee JC, Jeong ID, Burton DD. Interpretation of overall colonic transit in defecation disorders in males and females. Neurogastroenterol Motil. 2013;25:502–8. doi: 10.1111/nmo.12095. [DOI] [PMC free article] [PubMed] [Google Scholar]
- 15.Deiteren A, Camilleri M, Bharucha AE, Burton D, McKinzie S, Rao AS, Zinsmeister AR. Performance characteristics of scintigraphic colon transit measurement in health and irritable bowel syndrome and relationship to bowel functions. Neurogastroenterol Motil. 2010;22:415–23. doi: 10.1111/j.1365-2982.2009.01441.x. [DOI] [PMC free article] [PubMed] [Google Scholar]
- 16.Zinsmeister AR, Burton D, Camilleri M. Pharmacodynamic and clinical endpoints for functional colonic disorders: statistical considerations. Dig Dis Sci. 2013;58:509–18. doi: 10.1007/s10620-012-2369-z. [DOI] [PMC free article] [PubMed] [Google Scholar]
- 17.Camilleri M. Inclusion criteria for pharmacodynamic and clinical trials in chronic idiopathic constipation: pitfalls in using Rome III for functional constipation. Therap Adv Gastroenterol. 2011;4:159–63. doi: 10.1177/1756283X11401773. [DOI] [PMC free article] [PubMed] [Google Scholar]
- 18.Wald A, Bharucha AE, Cosman BC, Whitehead WE. ACG clinical guideline: management of benign anorectal disorders. Am J Gastroenterol. 2014;109:1141–57. doi: 10.1038/ajg.2014.190. [DOI] [PubMed] [Google Scholar]
- 19.Halder SL, Locke GR, 3rd, Schleck CD, Zinsmeister AR, Melton LJ, 3rd, Talley NJ. Natural history of functional gastrointestinal disorders: a 12-year longitudinal population-based study. Gastroenterology. 2007;133:799–807. doi: 10.1053/j.gastro.2007.06.010. [DOI] [PubMed] [Google Scholar]
- 20.Wong RK, Palsson OS, Turner MJ, Levy RL, Feld AD, von Korff M, Whitehead WE. Inability of the Rome III criteria to distinguish functional constipation from constipation-subtype irritable bowel syndrome. Am J Gastroenterol. 2010;105:2228–34. doi: 10.1038/ajg.2010.200. [DOI] [PMC free article] [PubMed] [Google Scholar]
- 21.Shekhar C, Monaghan PJ, Morris J, Issa B, Whorwell PJ, Keevil B, Houghton LA. Rome III functional constipation and irritable bowel syndrome with constipation are similar disorders within a spectrum of sensitization, regulated by serotonin. Gastroenterology. 2013;145:749–57. doi: 10.1053/j.gastro.2013.07.014. [DOI] [PubMed] [Google Scholar]
- 22.Ford AC, Bercik P, Morgan DG, Bolino C, Pintos-Sanchez MI, Moayyedi P. Characteristics of functional bowel disorder patients: a cross-sectional survey using the Rome III criteria. Aliment Pharmacol Ther. 2014;39:312–21. doi: 10.1111/apt.12573. [DOI] [PubMed] [Google Scholar]
- 23.Kolar GJ, Camilleri M, Burton D, Nadeau A, Zinsmeister AR. Prevalence of colonic motor or evacuation disorders in patients presenting with chronic nausea and vomiting evaluated by a single gastroenterologist in a tertiary referral practice. Neurogastroenterol Motil. 2014;26:131–8. doi: 10.1111/nmo.12242. [DOI] [PMC free article] [PubMed] [Google Scholar]
- 24.Fox JC, Fletcher JG, Zinsmeister AR, Seide B, Riederer SJ, Bharucha AE. Effect of aging on anorectal and pelvic floor functions in females. Dis Colon Rectum. 2006;49:1726–35. doi: 10.1007/s10350-006-0657-4. [DOI] [PubMed] [Google Scholar]
- 25.Rao SS, Hatfield R, Soffer E, Rao S, Beaty J, Conklin JL. Manometric tests of anorectal function in healthy adults. Am J Gastroenterol. 1999;94:773–83. doi: 10.1111/j.1572-0241.1999.00950.x. [DOI] [PubMed] [Google Scholar]
- 26.Cremonini F, Mullan BP, Camilleri M, Burton DD, Rank MR. Performance characteristics of scintigraphic transit measurements for studies of experimental therapies. Aliment Pharmacol Ther. 2002;16:1781–90. doi: 10.1046/j.1365-2036.2002.01344.x. [DOI] [PubMed] [Google Scholar]
- 27.Perez F, Accarino A, Azpiroz F, Quiroga S, Malagelada JR. Gas distribution within the human gut: effect of meals. Am J Gastroenterol. 2007;102:842–9. doi: 10.1111/j.1572-0241.2007.01071.x. [DOI] [PubMed] [Google Scholar]
- 28.Mc Williams SR, Mc Laughlin PD, O'Connor OJ, Desmond AN, Ni Laoire A, Shanahan F, Quigley EM, Maher MM. Computed tomography assessment of intestinal gas volumes in functional gastrointestinal disorders. J Neurogastroenterol Motil. 2012;18:419–25. doi: 10.5056/jnm.2012.18.4.419. [DOI] [PMC free article] [PubMed] [Google Scholar]
- 29.Geraghty EM, Boone JM, McGahan JP, Jain K. Normal organ volume assessment from abdominal CT. Abdom Imaging. 2004;29:482–90. doi: 10.1007/s00261-003-0139-2. [DOI] [PubMed] [Google Scholar]
- 30.Kirihara Y, Takahashi N, Hashimoto Y, Sclabas GM, Khan S, Moriya T, Sakagami J, Huebner M, Sarr MG, Farnell MB. Prediction of pancreatic anastomotic failure after pancreatoduodenectomy: the use of preoperative, quantitative computed tomography to measure remnant pancreatic volume and body composition. Annals of surgery. 2013;257:512–9. doi: 10.1097/SLA.0b013e31827827d0. [DOI] [PubMed] [Google Scholar]
- 31.Benninga MA, Tabbers MM, van Rijn RR. How to use a plain abdominal radiograph in children with functional defecation disorders. Arch Dis Child Educ Pract Ed. 2016;20:2015–309140. doi: 10.1136/archdischild-2015-309140. [DOI] [PubMed] [Google Scholar]
- 32.Rao SS, Mudipalli RS, Stessman M, Zimmerman B. Investigation of the utility of colorectal function tests and Rome II criteria in dyssynergic defecation (Anismus) Neurogastroenterol Motil. 2004;16:589–96. doi: 10.1111/j.1365-2982.2004.00526.x. [DOI] [PubMed] [Google Scholar]
- 33.Chitkara DK, Bredenoord AJ, Cremonini F, Delgado-Aros S, Smoot RL, El-Youssef M, Freese D, Camilleri M. The role of pelvic floor dysfunction and slow colonic transit in adolescents with refractory constipation. Am J Gastroenterol. 2004;99:1579–84. doi: 10.1111/j.1572-0241.2004.30176.x. [DOI] [PubMed] [Google Scholar]
- 34.Grotz RL, Pemberton JH, Talley NJ, Rath DM, Zinsmeister AR. Discriminant value of psychological distress, symptom profiles, and segmental colonic dysfunction in outpatients with severe idiopathic constipation. Gut. 1994;35:798–802. doi: 10.1136/gut.35.6.798. [DOI] [PMC free article] [PubMed] [Google Scholar]
- 35.Koide A, Yamaguchi T, Odaka T, Koyama H, Tsuyuguchi T, Kitahara H, Ohto M, Saisho H. Quantitative analysis of bowel gas using plain abdominal radiograph in patients with irritable bowel syndrome. Am J Gastroenterol. 2000;95:1735–41. doi: 10.1111/j.1572-0241.2000.02189.x. [DOI] [PubMed] [Google Scholar]
- 36.Park SY, Park HB, Lee JM, Lee HJ, Park CH, Kim HS, Choi SK, Rew JS. Relevance of Colonic Gas Analysis and Transit Study in Patients With Chronic Constipation. J Neurogastroenterol Motil. 2015;21:433–9. doi: 10.5056/jnm14109. [DOI] [PMC free article] [PubMed] [Google Scholar]
- 37.Seike K, Koda K, Oda K, Kondo E, Ishizuka M, Miyazaki M. Relevance of abdominal gas analysis and transit study after colorectal cancer surgery. Scandinavian journal of gastroenterology. 2003;38:387–91. doi: 10.1080/00365520310000898. [DOI] [PubMed] [Google Scholar]
- 38.Seike K, Koda K, Takiguchi N, Oda K, Miyazaki M. Gas volume analysis and postoperative bowel functional disorders in patients who received anterior resection for rectal cancer. Dis Colon Rectum. 2003;46:661–6. doi: 10.1007/s10350-004-6628-8. [DOI] [PubMed] [Google Scholar]
Associated Data
This section collects any data citations, data availability statements, or supplementary materials included in this article.


