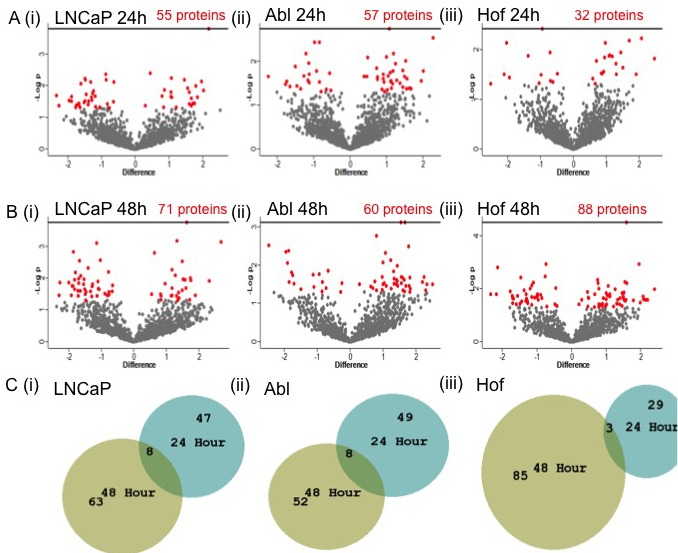
Figure 3. Significantly changing proteins in response to low glucose conditions in PCa cell lines.

Student's t-test analysis (p < 0.05) was performed on each cell line to determine the effects of incubation in low glucose on protein expression. The volcano plots reflect the statistically significantly changed proteins (red) identified from Student's t-test analysis of each cell line after 24h A. and 48h B. culturing in low glucose conditions. A small number of proteins were found to be commonly significantly changed within each cell line at both time points C.
