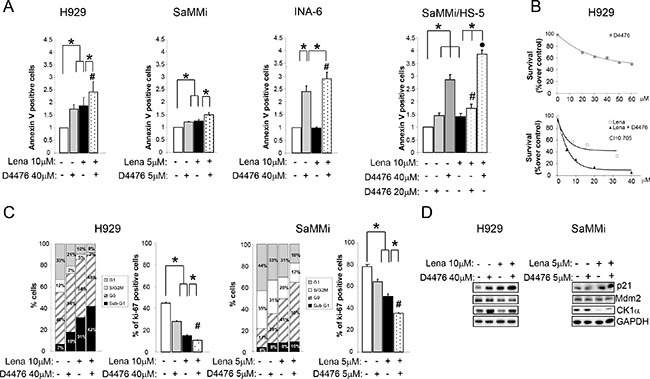
Figure 7. Lenalidomide empowers D4476-induced apoptosis and cell cycle arrest.

MM cells were treated with Lena for 3 days (SaMMi, INA-6) or 7 days (H929), with D4476 for the last 48 h and with the combination of the two compounds at the doses indicated in the Figure. (A) Annexin V/PI staining and FACS analysis of the Lena sensitive cell lines, H929, SaMMi grown alone, or in co-culture with HS-5 (SaMMi/HS-5) and of the Lena resistant INA-6. (B) Synergistic effect of D4476 and Lena in reducing cell viability. Upper graph: dose response curve of H929 incubated for 72 hours with increasing concentrations of D4476 (grey squared curve). Lower graph: dose-response curve of cells incubated for 1 week with increasing concentrations of Lena alone (white round curve) or Lena plus D4476 (black triangle curve). In the combination treatment, D4476 was added for the last 72 h. Cell viability was assessed with MTT test and reported as percentage over DMSO treated cells. IC50 for D4476 was 60 μM and for Lena 10 μM. The CI between D4476 and Lena was calculated as to be 0.705. (C) Cell cycle analysis with Ki-67/PI staining (left panel) and total Ki-67 (right panel) in H929 and SaMMi cells. * indicates p < 0.05; # indicates p < 0.05 between samples treated with D4476 together with Lena and cells treated only with D4476. Data represent the mean ± SEM of three independent experiments. (D) Expression analysis of p21, Mdm2 and CK1α in H929 and SaMMi. GAPDH was used as loading control.
